Bolometer Market Size and Share Forecast Outlook 2025 to 2035

The Bolometer Market is estimated to be valued at USD 2.8 billion in 2025 and is projected to reach USD 5.3 billion by 2035, registering a compound annual growth rate (CAGR) of 6.5% over the forecast period.
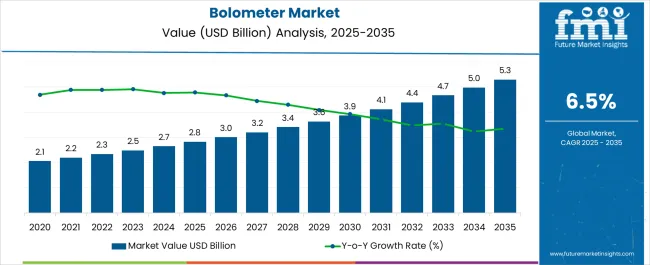
Quick Stats for Bolometer Market

  • Bolometer Market Value (2025): USD 2.8 billion
  • Bolometer Market Forecast Value (2035): USD 5.3 billion
  • Bolometer Market Forecast CAGR: 6.5%
  • Leading Segment in Bolometer Market in 2025: Semiconductor Bolometer (45.0%)
  • Key Growth Regions in Bolometer Market: North America, Asia-Pacific, Europe
  • Top Key Players in Bolometer Market: FLIR Systems, BAE Systems, Honeywell, L-3 Communications, Mikrosens, Teledyne DALSA, Infrared Laboratories, Testo, Raytheon, GE, Hamamatsu

Bolometer Market Market Value Analysis

Bolometer Market Key Takeaways

Metric Value
Bolometer Market Estimated Value in (2025 E) USD 2.8 billion
Bolometer Market Forecast Value in (2035 F) USD 5.3 billion
Forecast CAGR (2025 to 2035) 6.5%

Why is the Bolometer Market Growing?

Market Overview:

The Bolometer market is witnessing steady growth driven by rising demand for highly sensitive thermal detection systems across multiple industries. The market growth is being supported by advancements in material science, particularly in semiconductor technologies, which have improved sensitivity, response time, and accuracy of bolometer devices. Increasing applications in automotive, aerospace, and astronomical research are further expanding adoption, as these industries require precise temperature measurements and infrared detection capabilities.

Investment in research and development of low-noise, high-resolution thermal imaging systems has enhanced the capabilities of bolometers, enabling their integration into modern sensing systems. The market outlook is further strengthened by the need for efficient environmental monitoring, industrial process control, and safety applications, where accurate thermal sensing is critical.

The growing emphasis on intelligent vehicle safety systems, such as pedestrian detection and autonomous driving technologies, also contributes to bolometer deployment Overall, as technological innovations continue and demand for high-precision thermal detection increases, the Bolometer market is expected to sustain consistent growth globally.

Segmental Analysis

The bolometer market is segmented by type, application, end use industry, and geographic regions. By type, bolometer market is divided into Semiconductor Bolometer, Superconducting Bolometer, and Hot Electron Bolometer. In terms of application, bolometer market is classified into Astronomical Applications, Detection Of Forest Fire, Air Surveillance, In Fingerprint Scanners, Detection Of Concealed Weapons, In Particle Detectors, and In Thermal Cameras. Based on end use industry, bolometer market is segmented into Automotive, Aerospace, Defence And Security, and Others (Scientific Research). Regionally, the bolometer industry is classified into North America, Latin America, Western Europe, Eastern Europe, Balkan & Baltic Countries, Russia & Belarus, Central Asia, East Asia, South Asia & Pacific, and the Middle East & Africa.
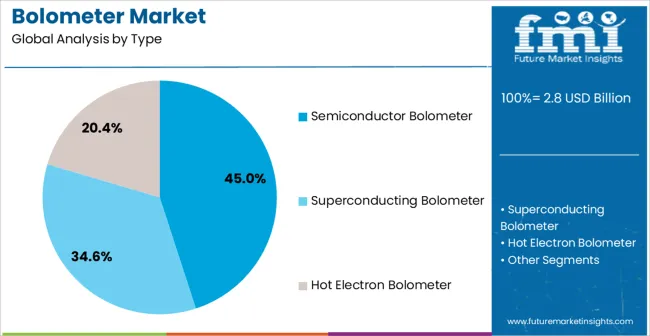
Insights into the Semiconductor Bolometer Segment

Bolometer Market Analysis By Type

The Semiconductor Bolometer segment is projected to hold 45.00% of the Bolometer market revenue in 2025, making it the leading type in the industry. This dominance is attributed to the high sensitivity, stability, and fast response offered by semiconductor materials, which allow precise measurement of incident infrared radiation. Semiconductor bolometers are widely adopted in applications requiring reliable performance under varying environmental conditions, including industrial monitoring, automotive safety systems, and scientific research.

Growth has been fueled by the ability to integrate semiconductor bolometers into compact, modular devices while maintaining high accuracy and low noise performance. Their compatibility with modern electronic systems and ease of scalability for large sensor arrays have further reinforced their market position.

Additionally, the low power consumption and long-term durability of semiconductor bolometers have made them a preferred choice among system designers seeking both performance and cost-effectiveness Future growth is expected to continue as semiconductor-based designs evolve to meet higher resolution and faster response requirements for advanced applications.
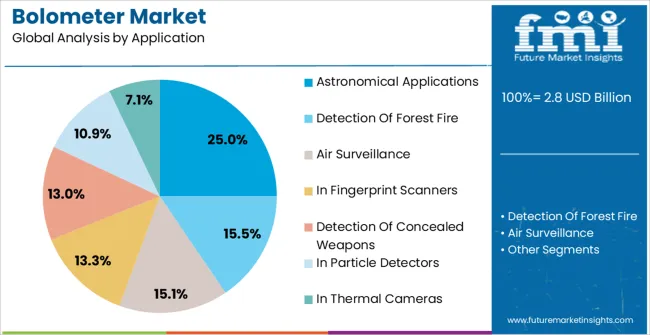
Insights into the Astronomical Applications Segment

Bolometer Market Analysis By Application

The Astronomical Applications segment is expected to account for 25.00% of the Bolometer market revenue in 2025, reflecting its leading role in scientific and research use cases. The high sensitivity and accuracy of bolometers make them essential in detecting faint cosmic radiation and thermal signals in space observatories and telescopes. Growth in this segment has been driven by increased investment in space research programs, the development of next-generation telescopes, and international collaboration on deep-space missions.

Bolometers are particularly favored for infrared astronomy, where precision thermal detection is critical for analyzing celestial bodies and cosmic phenomena. The adoption of advanced semiconductor bolometers within this application has improved signal-to-noise ratios and enabled more detailed data collection.

Furthermore, the push for miniaturized, lightweight, and highly sensitive thermal sensors for satellite payloads has enhanced the role of bolometers in astronomical research Continuous advancements in material technology and cooling systems are expected to expand the utility of bolometers in space exploration and observational astronomy.
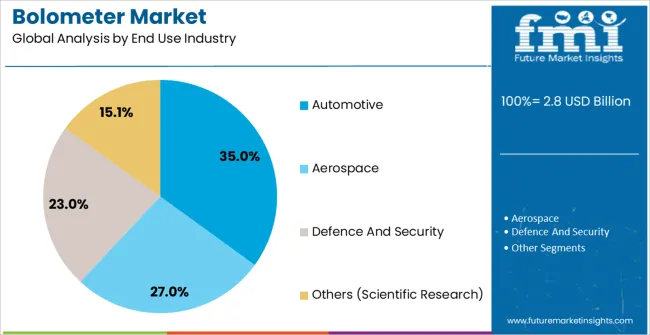
Insights into the Automotive Segment

Bolometer Market Analysis By End Use Industry

The Automotive end-use industry segment is projected to hold 35.00% of the Bolometer market revenue in 2025, establishing it as the largest end-use sector. The growth of this segment has been primarily driven by the increasing integration of thermal imaging systems in vehicles for pedestrian detection, driver assistance, and autonomous navigation technologies. Bolometers are being deployed to provide enhanced safety features by detecting heat signatures in low visibility conditions such as fog, rain, or nighttime driving.

The adoption has been accelerated by rising regulations and safety standards in automotive design, which emphasize the need for advanced sensing technologies to prevent accidents. Semiconductor bolometers, with their high sensitivity and reliability, are particularly suited for these automotive applications due to their compact form factor and compatibility with in-vehicle electronic systems.

Additionally, growing demand for intelligent and autonomous vehicles has reinforced the adoption of thermal detection solutions Continuous improvements in sensor resolution, response speed, and integration capabilities are expected to further strengthen the automotive sector’s contribution to bolometer market growth.

Market Overview

Bolometer Market: Introduction

A bolometer is an instrument used to measure heat or infrared radiation. It is basically a highly sensitive thermometer. Bolometer can be utilized in combination of spectroscopy to gather information related to structures of certain chemical compounds.

A bolometer consists of an absorptive component made up of a thin metal layer (such as a strip of blackened platinum metal). The absorptive element is connected to a thermal reservoir through a thermal linkage. When radiation comes in contact with the absorptive strip, its temperature rises above the reservoir’s temperature due to the absorption of radiation by the absorptive element. i.e radiation falling on the strip changes its resistance to initiate an electric current. This change of resistance is logged by a sensitive electric meter.

Some of the benefits of bolometer include; it can measure non-ionizing particles in addition to ionizing particles and photons. It is extremely efficient in terms of sensitivity and energy resolution when compared to other conventional particle detectors.

It operates at room temperature and hence does not require cooling. The applications of bolometer include astronomical applications, detection of the forest fire, Air surveillance, in fingerprint scanners, detection of concealed weapons, in particle detectors and in thermal cameras.
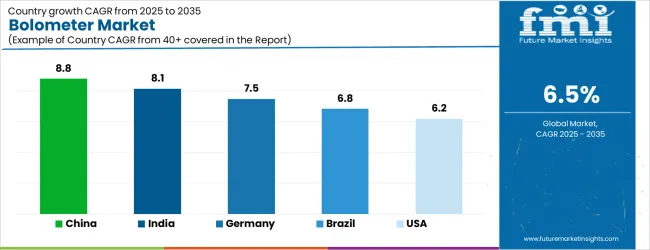
Analysis of Bolometer Market By Key Countries

Bolometer Market Cagr Analysis By Country

Country CAGR
China 8.8%
India 8.1%
Germany 7.5%
Brazil 6.8%
USA 6.2%
UK 5.5%
Japan 4.9%

Country-wise Analysis

The Bolometer Market is expected to register a CAGR of 6.5% during the forecast period, exhibiting varied country level momentum. China leads with the highest CAGR of 8.8%, followed by India at 8.1%. Developed markets such as Germany, France, and the UK continue to expand steadily, while the USA is likely to grow at consistent rates. Japan posts the lowest CAGR at 4.9%, yet still underscores a broadly positive trajectory for the global Bolometer Market. In 2024, Germany held a dominant revenue in the Western Europe market and is expected to grow with a CAGR of 7.5%. The USA Bolometer Market is estimated to be valued at USD 992.9 million in 2025 and is anticipated to reach a valuation of USD 992.9 million by 2035. Sales are projected to rise at a CAGR of 0.0% over the forecast period between 2025 and 2035. While Japan and South Korea markets are estimated to be valued at USD 140.6 million and USD 92.0 million respectively in 2025.
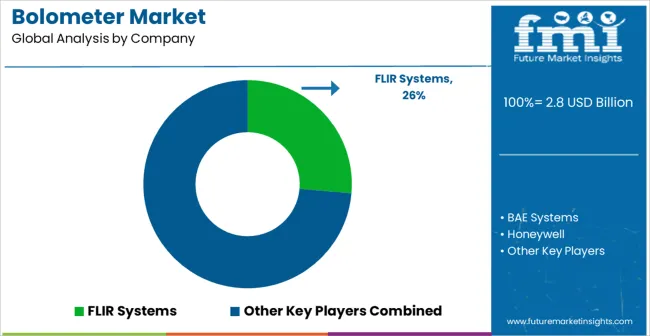
Key Players in the Bolometer Market

Bolometer Market Analysis By Company

  • FLIR Systems
  • BAE Systems
  • Honeywell
  • L-3 Communications
  • Mikrosens
  • Teledyne DALSA
  • Infrared Laboratories
  • Testo
  • Raytheon
  • GE
  • Hamamatsu

Scope of the Report

Item Value
Quantitative Units USD 2.8 Billion
Type Semiconductor Bolometer, Superconducting Bolometer, and Hot Electron Bolometer
Application Astronomical Applications, Detection Of Forest Fire, Air Surveillance, In Fingerprint Scanners, Detection Of Concealed Weapons, In Particle Detectors, and In Thermal Cameras
End Use Industry Automotive, Aerospace, Defence And Security, and Others (Scientific Research)
Regions Covered North America, Europe, Asia-Pacific, Latin America, Middle East & Africa
Country Covered United States, Canada, Germany, France, United Kingdom, China, Japan, India, Brazil, South Africa
Key Companies Profiled FLIR Systems, BAE Systems, Honeywell, L-3 Communications, Mikrosens, Teledyne DALSA, Infrared Laboratories, Testo, Raytheon, GE, and Hamamatsu

Bolometer Market by Segments

Type:

  • Semiconductor Bolometer
  • Superconducting Bolometer
  • Hot Electron Bolometer

Application:

  • Astronomical Applications
  • Detection Of Forest Fire
  • Air Surveillance
  • In Fingerprint Scanners
  • Detection Of Concealed Weapons
  • In Particle Detectors
  • In Thermal Cameras

End Use Industry:

  • Automotive
  • Aerospace
  • Defence And Security
  • Others (Scientific Research)

Region:

  • North America
    • USA
    • Canada
    • Mexico
  • Latin America
    • Brazil
    • Chile
    • Rest of Latin America
  • Western Europe
    • Germany
    • UK
    • Italy
    • Spain
    • France
    • Nordic
    • BENELUX
    • Rest of Western Europe
  • Eastern Europe
    • Russia
    • Poland
    • Hungary
    • Balkan & Baltic
    • Rest of Eastern Europe
  • East Asia
    • China
    • Japan
    • South Korea
  • South Asia and Pacific
    • India
    • ASEAN
    • Australia & New Zealand
    • Rest of South Asia and Pacific
  • Middle East & Africa
    • Kingdom of Saudi Arabia
    • Other GCC Countries
    • Turkiye
    • South Africa
    • Other African Union
    • Rest of Middle East & Africa

Frequently Asked Questions

How big is the bolometer market in 2025?

The global bolometer market is estimated to be valued at USD 2.8 billion in 2025.

What will be the size of bolometer market in 2035?

The market size for the bolometer market is projected to reach USD 5.3 billion by 2035.

How much will be the bolometer market growth between 2025 and 2035?

The bolometer market is expected to grow at a 6.5% CAGR between 2025 and 2035.

What are the key product types in the bolometer market?

The key product types in bolometer market are semiconductor bolometer, superconducting bolometer and hot electron bolometer.

Which application segment to contribute significant share in the bolometer market in 2025?

In terms of application, astronomical applications segment to command 25.0% share in the bolometer market in 2025.

Table of Content

  1. Executive Summary
    • Global Market Outlook
    • Demand-side Trends
    • Supply-side Trends
    • Technology Roadmap Analysis
    • Analysis and Recommendations
  2. Market Overview
    • Market Coverage / Taxonomy
    • Market Definition / Scope / Limitations
  3. Market Background
    • Market Dynamics
      • Drivers
      • Restraints
      • Opportunity
      • Trends
    • Scenario Forecast
      • Demand in Optimistic Scenario
      • Demand in Likely Scenario
      • Demand in Conservative Scenario
    • Opportunity Map Analysis
    • Product Life Cycle Analysis
    • Supply Chain Analysis
    • Investment Feasibility Matrix
    • Value Chain Analysis
    • PESTLE and Porter’s Analysis
    • Regulatory Landscape
    • Regional Parent Market Outlook
    • Production and Consumption Statistics
    • Import and Export Statistics
  4. Global Market Analysis 2020-2024 and Forecast, 2025-2035
    • Historical Market Size Value (USD Million) Analysis, 2020-2024
    • Current and Future Market Size Value (USD Million) Projections, 2025-2035
      • Y-o-Y Growth Trend Analysis
      • Absolute $ Opportunity Analysis
  5. Global Market Pricing Analysis 2020-2024 and Forecast 2025-2035
  6. Global Market Analysis 2020-2024 and Forecast 2025-2035, By Type
    • Introduction / Key Findings
    • Historical Market Size Value (USD Million) Analysis By Type , 2020-2024
    • Current and Future Market Size Value (USD Million) Analysis and Forecast By Type , 2025-2035
      • Semiconductor Bolometer
      • Superconducting Bolometer
      • Hot Electron Bolometer
    • Y-o-Y Growth Trend Analysis By Type , 2020-2024
    • Absolute $ Opportunity Analysis By Type , 2025-2035
  7. Global Market Analysis 2020-2024 and Forecast 2025-2035, By Application
    • Introduction / Key Findings
    • Historical Market Size Value (USD Million) Analysis By Application, 2020-2024
    • Current and Future Market Size Value (USD Million) Analysis and Forecast By Application, 2025-2035
      • Astronomical Applications
      • Detection Of Forest Fire
      • Air Surveillance
      • In Fingerprint Scanners
      • Detection Of Concealed Weapons
      • In Particle Detectors
      • In Thermal Cameras
    • Y-o-Y Growth Trend Analysis By Application, 2020-2024
    • Absolute $ Opportunity Analysis By Application, 2025-2035
  8. Global Market Analysis 2020-2024 and Forecast 2025-2035, By End Use Industry
    • Introduction / Key Findings
    • Historical Market Size Value (USD Million) Analysis By End Use Industry, 2020-2024
    • Current and Future Market Size Value (USD Million) Analysis and Forecast By End Use Industry, 2025-2035
      • Automotive
      • Aerospace
      • Defence And Security
      • Others (Scientific Research)
    • Y-o-Y Growth Trend Analysis By End Use Industry, 2020-2024
    • Absolute $ Opportunity Analysis By End Use Industry, 2025-2035
  9. Global Market Analysis 2020-2024 and Forecast 2025-2035, By Region
    • Introduction
    • Historical Market Size Value (USD Million) Analysis By Region, 2020-2024
    • Current Market Size Value (USD Million) Analysis and Forecast By Region, 2025-2035
      • North America
      • Latin America
      • Western Europe
      • Eastern Europe
      • East Asia
      • South Asia and Pacific
      • Middle East & Africa
    • Market Attractiveness Analysis By Region
  10. North America Market Analysis 2020-2024 and Forecast 2025-2035, By Country
    • Historical Market Size Value (USD Million) Trend Analysis By Market Taxonomy, 2020-2024
    • Market Size Value (USD Million) Forecast By Market Taxonomy, 2025-2035
      • By Country
        • USA
        • Canada
        • Mexico
      • By Type
      • By Application
      • By End Use Industry
    • Market Attractiveness Analysis
      • By Country
      • By Type
      • By Application
      • By End Use Industry
    • Key Takeaways
  11. Latin America Market Analysis 2020-2024 and Forecast 2025-2035, By Country
    • Historical Market Size Value (USD Million) Trend Analysis By Market Taxonomy, 2020-2024
    • Market Size Value (USD Million) Forecast By Market Taxonomy, 2025-2035
      • By Country
        • Brazil
        • Chile
        • Rest of Latin America
      • By Type
      • By Application
      • By End Use Industry
    • Market Attractiveness Analysis
      • By Country
      • By Type
      • By Application
      • By End Use Industry
    • Key Takeaways
  12. Western Europe Market Analysis 2020-2024 and Forecast 2025-2035, By Country
    • Historical Market Size Value (USD Million) Trend Analysis By Market Taxonomy, 2020-2024
    • Market Size Value (USD Million) Forecast By Market Taxonomy, 2025-2035
      • By Country
        • Germany
        • UK
        • Italy
        • Spain
        • France
        • Nordic
        • BENELUX
        • Rest of Western Europe
      • By Type
      • By Application
      • By End Use Industry
    • Market Attractiveness Analysis
      • By Country
      • By Type
      • By Application
      • By End Use Industry
    • Key Takeaways
  13. Eastern Europe Market Analysis 2020-2024 and Forecast 2025-2035, By Country
    • Historical Market Size Value (USD Million) Trend Analysis By Market Taxonomy, 2020-2024
    • Market Size Value (USD Million) Forecast By Market Taxonomy, 2025-2035
      • By Country
        • Russia
        • Poland
        • Hungary
        • Balkan & Baltic
        • Rest of Eastern Europe
      • By Type
      • By Application
      • By End Use Industry
    • Market Attractiveness Analysis
      • By Country
      • By Type
      • By Application
      • By End Use Industry
    • Key Takeaways
  14. East Asia Market Analysis 2020-2024 and Forecast 2025-2035, By Country
    • Historical Market Size Value (USD Million) Trend Analysis By Market Taxonomy, 2020-2024
    • Market Size Value (USD Million) Forecast By Market Taxonomy, 2025-2035
      • By Country
        • China
        • Japan
        • South Korea
      • By Type
      • By Application
      • By End Use Industry
    • Market Attractiveness Analysis
      • By Country
      • By Type
      • By Application
      • By End Use Industry
    • Key Takeaways
  15. South Asia and Pacific Market Analysis 2020-2024 and Forecast 2025-2035, By Country
    • Historical Market Size Value (USD Million) Trend Analysis By Market Taxonomy, 2020-2024
    • Market Size Value (USD Million) Forecast By Market Taxonomy, 2025-2035
      • By Country
        • India
        • ASEAN
        • Australia & New Zealand
        • Rest of South Asia and Pacific
      • By Type
      • By Application
      • By End Use Industry
    • Market Attractiveness Analysis
      • By Country
      • By Type
      • By Application
      • By End Use Industry
    • Key Takeaways
  16. Middle East & Africa Market Analysis 2020-2024 and Forecast 2025-2035, By Country
    • Historical Market Size Value (USD Million) Trend Analysis By Market Taxonomy, 2020-2024
    • Market Size Value (USD Million) Forecast By Market Taxonomy, 2025-2035
      • By Country
        • Kingdom of Saudi Arabia
        • Other GCC Countries
        • Turkiye
        • South Africa
        • Other African Union
        • Rest of Middle East & Africa
      • By Type
      • By Application
      • By End Use Industry
    • Market Attractiveness Analysis
      • By Country
      • By Type
      • By Application
      • By End Use Industry
    • Key Takeaways
  17. Key Countries Market Analysis
    • USA
      • Pricing Analysis
      • Market Share Analysis, 2024
        • By Type
        • By Application
        • By End Use Industry
    • Canada
      • Pricing Analysis
      • Market Share Analysis, 2024
        • By Type
        • By Application
        • By End Use Industry
    • Mexico
      • Pricing Analysis
      • Market Share Analysis, 2024
        • By Type
        • By Application
        • By End Use Industry
    • Brazil
      • Pricing Analysis
      • Market Share Analysis, 2024
        • By Type
        • By Application
        • By End Use Industry
    • Chile
      • Pricing Analysis
      • Market Share Analysis, 2024
        • By Type
        • By Application
        • By End Use Industry
    • Germany
      • Pricing Analysis
      • Market Share Analysis, 2024
        • By Type
        • By Application
        • By End Use Industry
    • UK
      • Pricing Analysis
      • Market Share Analysis, 2024
        • By Type
        • By Application
        • By End Use Industry
    • Italy
      • Pricing Analysis
      • Market Share Analysis, 2024
        • By Type
        • By Application
        • By End Use Industry
    • Spain
      • Pricing Analysis
      • Market Share Analysis, 2024
        • By Type
        • By Application
        • By End Use Industry
    • France
      • Pricing Analysis
      • Market Share Analysis, 2024
        • By Type
        • By Application
        • By End Use Industry
    • India
      • Pricing Analysis
      • Market Share Analysis, 2024
        • By Type
        • By Application
        • By End Use Industry
    • ASEAN
      • Pricing Analysis
      • Market Share Analysis, 2024
        • By Type
        • By Application
        • By End Use Industry
    • Australia & New Zealand
      • Pricing Analysis
      • Market Share Analysis, 2024
        • By Type
        • By Application
        • By End Use Industry
    • China
      • Pricing Analysis
      • Market Share Analysis, 2024
        • By Type
        • By Application
        • By End Use Industry
    • Japan
      • Pricing Analysis
      • Market Share Analysis, 2024
        • By Type
        • By Application
        • By End Use Industry
    • South Korea
      • Pricing Analysis
      • Market Share Analysis, 2024
        • By Type
        • By Application
        • By End Use Industry
    • Russia
      • Pricing Analysis
      • Market Share Analysis, 2024
        • By Type
        • By Application
        • By End Use Industry
    • Poland
      • Pricing Analysis
      • Market Share Analysis, 2024
        • By Type
        • By Application
        • By End Use Industry
    • Hungary
      • Pricing Analysis
      • Market Share Analysis, 2024
        • By Type
        • By Application
        • By End Use Industry
    • Kingdom of Saudi Arabia
      • Pricing Analysis
      • Market Share Analysis, 2024
        • By Type
        • By Application
        • By End Use Industry
    • Turkiye
      • Pricing Analysis
      • Market Share Analysis, 2024
        • By Type
        • By Application
        • By End Use Industry
    • South Africa
      • Pricing Analysis
      • Market Share Analysis, 2024
        • By Type
        • By Application
        • By End Use Industry
  18. Market Structure Analysis
    • Competition Dashboard
    • Competition Benchmarking
    • Market Share Analysis of Top Players
      • By Regional
      • By Type
      • By Application
      • By End Use Industry
  19. Competition Analysis
    • Competition Deep Dive
      • FLIR Systems
        • Overview
        • Product Portfolio
        • Profitability by Market Segments (Product/Age /Sales Channel/Region)
        • Sales Footprint
        • Strategy Overview
          • Marketing Strategy
          • Product Strategy
          • Channel Strategy
      • BAE Systems
      • Honeywell
      • L-3 Communications
      • Mikrosens
      • Teledyne DALSA
      • Infrared Laboratories
      • Testo
      • Raytheon
      • GE
      • Hamamatsu
  20. Assumptions & Acronyms Used
  21. Research Methodology

List of Tables

  • Table 1: Global Market Value (USD Million) Forecast by Region, 2020-2035
  • Table 2: Global Market Value (USD Million) Forecast by Type , 2020-2035
  • Table 3: Global Market Value (USD Million) Forecast by Application, 2020-2035
  • Table 4: Global Market Value (USD Million) Forecast by End Use Industry, 2020-2035
  • Table 5: North America Market Value (USD Million) Forecast by Country, 2020-2035
  • Table 6: North America Market Value (USD Million) Forecast by Type , 2020-2035
  • Table 7: North America Market Value (USD Million) Forecast by Application, 2020-2035
  • Table 8: North America Market Value (USD Million) Forecast by End Use Industry, 2020-2035
  • Table 9: Latin America Market Value (USD Million) Forecast by Country, 2020-2035
  • Table 10: Latin America Market Value (USD Million) Forecast by Type , 2020-2035
  • Table 11: Latin America Market Value (USD Million) Forecast by Application, 2020-2035
  • Table 12: Latin America Market Value (USD Million) Forecast by End Use Industry, 2020-2035
  • Table 13: Western Europe Market Value (USD Million) Forecast by Country, 2020-2035
  • Table 14: Western Europe Market Value (USD Million) Forecast by Type , 2020-2035
  • Table 15: Western Europe Market Value (USD Million) Forecast by Application, 2020-2035
  • Table 16: Western Europe Market Value (USD Million) Forecast by End Use Industry, 2020-2035
  • Table 17: Eastern Europe Market Value (USD Million) Forecast by Country, 2020-2035
  • Table 18: Eastern Europe Market Value (USD Million) Forecast by Type , 2020-2035
  • Table 19: Eastern Europe Market Value (USD Million) Forecast by Application, 2020-2035
  • Table 20: Eastern Europe Market Value (USD Million) Forecast by End Use Industry, 2020-2035
  • Table 21: East Asia Market Value (USD Million) Forecast by Country, 2020-2035
  • Table 22: East Asia Market Value (USD Million) Forecast by Type , 2020-2035
  • Table 23: East Asia Market Value (USD Million) Forecast by Application, 2020-2035
  • Table 24: East Asia Market Value (USD Million) Forecast by End Use Industry, 2020-2035
  • Table 25: South Asia and Pacific Market Value (USD Million) Forecast by Country, 2020-2035
  • Table 26: South Asia and Pacific Market Value (USD Million) Forecast by Type , 2020-2035
  • Table 27: South Asia and Pacific Market Value (USD Million) Forecast by Application, 2020-2035
  • Table 28: South Asia and Pacific Market Value (USD Million) Forecast by End Use Industry, 2020-2035
  • Table 29: Middle East & Africa Market Value (USD Million) Forecast by Country, 2020-2035
  • Table 30: Middle East & Africa Market Value (USD Million) Forecast by Type , 2020-2035
  • Table 31: Middle East & Africa Market Value (USD Million) Forecast by Application, 2020-2035
  • Table 32: Middle East & Africa Market Value (USD Million) Forecast by End Use Industry, 2020-2035

List of Figures

  • Figure 1: Global Market Pricing Analysis
  • Figure 2: Global Market Value (USD Mn) Forecast 2020–2035
  • Figure 3: Global Market Value Share and BPS Analysis by Type , 2025 and 2035
  • Figure 4: Global Market Y-o-Y Growth Comparison by Type , 2025 to 2035
  • Figure 5: Global Market Attractiveness Analysis by Type
  • Figure 6: Global Market Value Share and BPS Analysis by Application, 2025 and 2035
  • Figure 7: Global Market Y-o-Y Growth Comparison by Application, 2025 to 2035
  • Figure 8: Global Market Attractiveness Analysis by Application
  • Figure 9: Global Market Value Share and BPS Analysis by End Use Industry, 2025 and 2035
  • Figure 10: Global Market Y-o-Y Growth Comparison by End Use Industry, 2025 to 2035
  • Figure 11: Global Market Attractiveness Analysis by End Use Industry
  • Figure 12: Global Market Value (USD Mn) Share and BPS Analysis by Region, 2025 and 2035
  • Figure 13: Global Market Y-o-Y Growth Comparison by Region, 2025 to 2035
  • Figure 14: Global Market Attractiveness Analysis by Region
  • Figure 15: North America Market Incremental Dollar Opportunity, 2025 to 2035
  • Figure 16: Latin America Market Incremental Dollar Opportunity, 2025 to 2035
  • Figure 17: Western Europe Market Incremental Dollar Opportunity, 2025 to 2035
  • Figure 18: Eastern Europe Market Incremental Dollar Opportunity, 2025 to 2035
  • Figure 19: East Asia Market Incremental Dollar Opportunity, 2025 to 2035
  • Figure 20: South Asia and Pacific Market Incremental Dollar Opportunity, 2025 to 2035
  • Figure 21: Middle East & Africa Market Incremental Dollar Opportunity, 2025 to 2035
  • Figure 22: North America Market Value Share and BPS Analysis by Country, 2025 and 2035
  • Figure 23: North America Market Value Share and BPS Analysis by Type , 2025 and 2035
  • Figure 24: North America Market Y-o-Y Growth Comparison by Type , 2025 to 2035
  • Figure 25: North America Market Attractiveness Analysis by Type
  • Figure 26: North America Market Value Share and BPS Analysis by Application, 2025 and 2035
  • Figure 27: North America Market Y-o-Y Growth Comparison by Application, 2025 to 2035
  • Figure 28: North America Market Attractiveness Analysis by Application
  • Figure 29: North America Market Value Share and BPS Analysis by End Use Industry, 2025 and 2035
  • Figure 30: North America Market Y-o-Y Growth Comparison by End Use Industry, 2025 to 2035
  • Figure 31: North America Market Attractiveness Analysis by End Use Industry
  • Figure 32: Latin America Market Value Share and BPS Analysis by Country, 2025 and 2035
  • Figure 33: Latin America Market Value Share and BPS Analysis by Type , 2025 and 2035
  • Figure 34: Latin America Market Y-o-Y Growth Comparison by Type , 2025 to 2035
  • Figure 35: Latin America Market Attractiveness Analysis by Type
  • Figure 36: Latin America Market Value Share and BPS Analysis by Application, 2025 and 2035
  • Figure 37: Latin America Market Y-o-Y Growth Comparison by Application, 2025 to 2035
  • Figure 38: Latin America Market Attractiveness Analysis by Application
  • Figure 39: Latin America Market Value Share and BPS Analysis by End Use Industry, 2025 and 2035
  • Figure 40: Latin America Market Y-o-Y Growth Comparison by End Use Industry, 2025 to 2035
  • Figure 41: Latin America Market Attractiveness Analysis by End Use Industry
  • Figure 42: Western Europe Market Value Share and BPS Analysis by Country, 2025 and 2035
  • Figure 43: Western Europe Market Value Share and BPS Analysis by Type , 2025 and 2035
  • Figure 44: Western Europe Market Y-o-Y Growth Comparison by Type , 2025 to 2035
  • Figure 45: Western Europe Market Attractiveness Analysis by Type
  • Figure 46: Western Europe Market Value Share and BPS Analysis by Application, 2025 and 2035
  • Figure 47: Western Europe Market Y-o-Y Growth Comparison by Application, 2025 to 2035
  • Figure 48: Western Europe Market Attractiveness Analysis by Application
  • Figure 49: Western Europe Market Value Share and BPS Analysis by End Use Industry, 2025 and 2035
  • Figure 50: Western Europe Market Y-o-Y Growth Comparison by End Use Industry, 2025 to 2035
  • Figure 51: Western Europe Market Attractiveness Analysis by End Use Industry
  • Figure 52: Eastern Europe Market Value Share and BPS Analysis by Country, 2025 and 2035
  • Figure 53: Eastern Europe Market Value Share and BPS Analysis by Type , 2025 and 2035
  • Figure 54: Eastern Europe Market Y-o-Y Growth Comparison by Type , 2025 to 2035
  • Figure 55: Eastern Europe Market Attractiveness Analysis by Type
  • Figure 56: Eastern Europe Market Value Share and BPS Analysis by Application, 2025 and 2035
  • Figure 57: Eastern Europe Market Y-o-Y Growth Comparison by Application, 2025 to 2035
  • Figure 58: Eastern Europe Market Attractiveness Analysis by Application
  • Figure 59: Eastern Europe Market Value Share and BPS Analysis by End Use Industry, 2025 and 2035
  • Figure 60: Eastern Europe Market Y-o-Y Growth Comparison by End Use Industry, 2025 to 2035
  • Figure 61: Eastern Europe Market Attractiveness Analysis by End Use Industry
  • Figure 62: East Asia Market Value Share and BPS Analysis by Country, 2025 and 2035
  • Figure 63: East Asia Market Value Share and BPS Analysis by Type , 2025 and 2035
  • Figure 64: East Asia Market Y-o-Y Growth Comparison by Type , 2025 to 2035
  • Figure 65: East Asia Market Attractiveness Analysis by Type
  • Figure 66: East Asia Market Value Share and BPS Analysis by Application, 2025 and 2035
  • Figure 67: East Asia Market Y-o-Y Growth Comparison by Application, 2025 to 2035
  • Figure 68: East Asia Market Attractiveness Analysis by Application
  • Figure 69: East Asia Market Value Share and BPS Analysis by End Use Industry, 2025 and 2035
  • Figure 70: East Asia Market Y-o-Y Growth Comparison by End Use Industry, 2025 to 2035
  • Figure 71: East Asia Market Attractiveness Analysis by End Use Industry
  • Figure 72: South Asia and Pacific Market Value Share and BPS Analysis by Country, 2025 and 2035
  • Figure 73: South Asia and Pacific Market Value Share and BPS Analysis by Type , 2025 and 2035
  • Figure 74: South Asia and Pacific Market Y-o-Y Growth Comparison by Type , 2025 to 2035
  • Figure 75: South Asia and Pacific Market Attractiveness Analysis by Type
  • Figure 76: South Asia and Pacific Market Value Share and BPS Analysis by Application, 2025 and 2035
  • Figure 77: South Asia and Pacific Market Y-o-Y Growth Comparison by Application, 2025 to 2035
  • Figure 78: South Asia and Pacific Market Attractiveness Analysis by Application
  • Figure 79: South Asia and Pacific Market Value Share and BPS Analysis by End Use Industry, 2025 and 2035
  • Figure 80: South Asia and Pacific Market Y-o-Y Growth Comparison by End Use Industry, 2025 to 2035
  • Figure 81: South Asia and Pacific Market Attractiveness Analysis by End Use Industry
  • Figure 82: Middle East & Africa Market Value Share and BPS Analysis by Country, 2025 and 2035
  • Figure 83: Middle East & Africa Market Value Share and BPS Analysis by Type , 2025 and 2035
  • Figure 84: Middle East & Africa Market Y-o-Y Growth Comparison by Type , 2025 to 2035
  • Figure 85: Middle East & Africa Market Attractiveness Analysis by Type
  • Figure 86: Middle East & Africa Market Value Share and BPS Analysis by Application, 2025 and 2035
  • Figure 87: Middle East & Africa Market Y-o-Y Growth Comparison by Application, 2025 to 2035
  • Figure 88: Middle East & Africa Market Attractiveness Analysis by Application
  • Figure 89: Middle East & Africa Market Value Share and BPS Analysis by End Use Industry, 2025 and 2035
  • Figure 90: Middle East & Africa Market Y-o-Y Growth Comparison by End Use Industry, 2025 to 2035
  • Figure 91: Middle East & Africa Market Attractiveness Analysis by End Use Industry
  • Figure 92: Global Market - Tier Structure Analysis
  • Figure 93: Global Market - Company Share Analysis
Dashboard
Dashboard
Dashboard
Dashboard
Dashboard
Dashboard

Full Research Suite comprises of:

Market outlook & trends analysis

Market outlook & trends analysis

Interviews & case studies

Interviews & case studies

Strategic recommendations

Strategic recommendations

Vendor profiles & capabilities analysis

Vendor profiles & capabilities analysis

5-year forecasts

5-year forecasts

8 regions and 60+ country-level data splits

8 regions and 60+ country-level data splits

Market segment data splits

Market segment data splits

12 months of continuous data updates

12 months of continuous data updates

DELIVERED AS:

PDF EXCEL ONLINE

Full Research Suite


$5000

$7500

$10000

Buy Report Now
Future Market Insights

Bolometer Market

Chat With MaRIA

Chat With

MaRIA

Hi There, I am MaRIA, Your Market Research Intelligence Assistant. How may I help you?