
- Market Size (2026)
- USD 651.7 Mn
- Forecast (2036)
- USD 1092.3 Mn
- CAGR (2026 to 2036)
- 5.3%
How big is Curculin Market in 2026?
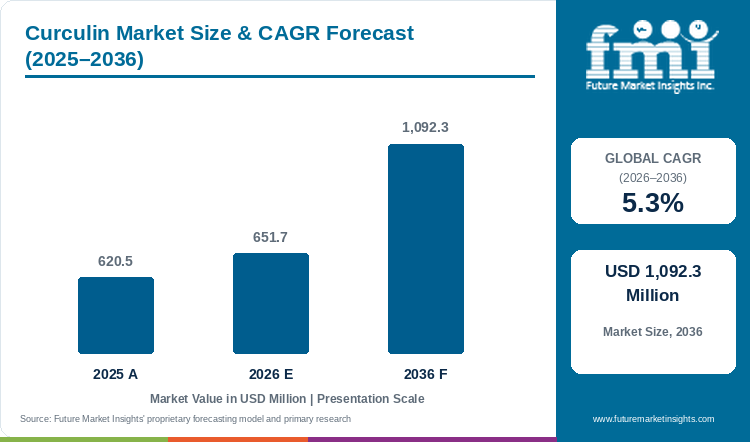
With a valuation of USD 620.5 million in 2025 and moving to USD 651.7 million in 2026, the curculin market is positioned to attain USD 1,092.3 million by 2036, exhibiting a CAGR of 5.3%.
The global curculin market was valued at USD 620.5 million in 2025 and is estimated to reach USD 651.7 million in 2026. The market is projected to reach USD 1,092.3 million by 2036, expanding at a compound annual growth rate (CAGR) of 5.3% between 2026 and 2036. Curculigo capitulata and C. latifolia Fruit Neoculin Extraction holds an estimated 67.3% share of 2026 demand, given that purified heterodimeric fruit extracts deliver both intrinsic sweetness at 550 times sucrose and sour-to-sweet conversion in citric-acid drinks. Recipe-reformulation research by FMI points out that beverage formulators are adopting curculin and neoculin to solve the sour-acid and metallic linger bottleneck in reduced-sugar drinks, supported by March 2025 ACS food chemistry research demonstrating engineered thermal and pH stability in neoculin for commercial food processing.
That specialized acid-triggered mechanism separates the category from broader natural high-intensity sweeteners at 9.1% CAGR, where bulk stevia and monk fruit replace sucrose across neutral pH foods while curculin sales track precision taste-modification in acidic matrices after the U.S. FDA issued GRAS response letter GRN 1293 for recombinant sweet protein production in June 2026. Ingredient houses are pairing sweet proteins with stevia and cane-sugar blends, evidenced when Cargill launched its Craftiva reduced-sugar syrup and sweetener line in October 2026 after consumer tracking showed 25% of younger buyers favor balanced reduced-sugar profiles. Beverage and dairy brands lock in curculin supply agreements once lyophilized powders preserve sour-to-sweet conversion across pasteurization.
Key Market Trends & Insights
- By extraction source: Curculigo capitulata Fruit Neoculin Extraction holds an estimated 67.3% share in 2026 since botanical fruit preparations support clean-label natural flavor positioning.
- By formulation format: Lyophilized Purified Protein Powder represents 71.1% in 2026 as freeze-drying preserves the disulfide-linked NAS-NBS heterodimer structure.
- By functional role: Acid-Triggered Sweetening Agent accounts for 58.1% in 2026 owing to histidine-protonated sweet receptor activation in sour matrices.
- By application category: Acidic Functional Beverages and Sour Dairy secures 46.4% in 2026 driven by sugar reduction in citric-acid drinks, kombucha, and drinkable yogurts.
- By distribution channel: Direct B2B Flavor and Beverage Contracts command 62.8% in 2026 through receptor-level sensory calibration and co-formulated sweetener systems.
Regional Highlights
- Top national expansion: China leads national growth projections at a 6.1% CAGR through 2036 under zero-sugar ready-to-drink tea and fruit-vinegar beverage expansion.
- Broader country progression: South Korea tracks at a 5.8% CAGR ahead of Germany at 5.5% and the United States at 5.4%, while Japan advances at a 4.6% CAGR.
Market Size & Forecast
Table 1: Market Size and Forecast for the Curculin Market (USD million and CAGR percentage), 2025 to 2036
| Metric | Value |
|---|---|
| 2025 Market Size | USD 620.5 million |
| Estimated Market Size in 2026 | USD 651.7 million |
| Projected Market Size by 2036 | USD 1,092.3 million |
| CAGR, 2026 to 2036 | 5.3% |
| Added Revenue, 2026 to 2036 | USD 440.6 million |
Carbonated soft drink, sour gummy, and fermented dairy processors cutting added sucrose confront sharp citric and lactic acid sourness as well as the bitter metallic linger of rebaudioside A. In contrast to static next-generation sweeteners that merely add flat sweetness on top of sourness, the heterodimeric neoculin complex from Curculigo species binds to the human T1R2-T1R3 sweet receptor and shifts from a neutral antagonist into a potent agonist whenever oral pH drops. In October 2026, biotechnology researchers publishing in JAFC Au examined curculin and neoculin's unique pH-dependent sweetness enhancement niche and precision recombinant production advances. Formulators consequently dose 5 to 30 milligrams per kilogram of curculin/neoculin to convert sharp organic acids into a rounded, orange-like sweet taste.
Treated-Matrix and Active-Protein Sizing
Table 2: Treated-Matrix and Active-Protein Sizing for the Curculin Market (USD million and operational ranges), 2025 to 2036
| Metric | 2025 | 2026 | 2036 |
|---|---|---|---|
| Market size (USD million) | 620.5 | 651.7 | 1,092.3 |
| Treated reduced-sugar acidic beverage & dairy volume (million MT) | 14.2 to 16.5 | 15.0 to 17.4 | 24.8 to 28.6 |
| Commercial curculin & neoculin active shipment volume (metric tons) | 310.0 to 355.0 | 326.0 to 372.0 | 545.0 to 620.0 |
| Active protein sweetening cost per metric ton of finished product (USD) | 37.5 to 43.8 | 37.4 to 43.5 | 38.2 to 44.0 |
As per Table 2 volume-to-value estimates derived from specialty sweetener processors, global commercial shipments of active curculin and neoculin preparations expand from 326.0 to 372.0 metric tons in 2026 to 545.0 to 620.0 metric tons by 2036. High sweetening potency of 550 to 1,000 times sucrose keeps active protein cost per metric ton of finished beverage between USD 37.4 and 43.5 in 2026, enabling cost-effective co-formulation with stevia or allulose.
Biophysical Stability & Receptor Kinetics Indicators
Table 3: Biophysical Potency and Fermentation Share Indicators for the Curculin Market (multiples and percentages), 2025 to 2036
| Metric | 2025 | 2026 | 2036 |
|---|---|---|---|
| Sweetness potency vs sucrose by weight (multiple) | 550x to 1,000x | 550x to 1,000x | 550x to 1,000x |
| Native curculin thermal denaturation threshold (degrees C) | 50.0 | 50.0 | 50.0 |
| Disulfide-engineered neoculin thermal tolerance (degrees C) | 75.0 | 75.0 | 85.0 |
| Precision microbial fermentation supply share (%) | 30.5% to 32.0% | 32.7% | 48.0% to 53.0% |
Table 4: Receptor Kinetics & Functional Role Spending Indicators for the Curculin Market (USD and sensory benchmarks), 2026
| Metric | Value | Institutional Reference Basis |
|---|---|---|
| Market size, 2026 | USD 651.7 million | 2026 global valuation baseline |
| Active taste-modifying inclusion range | 2 to 50 mg/kg | Acid-induced sweetness and bitterness-masking dosing |
| Oral sour-to-sweet persistence window | 5 to 10 minutes | pH-triggered hT1R2-hT1R3 receptor agonism duration |
| Acid-Triggered Sweetening Agent revenue, 2026 | USD 378.6 million | 58.1% functional role revenue allocation |
As per the World Health Organization guideline on non-sugar sweeteners and Table 3 and Table 4 biophysical benchmarks, protein-based sweetening and taste-modifying agents are digested as amino acids rather than small-molecule artificial sweeteners. Since native plant-extracted curculin begins losing tertiary fold stability above 50 degrees Celsius, commercial R&D centers pair trehalose-lyophilized powders with disulfide-stabilized recombinant variants that withstand 75 to 85 degrees Celsius flash pasteurization.
Analyst Perspective
"Beverage formulators do not buy curculin to replace bulk sugar gram-for-gram; they buy its histidine pH-switch to turn sour citric and lactic acid notes into clean, lingering fruit sweetness without artificial chemical aftertaste. Suppliers that scale Komagataella and Aspergillus recombinant expression of heat-stabilized neoculin will capture mainstream UHT beverage and yogurt contracts through 2036."
- Nandini Roy Choudhury, Principal Consultant, Future Market Insights.
How is the Curculin Market segmented?
The curculin market is segmented by extraction source, formulation format, functional role, application category, and distribution channel.
By extraction source: Curculigo capitulata and C. latifolia Fruit Neoculin Extraction, Recombinant Microbial Protein Expression, Plant Tissue Culture Regeneration and Cell-Free Synthesis.
By formulation format: Lyophilized Purified Protein Powder, Aqueous Liquid Extract, Co-Spray-Dried Maltodextrin and Trehalose Blends and Microencapsulated Acid-Release Granules.
By functional role: Acid-Triggered Sweetening Agent, Sugar-Free Flavor Enhancer and Bitterness Masker, Specialty Food Science Research and Pharmaceutical Palatability Excipient.
By application category: Acidic Functional Beverages and Sour Dairy, Sugar-Free Confectionery and Chewing Gum, Chewable Nutraceuticals and Oral Care and Culinary Sauces and Dressings.
By distribution channel: Direct B2B Flavor and Beverage Contracts, Specialty Sweetener and Ingredient Distributors, Contract Research and Biochemical Catalogues and Online B2B Ingredient Portals.
Why does Curculigo capitulata Fruit Neoculin Extraction lead the extraction source category?
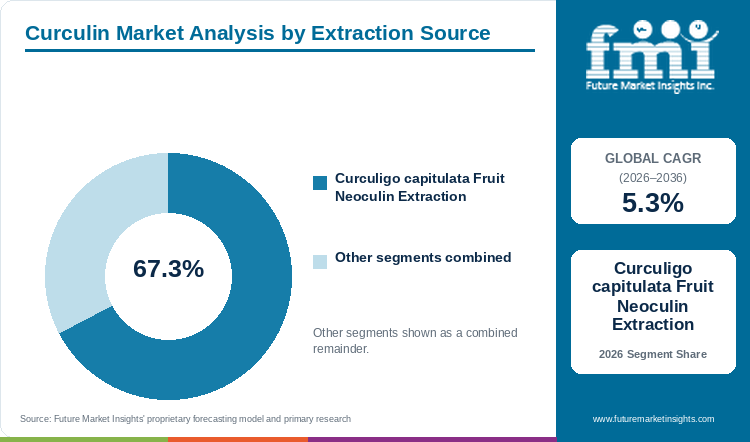
Curculigo capitulata and C. latifolia Fruit Neoculin Extraction holds an estimated 67.3% of extraction source demand in 2026, anchored by clean-label botanical fruit extract declarations.
Table 5: Extraction Source Share for the Curculin Market (percentage share), 2026
| Extraction Source | Share (2026) |
|---|---|
| Curculigo capitulata Fruit Neoculin Extraction | 67.3% |
| Other Segments Combined | 32.7%* |
| Total | 100.0% |
*Note: Remaining extraction source categories account for the balance of 2026 global curculin demand.
Table 6: Extraction Source Leadership and Market Growth for the Curculin Market (segment and CAGR percentage), 2026 to 2036
| Metric | Value |
|---|---|
| Global CAGR (2026 to 2036) | 5.3% |
| Leading Segment | Curculigo capitulata Fruit Neoculin Extraction |
Aqueous salt extraction and ultrafiltration of ripe Curculigo capitulata and Curculigo latifolia fruits cultivated across Southeast Asian agro-forestry plantations allow food and beverage brands to declare the ingredient as a botanical fruit extract rather than a genetically modified fermentation product. Comparative transcriptome research stored in the National Library of Medicine PMC repository documented 85,697 transcripts in Curculigo latifolia and 76,775 in Curculigo capitulata, mapping the specific gene duplications that govern high fruit accumulation of heterodimeric neoculin. Seasonal tropical fruit harvesting and shade-cultivation requirements nonetheless create raw-material supply ceilings similar to West African thaumatin taste modifiers.
- Within the extraction source segment, Curculigo capitulata Fruit Neoculin Extraction is projected to account for a leading 67.3% share in 2026, supported by established botanical flavoring acceptance in East Asian and clean-label markets.
- Recombinant Microbial Protein Expression is forecast to expand at the fastest pace through 2036 as yeast and fungal bioreactor titers lower unit protein production costs.
What sustains Lyophilized Purified Protein Powder leadership in the formulation format segment?
Lyophilized Purified Protein Powder represents 71.1% of the formulation format category in 2026, supported by prevention of dimeric subunit dissociation during ambient transit.
Neoculin's taste-modifying activity depends strictly on maintaining the native clamshell-like heterodimer linking its 113-amino-acid acidic subunit (NAS) and 114-amino-acid basic subunit (NBS) via two inter-chain disulfide bridges. Unstabilized aqueous extracts undergo rapid proteolytic cleavage and subunit dissociation when shipped across warm distribution lanes, whereas vacuum freeze-drying with trehalose or maltodextrin cryoprotectants locks the quaternary fold in a glassy solid state for 24 months. Dissolution of lyophilized powder in high-shear beverage tanks requires controlled low-foam mixing to avoid air-liquid interface denaturation.
- In 2026, Lyophilized Purified Protein Powder is anticipated to capture 71.1% of global formulation format demand, reflecting industrial buyer requirements for ambient shelf stability and precise milligram-level dosing.
- A comprehensive sweetener review published in Foods in September 2025 confirmed that curculin and neoculin exhibit 550x to 1,000x sucrose sweetness potency while requiring thermal protection above 50 degrees Celsius during processing.
How does Acid-Triggered Sweetening Agent lead the functional role category?
Acid-Triggered Sweetening Agent accounts for 58.1% of functional role demand in 2026, driven by sour-to-sweet conversion in citric and lactic acid matrices.
Compared with brazzein sweet proteins or steviol glycosides that deliver constant sweetness regardless of acidity, neoculin acts as a dynamic molecular switch driven by protonation of histidine residue His11 on its basic subunit. Structural receptor studies archived in PMC demonstrated that at neutral pH 7.0 neoculin binds the human hT1R2-hT1R3 receptor in an inactive conformation. Addition of citric or ascorbic acid protonates His11 and triggers an immediate conformational shift into a high-affinity sweet agonist for 5 to 10 minutes. This unique property allows beverage developers to formulate sour lemonades, kombucha, and vitamin shots that burst into sweet orange-like flavor on the palate with zero added sugar.
- By functional role, Acid-Triggered Sweetening Agent is estimated to reach 58.1% of category share in 2026 as beverage and dairy formulators exploit acid-induced sweetness conversion.
- Sugar-Free Flavor Enhancer and Bitterness Masker applications are projected to grow steadily through 2036 as sub-threshold 2 to 5 ppm dosing masks potassium chloride and high-purity stevia off-notes.
Why do Acidic Functional Beverages and Sour Dairy lead the application category?
Acidic Functional Beverages and Sour Dairy secures 46.4% of application category demand in 2026, anchored by citric-acid protonation of histidine residues that triggers intense sweetness.
Carbonated fruit waters, electrolyte sports drinks, and drinkable Greek yogurts naturally operate at pH 3.0 to 4.6. That acidity provides the exact hydrogen-ion concentration required to keep neoculin locked in its active sweet-signaling conformation. Formulators replacing sucrose in low-calorie sweeteners beverage systems find that pairing curculin with erythritol or Reb M eliminates the sour-metallic clash common in citrus and berry drinks. Neutral-pH baked goods and UHT chocolate milks remain challenging for native curculin due to lack of acid activation and high oven temperatures.
- Strong reformulation activity across ready-to-drink refreshment lines places Acidic Functional Beverages and Sour Dairy on course to hold an estimated 46.4% share of the application category in 2026.
- Fungal expression research published in Frontiers in Bioengineering and Biotechnology in 2025 verified that synthetic fungal expression systems achieve gram-per-liter sweet-protein bioreactor yields with intact disulfide folding verified by LC-HCMS and nanoDSF.
What gives Direct B2B Flavor and Beverage Contracts the leading position in distribution channel?
Direct B2B Flavor and Beverage Contracts command 62.8% of distribution channel share in 2026, supported by custom stevia-neoculin pairing calibration and pH buffering.
Formulation with a pH-dependent taste-modifying protein requires re-balancing titratable acidity and temporal sweetness curves across the entire recipe. Beverage and dairy brands therefore contract directly with global flavor houses and sweet-protein innovators rather than buying raw catalogue proteins. Technical guidance published by Sweegen in August 2026 emphasized that combining sweet-protein systems with signature stevia and flavor modulators unlocks multi-receptor taste balance that standalone sweeteners cannot replicate. Specialty biochemical distributors still serve university sensory laboratories and niche pharmaceutical excipient accounts.
- Direct B2B Flavor and Beverage Contracts are predicted to secure 62.8% of distribution channel demand in 2026, anchored by joint sensory panel optimization and co-spray-dried sweetener premixes.
- Specialty Sweetener and Ingredient Distributors are anticipated to expand through 2036 by supplying pre-standardized taste-modulator blends to regional craft beverage and confectionery makers.
What are the drivers, restraints, and opportunities in the Curculin Market?
In the curculin market, sugar-reduction reformulation across acidic drinks and demand for non-artificial taste modifiers are projected to drive adoption, while native protein heat sensitivity above 50 degrees Celsius restrains high-temperature baking and recombinant microbial expression opens scalable supply.
- Driver: Global sugar-reduction taxes and clean-label beverage reformulation drive demand for acid-triggered sweet proteins that convert sourness into sucrose-like sweetness.
- Restraint: Thermal denaturation of native curculin above 50 degrees Celsius and limited wild Curculigo fruit harvests restrain high-heat pasteurization and bulk commodity adoption.
- Opportunity: Precision fermentation in Komagataella phaffii and Aspergillus oryzae paired with disulfide-engineered thermostable neoculin variants opens mainstream UHT beverage and pharmaceutical syrups.
Growth Analysis and Future Potential: Qualitative Demand Catalysts
Sugar-sweetened beverage taxes and consumer rejection of artificial chemical sweeteners (aspartame and sucralose) are driving beverage and dairy brands toward protein-based sweetness modulation. Unlike synthetic sweeteners that leave a cloying lingering aftertaste, curculin and neoculin engage the Venus flytrap domain of the sweet receptor while simultaneously suppressing sour perception in novel sweeteners blends. In September 2025, Cargill reported that precision-fermented sweetener innovations have pushed stevia and natural-sweetener product launches past 8,700 global SKUs while cutting agricultural land and water footprints by up to 97%. Beverage brands seeking the next leap in zero-sugar citrus and berry authenticity are integrating taste-modifying sweet proteins into their 2026-to-2036 reformulation pipelines.
Risk Assessment of the Curculin Market: Operational and Formulation Friction
Thermal lability of native plant-extracted curculin above 50 degrees Celsius and incomplete regulatory toxicology dossiers in conservative jurisdictions represent the primary friction points restraining rapid mass-market adoption. When unengineered curculin solutions are subjected to standard 72-degree Celsius HTST pasteurization or hot-fill bottling, disulfide scrambling uncouples the heterodimer and extinguishes sweetening potency. Furthermore, a May 2026 systematic allergenicity review in Molecules noted that while thaumatin and brazzein have completed extensive pepsin-pancreatin digestion and in-vivo safety protocols, curculin and neoculin require broader published clinical allergenicity filings to match universal regulatory clearance. Formulators consequently restrict native curculin to cold-filled, micro-filtered, or post-pasteurization-dosed applications unless engineered variants are used.
Commercial Opportunity Analysis: Formulation Differentiation and Value-Add Formats
Flavor and biotechnology companies are creating high-margin demand avenues by combining recombinant disulfide-stabilized neoculin with citrus sugar-reduction flavor modulators and plant-protein masking systems. Site-directed histidine-to-alanine mutations or reinforced inter-subunit hydrogen bonds raise neoculin's thermal threshold above 75 degrees Celsius while enabling custom pH activation profiles for high-protein shakes, chewable pediatric vitamins, and sour gummies. On April 8, 2026, dsm-firmenich launched next-generation plant-based texturized proteins featuring integrated ModulaSENSE taste modulation technology to eliminate off-notes and optimize palatability. Formulations combining micro-dosed neoculin with sugar reduction mouthfeel recovery additives allow beverage makers to cut 50% to 100% of added sugar in fruit drinks without sacrificing juice-like body.
Curculin Market by Country (2026 to 2036)
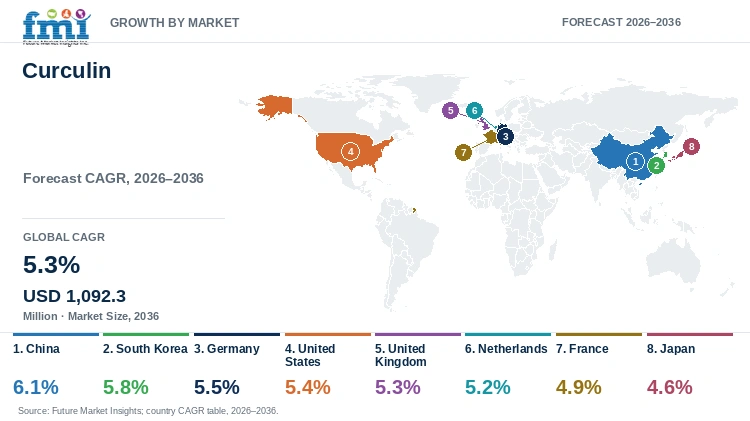
FMI country modeling indicates that China leads curculin market growth at a 6.1% CAGR through 2036, while Japan progresses at a 4.6% CAGR. National adoption reflects East Asian zero-sugar tea and fruit-vinegar beverage innovation, European clean-label sugar-tax reformulation, and North American FDA GRAS sweet-protein commercialization.
Table 7: Country CAGR and Primary Growth Levers for the Curculin Market (CAGR percentage and operational drivers), 2026 to 2036
| Country | CAGR (2026 to 2036) | Primary Growth Lever |
|---|---|---|
| China | 6.1% | Zero-sugar ready-to-drink tea, fruit vinegar, and biomanufacturing scale-up |
| South Korea | 5.8% | Zero-sugar carbonated beverage boom and functional sour vitamin drinks |
| Germany | 5.5% | Clean-label sour dairy, fruit spritzer (Schorle), and flavor-house R&D |
| United States | 5.4% | FDA GRAS sweet-protein momentum and stevia-modifier beverage systems |
| United Kingdom | 5.3% | Soft Drinks Industry Levy reformulation and reduced-sugar yogurt drinks |
| Netherlands | 5.2% | Fermentation bioprocessing hubs and pan-European beverage premix exports |
| France | 4.9% | Nutri-Score beverage sugar cuts and gourmet fruit-prep taste modulation |
| Japan | 4.6% | Pioneering neoculin structural engineering and specialty dietary foods |
Source: Future Market Insights analysis
China Curculin Market Outlook (2026 to 2036)
Demand for curculin and neoculin in China is projected to expand at a leading 6.1% CAGR between 2026 and 2036 across zero-sugar sparkling fruit teas, fermented hawthorn and plum drinks, and domestic synthetic-biology fermentation parks. What sets China apart from Western markets is its indigenous medicinal and botanical familiarity with Curculigo species paired with massive state-backed investment in precision fermentation of sweet proteins and monk fruit sugar glycosides. Shenyang GAIN sector reports in April 2026 noted that China's food and beverage processing industry continues rapid upgrading toward zero-sugar and functional beverage formats across domestic retail chains. Chinese beverage formulators actively pair botanical neoculin extracts with erythritol and mogroside V to eliminate sour astringency in ready-to-drink oolong and citrus teas.
Key takeaway: In China, booming zero-sugar fruit-tea bottling and domestic microbial fermentation scale-up are projected to drive a leading 6.1% CAGR through 2036.
South Korea Curculin Market Outlook (2026 to 2036)
South Korea's curculin market is anticipated to advance at a 5.8% CAGR from 2026 to 2036, driven by the country's nationwide Zero-Sugar beverage wave spanning carbonated sodas and drinking vinegars (Hongcho). Compared with Western markets where stevia dominates standalone usage, Korean beverage R&D teams aggressively combine fermentation-derived rare sweeteners like allulose with taste-modifying proteins to replicate crisp sucrose mouthfeel in sour fruit drinks. Seoul GAIN market filings in May 2026 documented South Korea's advanced food processing sector and high per-capita adoption of functional, zero-sugar convenience-store beverages. Strict Ministry of Food and Drug Safety (MFDS) natural-flavoring standards encourage Korean formulators to use purified Curculigo fruit extracts in premium vitamin C and collagen beauty drinks.
Key takeaway: In South Korea, convenience-store zero-sugar soda and drinking-vinegar reformulation is anticipated to sustain a 5.8% CAGR through 2036.
Germany Curculin Market Outlook (2026 to 2036)
In Germany, curculin procurement is forecast to grow with a 5.5% CAGR during the 2026 to 2036 period across fruit-juice spritzers (Apfelschorle and Fruchtschorle) and Holzminden flavor-house compounding centers. Germany diverges from North American sweetener markets since German retail chains enforce strict clean-label bans on artificial sweeteners while the national Sugar Reduction Strategy pushes dairy and beverage brands to cut calories without adding E-number sweeteners. Berlin GAIN attaché analysis published in March 2026 confirmed that Germany operates Europe's fourth-largest food processing industry and leads continental functional ingredient compounding. German flavor houses incorporate sub-threshold botanical neoculin into natural flavoring preparations to soften lactic-acid tartness in reduced-sugar yogurts.
Key takeaway: In Germany, clean-label Fruchtschorle and sour-dairy sugar reduction supported by domestic flavor-house R&D are forecast to sustain a 5.5% CAGR.
United States Curculin Market Outlook (2026 to 2036)
Commercial curculin demand in the United States is estimated to advance with a 5.4% CAGR across the 2026 to 2036 decade across prebiotic functional sodas, hydration electrolyte stick packs, and chewable gummy supplements. What distinguishes the United States from European markets is the rapid FDA GRAS clearance pathway for precision-fermented and plant-expressed sweet proteins, which allows beverage brands to test and commercialize sweet-protein modifier systems without multi-year novel-food delays. In October 2026, the U.S. Food and Drug Administration published its GRAS Notice No. 1286 closure letter confirming no questions regarding plant-expressed sweet protein for general-purpose food sweetening. American functional beverage startups combine 5 to 15 ppm taste-modifying proteins with Reb M stevia to mask citric-acid bite and apple-cider-vinegar sharpness.
Key takeaway: In the United States, rapid FDA GRAS sweet-protein clearances and functional prebiotic soda launches are estimated to drive a 5.4% CAGR.
United Kingdom Curculin Market Outlook (2026 to 2036)
The United Kingdom curculin market is projected to register a 5.3% CAGR through 2036, anchored by the Soft Drinks Industry Levy (SDIL) and High Fat, Salt and Sugar (HFSS) retail placement restrictions that penalize beverages exceeding 5 grams of sugar per 100 milliliters. In contrast to markets without fiscal sugar taxes, British soft-drink and cordial bottlers have permanently reformulated their core portfolios around high-intensity sweeteners and natural taste modulators. London GAIN agricultural briefings in March 2026 noted the United Kingdom's highly consolidated retail grocery sector and sustained demand for health-oriented, sugar-reduced food processing ingredients. British beverage developers replace acesulfame-K in fruit cordials by blending natural sweet-protein and citrus-modulator ingredients.
Key takeaway: In the United Kingdom, Soft Drinks Industry Levy (SDIL) thresholds and HFSS retail rules are projected to sustain a 5.3% CAGR for curculin taste modulators.
Netherlands Curculin Market Outlook (2026 to 2036)
Demand for curculin in the Netherlands is slated to expand at a 5.2% CAGR across the 2026 to 2036 window in Dutch fermentation bioprocessing campuses, pan-European beverage concentrate plants, and reduced-sugar dairy drink lines. The Netherlands differs from purely consumer-driven markets through its dense cluster of industrial biotechnology fermenters and multinational food R&D centers that engineer recombinant yeast and fungal expression hosts for rare sweet proteins. Trade records from The Hague in April 2026 confirmed that the Netherlands acts as the European Union's primary agri-food trade and ingredient processing hub. Dutch dairy and beverage formulators use lyophilized neoculin-trehalose blends to stabilize sweetness profiles in export-oriented fruit-yogurt drinks.
Key takeaway: In the Netherlands, industrial biotechnology fermentation clusters and export dairy-beverage compounding are slated to drive a 5.2% CAGR.
France Curculin Market Outlook (2026 to 2036)
In France, curculin sales are predicted to increase at a 4.9% CAGR from 2026 through 2036 in fruit compotes and Nutri-Score-optimized chilled dairy desserts. Compared with markets that tolerate heavy stevia Reb A bitterness, French culinary and sensory standards demand authentic sucrose-like temporal onset and zero metallic linger in fruit preparations. As per the April 2026 Paris GAIN attaché report on France, domestic food and beverage manufacturers continue investing in clean-label recipe reformulation to improve front-of-pack Nutri-Score ratings after the stricter 2025-2026 algorithm updates. French fruit-prep and dairy formulators consequently dose botanical neoculin extracts at flavor-modifying ppm levels to amplify natural strawberry and raspberry sweetness.
Key takeaway: In France, stricter Nutri-Score beverage algorithms and gourmet fruit-compote reformulation are predicted to support a 4.9% CAGR through 2036.
Japan Curculin Market Outlook (2026 to 2036)
Japanese curculin demand is forecast to progress at a 4.6% CAGR over the 2026 to 2036 timeline in university and corporate protein-engineering laboratories, kurozu black-vinegar wellness drinks, and diabetic medical-nutrition jellies. What sets Japan apart globally is that Japanese food scientists originally isolated curculin and neoculin and pioneered Aspergillus oryzae recombinant expression systems under Ministry of Health, Labour and Welfare Existing Food Additive recognition for botanical extracts. Tokyo GAIN food-processing analysis in April 2026 reported that while overall Japanese food output contracted by 3% in 2025, manufacturers maintain strong R&D focus on functional, low-glycemic beverages for its aging population. Japanese beverage makers use purified neoculin to turn sour citrus and vinegar tonics into palatable daily health drinks.
Key takeaway: In Japan, pioneering Aspergillus oryzae neoculin engineering and low-glycemic vinegar wellness drinks are forecast to maintain a 4.6% CAGR.
Full report country CAGRs cover: North America; Latin America; Western Europe; Eastern Europe; East Asia; South Asia and Pacific; Middle East and Africa.
Who are the notable companies in the Curculin Market?
dsm-firmenich, Archer Daniels Midland Company, Cargill Incorporated, International Flavors & Fragrances Inc., Kerry Group plc, Givaudan SA, Symrise AG, Tate & Lyle PLC, Ingredion Incorporated, and Sweegen Inc. are the notable companies in the curculin market.
Competitive structure in the curculin and taste-modifying sweet protein industry brings together global precision-fermentation and sweetener leaders, receptor-guided flavor and taste-modulation houses, and dedicated sweet-protein biotechnology innovators. Bioscience and sweetener leaders dsm-firmenich and Archer Daniels Midland Company compete with Cargill Incorporated, Tate & Lyle PLC, and Ingredion Incorporated in industrial fermentation and clean-taste blending platforms. Global flavor houses International Flavors & Fragrances Inc. and Kerry Group plc compete with Givaudan SA and Symrise AG by engineering sweet-receptor modulation systems, while Sweegen Inc. leads commercial sweet-protein GRAS regulatory filings.
- Precision Fermentation and Integrated Sweetener Leaders: dsm-firmenich and Archer Daniels Midland Company as well as Cargill Incorporated, Tate & Lyle PLC, and Ingredion Incorporated combine biomanufacturing scale with reduced-sugar sweetener systems.
- Receptor-Guided Flavor and Taste-Modulation Houses: International Flavors & Fragrances Inc. and Kerry Group plc as well as Givaudan SA and Symrise AG formulate pH-triggered sweetness enhancers and bitterness maskers for acidic beverages.
- Dedicated Sweet-Protein Biotechnology Innovators: Sweegen Inc. commercializes FDA GRAS-cleared recombinant sweet-protein platforms and Sweetensify taste-modulation systems.
Competitive Benchmarking: Curculin Market
Table 8: Competitive Benchmarking for the Curculin Market (qualitative capability ratings), 2026
| Company | Sweet-Protein & Bioconversion Tech | Receptor Taste Modulation | Acidic Matrix Stability | Geographic Reach |
|---|---|---|---|---|
| dsm-firmenich | High | High | High | Global ModulaSENSE taste modulation and precision fermentation network |
| Archer Daniels Midland Company | High | High | High | Global SweetRight and taste-modification R&D across N. America, EU, APAC |
| Cargill Incorporated | High | High | High | Global EverSweet fermentation, Sweetmix, and Craftiva sugar-reduction network |
| International Flavors & Fragrances Inc. | High | High | High | Global sweet taste modulation and bioprocessing enzyme platforms |
| Kerry Group plc | Medium | High | High | Global Tastesense sugar-reduction and acidic beverage application centers |
| Givaudan SA | High | High | High | Global Taste & Wellbeing sweet-receptor discovery and botanical masking hubs |
| Symrise AG | Medium | High | High | Global Symvision AI taste design and natural sweetness modulation network |
| Tate & Lyle PLC | High | High | High | Global Sweetener Alliance with Manus bioalternatives and mouthfeel systems |
| Ingredion Incorporated | Medium | High | High | Global PureCircle Clean Taste Solutions, sweet proteins, and flavor modifiers |
| Sweegen Inc. | High | High | High | Global Ultratia sweet protein systems and Sweetensify taste modulation |
Evaluation basis: Sweet-Protein and Bioconversion Tech evaluates recombinant yeast or fungal expression and botanical purification capabilities, while Receptor Taste Modulation rates heterodimeric receptor screening and off-note masking. Acidic Matrix Stability measures documented thermal and pH stabilization of taste-modifying proteins in carbonated, citrus, and fermented dairy formulations.
Key Developments in the Curculin Market
- Symrise AG deployed its Symvision AI Taste Design platform at Gulfood Manufacturing on October 20, 2026 to help beverage and food developers model sweet-spot receptor balance and accelerate sugar-reduction reformulation.
- Cargill Incorporated showcased its Sweetmix and stevia-based reduced-sugar beverage and dairy formulation systems at Fi Asia on September 17, 2026 to restore mouthfeel and flavor balance in low-sugar Asian drinks.
- Tate & Lyle PLC and bioalternatives scale-up platform Manus announced the launch of the Yume sweetness brand under The Sweetener Alliance on February 23, 2026 to expand commercial access to nature-derived and bioconverted sweeteners.
Key Players in the Curculin Market
Precision Fermentation and Integrated Sweetener Leaders
- dsm-firmenich
- Archer Daniels Midland Company
- Cargill Incorporated
- Tate & Lyle PLC
Ingredion Incorporated
- Receptor-Guided Flavor and Taste-Modulation Houses
- International Flavors & Fragrances Inc.
- Kerry Group plc
- Givaudan SA
Symrise AG
- Dedicated Sweet-Protein Biotechnology Innovators
- Sweegen Inc.
Curculin Market - Report Scope
Table 9: Report Scope for the Curculin Market (coverage fields and definitions), 2026 to 2036
| Coverage field | Report scope |
|---|---|
| Market breakdown | Extraction Source; Formulation Format; Functional Role; Application Category; Distribution Channel |
| Quantitative Units | USD Million |
| Market Definition | Covers commercial B2B sales of curculin (homodimeric 114-amino-acid taste-modifying protein) and neoculin (heterodimeric NAS-NBS sweet and taste-modifying protein complex) extracted from Curculigo capitulata and Curculigo latifolia fruits or expressed via recombinant microbial hosts for food, beverage, and pharmaceutical sweetening and flavor modification. Category Scope Note: Excludes bulk polyols, synthetic high-intensity sweeteners (sucralose, aspartame), and standalone steviol glycosides. |
| Regions Covered | North America; Latin America; Western Europe; Eastern Europe; East Asia; South Asia and Pacific; Middle East and Africa |
| Countries Covered | China, South Korea, Germany, United States, United Kingdom, Netherlands, France, Japan, and additional countries in the full report |
| Key Companies Covered | dsm-firmenich, Archer Daniels Midland Company, Cargill Incorporated, International Flavors & Fragrances Inc., Kerry Group plc, Givaudan SA, Symrise AG, Tate & Lyle PLC, Ingredion Incorporated, Sweegen Inc. |
| Forecast Period | 2026 to 2036 |
| Approach | Primary and secondary research with top-down and bottom-up ppm-dosage triangulation. |
Curculin Market - Research Methodology
Table 10: Research Methodology for the Curculin Market (research methods and approach), 2026 edition
| Method | Approach |
|---|---|
| Primary Research | Structured interviews with sweet-protein fermentation scientists, hT1R2-hT1R3 receptor sensory panelists, beverage R&D directors, and Southeast Asian botanical extractors to validate ppm inclusion and ASP levels. |
| Secondary Research | Analysis of U.S. FDA GRAS sweet-protein notices, WHO non-sugar sweetener guidelines, ACS JAFC neoculin stability studies, and USDA FAS GAIN reports. |
| Market Sizing and Forecasting | Top-down specialty sweetener and taste-modulator baselines reconciled against bottom-up shipment tonnage of lyophilized curculin/neoculin powders and aqueous extracts from 2026 to 2036. |
| Country Forecasting Model | Econometric country projections weight sugar-sweetened beverage taxes, front-of-pack nutrition labeling, and precision-fermentation biomanufacturing capacity across eight national markets. |
| Operational Benchmark Traceability | Potency and thermal-stability indicators in Tables 2, 3, and 4 trace to ACS JAFC disulfide-engineered neoculin assays, MDPI Foods thermal thresholds, and FDA GRAS sweet-protein filings. |
| Data Triangulation and Validation | Revenue figures isolate curculin and neoculin preparations and blended modifier systems while excluding bulk sucrose replacers and synthetic non-nutritive sweeteners. |
Curculin Market by Segments
Curculin Market segmented by Extraction Source:
- Curculigo capitulata Fruit Neoculin Extraction
- Recombinant Microbial Protein Expression
- Plant Tissue Culture Regeneration
- Cell-Free Enzymatic Synthesis
Curculin Market segmented by Formulation Format:
- Lyophilized Purified Protein Powder
- Aqueous Liquid Extract
- Co-Spray-Dried Maltodextrin and Trehalose Blends
- Microencapsulated Acid-Release Granules
Curculin Market segmented by Functional Role:
- Acid-Triggered Sweetening Agent
- Sugar-Free Flavor Enhancer
- Specialty Food Science Research
- Pharmaceutical Palatability Excipient
- Bitterness and Off-Note Masker
Curculin Market segmented by Application Category:
- Acidic Functional Beverages and Sour Dairy
- Sugar-Free Confectionery and Chewing Gum
- Chewable Nutraceuticals and Oral Care
- Culinary Sauces and Dressings
Curculin Market segmented by Distribution Channel:
- Direct B2B Flavor and Beverage Contracts
- Specialty Sweetener and Ingredient Distributors
- Contract Research and Biochemical Catalogues
- Online B2B Ingredient Portals
Curculin Market by Region
- North America
- United States
- Canada
- Latin America
- Brazil
- Mexico
- Argentina
- Chile
- Western Europe
- Germany
- France
- United Kingdom
- Italy
- Spain
- Benelux
- Nordics
- Eastern Europe
- Poland
- Czech Republic
- Romania
- Hungary
- East Asia
- China
- Japan
- South Korea
- South Asia and Pacific
- India
- ASEAN
- Australia and New Zealand
- Middle East and Africa
- GCC Countries
- South Africa
- Türkiye
- Israel
Research Sources and Bibliography
- [1] Takahashi, K., & Masuda, T. (2025, March 8). Enhancing the Stability of Sweet Protein Neoculin for Food Applications. Journal of Agricultural and Food Chemistry (ACS Publications).
- [2] U.S. Food and Drug Administration. (2026, June 23). GRAS Notice GRN 001293 Agency Response Letter for Recombinant Sweet Protein Preparation. FDA Human Foods Program Office of Food Additive Safety.
- [3] Cargill Incorporated. (2026, October 28). Cargill Introduces Craftiva Reduced-Sugar Syrups and Sweeteners Backed by 2026 Future of Sweeteners Research. Cargill Corporate Newsroom.
- [4] Luo, Y., & Wang, Z. (2026, October 21). Harnessing Biotechnology for the Development of Sweet Proteins and Curculin-Neoculin Functional Niches. JAFC Au (ACS Publications).
- [5] World Health Organization. (2025, May 15). Use of Non-Sugar Sweeteners: WHO Guideline and Exclusion of Protein-Based Sweetening Agents. World Health Organization Department of Nutrition and Food Safety.
- [6] Tanaka, H., & Ito, K. (2025, May 18). De Novo Transcriptome Analysis and Comparative Expression Profiling of Neoculin Genes in Curculigo latifolia and Curculigo capitulata. BMC Genomics (PMC8120819).
- [7] Petrov, A., & Ivanova, E. (2025, September 12). Beyond Sugar: A Review of Sweeteners and Curculin-Neoculin Thermal and pH Behavior in Food Matrices. Foods, 14(18), 3182 (MDPI).
- [8] Nakajima, K., & Asakura, T. (2025, August 11). Identification of Key Neoculin Histidine Residues Responsible for pH-Dependent Sweet Taste Receptor Binding. Scientific Reports / PMC4542694.
- [9] Kallio, J., & Nieminen, M. (2025, November 14). Label-Free Analytical Characterization of Sweet Proteins Produced with Filamentous Fungal Expression Systems. Frontiers in Bioengineering and Biotechnology, 13, 1688495.
- [10] Sweegen Inc. (2026, August 7). Sweet Protein Technology Explained: Combining Ultratia Sweet Protein Systems with Signature Stevia. Sweegen Technical Insights.
- [11] Cargill Incorporated. (2025, September 26). Meeting Consumer Demand for Sweetness and Health with Precision-Fermented Sweetener Systems. Cargill Corporate Newsroom.
- [12] Kim, S., & Park, J. (2026, May 4). Allergenicity Assessment and In Vitro Digestibility of Plant-Derived Sweet Proteins Including Curculin and Neoculin. Molecules, 31(9), 1424 (MDPI).
- [13] dsm-firmenich. (2026, April 8). dsm-firmenich Advances Plant-Based Performance with Integrated ModulaSENSE Taste Modulation Technology. dsm-firmenich Taste, Texture & Health Press Releases.
- [14] USDA Foreign Agricultural Service. (2026, April 1). China: Food Processing Ingredients Annual. U.S. Department of Agriculture GAIN Report CH2026-0042.
- [15] USDA Foreign Agricultural Service. (2026, May 27). South Korea: Food Processing Ingredients Annual. U.S. Department of Agriculture GAIN Report KS2026-0011.
- [16] USDA Foreign Agricultural Service. (2026, March 30). Germany: Food Processing Ingredients Annual. U.S. Department of Agriculture GAIN Report GM2026-0007.
- [17] U.S. Food and Drug Administration. (2026, October 21). GRAS Notice No. 1286 Closure for Plant-Expressed Sweet Protein Preparation. FDA Human Foods Program GRAS Inventory.
- [18] USDA Foreign Agricultural Service. (2026, March 24). United Kingdom: Food Processing Ingredients Annual. U.S. Department of Agriculture GAIN Report UK2026-0008.
- [19] USDA Foreign Agricultural Service. (2026, April 2). Netherlands: Food Processing Ingredients Annual. U.S. Department of Agriculture GAIN Report NL2026-0006.
- [20] USDA Foreign Agricultural Service. (2026, April 3). France: Food Processing Ingredients Annual. U.S. Department of Agriculture GAIN Report FR2026-0003.
- [21] USDA Foreign Agricultural Service. (2026, April 1). Japan: Food Processing Ingredients Annual. U.S. Department of Agriculture GAIN Report JA2026-0012.
- [22] Symrise AG. (2026, October 20). Symrise Accelerates Taste Advantage and Symvision AI Sweet Spot Design at Gulfood Manufacturing 2026. Symrise AG Corporate Newsroom.
- [23] Cargill Incorporated. (2026, September 17). Cargill Presents Sweetmix and Reduced-Sugar Beverage and Dairy Solutions at Fi Asia 2026. Cargill Corporate Newsroom.
- [24] Tate & Lyle PLC. (2026, February 23). Tate & Lyle and Manus Announce the Launch of Yume Under The Sweetener Alliance. Tate & Lyle PLC Press Releases.
This bibliography is provided for reader reference and is not exhaustive. The full report contains the complete reference list and detailed citations.
This Report Answers
- How large is the curculin market in 2026 and what is forecast for 2036?
- How does histidine-protonated sour-to-sweet conversion drive curculin and neoculin demand?
- Why does Curculigo capitulata Fruit Neoculin Extraction lead the extraction source category?
- Why does Lyophilized Purified Protein Powder lead the formulation format category?
- How do growth rates compare across China and South Korea versus Germany and the United States?
- Which leading companies supply precision-fermented sweet proteins versus receptor flavor modulators?
- What thermal denaturation hurdles above 50 degrees Celsius limit native curculin processing?
- How do disulfide-engineered neoculin variants and FDA GRAS sweet-protein filings expand beverage adoption?
Table of Content
- Key Takeaways
- Market Size and CAGR
- Top Growth Driver
- Fastest Growing Segment
- Leading Region
- Key Companies
- Emerging Opportunities
- Executive Summary
- Global Market Outlook
- Demand-side Trends
- Supply-side Trends
- Technology Roadmap Analysis
- Analysis and Recommendations
- Analyst Perspective (What is happening? Why now? What should investors know?)
- Key Questions Answered
- How large is the market?
- What is the CAGR?
- What are key trends?
- Which region dominates?
- Who are the leaders?
Read More...
- Market Overview
- Market Coverage / Taxonomy
- Market Definition / Scope / Limitations
- Research Methodology
- Chapter Orientation
- Analytical Lens and Working Hypotheses
- Market Structure, Signals, and Trend Drivers
- Benchmarking and Cross-market Comparability
- Market Sizing, Forecasting, and Opportunity Mapping
- Research Design and Evidence Framework
- Desk Research Programme (Secondary Evidence)
- Expert Input and Fieldwork (Primary Evidence)
- Tooling, Models, and Reference Databases
- Data Engineering and Model Build
- Quality Assurance and Audit Trail
- Market Background
- Market Dynamics (Drivers, Restraints, Opportunity, Trends)
- Scenario Forecast (Optimistic, Likely, Conservative)
- Impact Analysis
- AI Impact
- Sustainability Impact
- Regulatory Impact
- Technology Impact
- Consumer / Buyer Analysis
- Purchase Drivers
- Adoption Barriers
- Buyer Journey
- Opportunity Map Analysis
- Product Life Cycle Analysis
- Supply Chain Analysis
- Investment Feasibility Matrix
- Value Chain Analysis
- PESTLE and Porter's Analysis
- Regulatory Landscape
- Regional Parent Market Outlook
- Production and Consumption Statistics
- Import and Export Statistics
- Global Market Analysis and Forecast, 2021 to 2036
- Historical Market Size Value (USD Million) Analysis, 2021 to 2025
- Current and Future Market Size Value (USD Million) Projections, 2026 to 2036
- Y-o-Y Growth Trend Analysis
- Absolute $ Opportunity Analysis
- Global Market Pricing Analysis, 2021 to 2036
- Global Market Analysis and Forecast, By Extraction Source, 2021 to 2036
- Introduction / Key Findings
- Historical Market Size Value (USD Million) Analysis By Extraction Source, 2021 to 2025
- Current and Future Market Size Value (USD Million) Analysis and Forecast By Extraction Source, 2026 to 2036
- Curculigo capitulata Fruit Neoculin Extraction
- Recombinant Microbial Protein Expression
- Plant Tissue Culture Regeneration
- Cell-Free Enzymatic Synthesis
- Y-o-Y Growth Trend Analysis By Extraction Source, 2021 to 2025
- Absolute $ Opportunity Analysis By Extraction Source, 2026 to 2036
- Global Market Analysis and Forecast, By Formulation Format, 2021 to 2036
- Introduction / Key Findings
- Historical Market Size Value (USD Million) Analysis By Formulation Format, 2021 to 2025
- Current and Future Market Size Value (USD Million) Analysis and Forecast By Formulation Format, 2026 to 2036
- Lyophilized Purified Protein Powder
- Aqueous Liquid Extract
- Co-Spray-Dried Maltodextrin and Trehalose Blends
- Microencapsulated Acid-Release Granules
- Y-o-Y Growth Trend Analysis By Formulation Format, 2021 to 2025
- Absolute $ Opportunity Analysis By Formulation Format, 2026 to 2036
- Global Market Analysis and Forecast, By Functional Role, 2021 to 2036
- Introduction / Key Findings
- Historical Market Size Value (USD Million) Analysis By Functional Role, 2021 to 2025
- Current and Future Market Size Value (USD Million) Analysis and Forecast By Functional Role, 2026 to 2036
- Acid-Triggered Sweetening Agent
- Sugar-Free Flavor Enhancer
- Specialty Food Science Research
- Pharmaceutical Palatability Excipient
- Bitterness and Off-Note Masker
- Y-o-Y Growth Trend Analysis By Functional Role, 2021 to 2025
- Absolute $ Opportunity Analysis By Functional Role, 2026 to 2036
- Global Market Analysis and Forecast, By Application Category, 2021 to 2036
- Introduction / Key Findings
- Historical Market Size Value (USD Million) Analysis By Application Category, 2021 to 2025
- Current and Future Market Size Value (USD Million) Analysis and Forecast By Application Category, 2026 to 2036
- Acidic Functional Beverages and Sour Dairy
- Sugar-Free Confectionery and Chewing Gum
- Chewable Nutraceuticals and Oral Care
- Culinary Sauces and Dressings
- Y-o-Y Growth Trend Analysis By Application Category, 2021 to 2025
- Absolute $ Opportunity Analysis By Application Category, 2026 to 2036
- Global Market Analysis and Forecast, By Distribution Channel, 2021 to 2036
- Introduction / Key Findings
- Historical Market Size Value (USD Million) Analysis By Distribution Channel, 2021 to 2025
- Current and Future Market Size Value (USD Million) Analysis and Forecast By Distribution Channel, 2026 to 2036
- Direct B2B Flavor and Beverage Contracts
- Specialty Sweetener and Ingredient Distributors
- Contract Research and Biochemical Catalogues
- Online B2B Ingredient Portals
- Y-o-Y Growth Trend Analysis By Distribution Channel, 2021 to 2025
- Absolute $ Opportunity Analysis By Distribution Channel, 2026 to 2036
- Global Market Analysis and Forecast, By Region, 2021 to 2036
- Introduction
- Historical Market Size Value (USD Million) Analysis By Region, 2021 to 2025
- Current Market Size Value (USD Million) Analysis and Forecast By Region, 2026 to 2036
- North America
- Latin America
- Western Europe
- Eastern Europe
- East Asia
- South Asia and Pacific
- Middle East and Africa
- Market Attractiveness Analysis By Region
- North America Market Analysis and Forecast, By Country, 2021 to 2036
- Historical Market Size Value (USD Million) Trend Analysis By Market Taxonomy, 2021 to 2025
- Market Size Value (USD Million) Forecast By Market Taxonomy, 2026 to 2036
- By Country
- United States
- Canada
- By Extraction Source
- By Formulation Format
- By Functional Role
- By Application Category
- By Distribution Channel
- By Country
- Market Attractiveness Analysis
- By Country
- By Extraction Source
- By Formulation Format
- By Functional Role
- By Application Category
- By Distribution Channel
- Key Takeaways
- Latin America Market Analysis and Forecast, By Country
- Historical Market Size Value (USD Million) Trend Analysis By Market Taxonomy, 2021 to 2025
- Market Size Value (USD Million) Forecast By Market Taxonomy, 2026 to 2036
- By Country
- Brazil
- Mexico
- Argentina
- Chile
- By Extraction Source
- By Formulation Format
- By Functional Role
- By Application Category
- By Distribution Channel
- By Country
- Market Attractiveness Analysis
- By Country
- By Extraction Source
- By Formulation Format
- By Functional Role
- By Application Category
- By Distribution Channel
- Key Takeaways
- Western Europe Market Analysis and Forecast, By Country
- Historical Market Size Value (USD Million) Trend Analysis By Market Taxonomy, 2021 to 2025
- Market Size Value (USD Million) Forecast By Market Taxonomy, 2026 to 2036
- By Country
- Germany
- France
- United Kingdom
- Italy
- Spain
- Benelux
- Nordics
- By Extraction Source
- By Formulation Format
- By Functional Role
- By Application Category
- By Distribution Channel
- By Country
- Market Attractiveness Analysis
- By Country
- By Extraction Source
- By Formulation Format
- By Functional Role
- By Application Category
- By Distribution Channel
- Key Takeaways
- Eastern Europe Market Analysis and Forecast, By Country
- Historical Market Size Value (USD Million) Trend Analysis By Market Taxonomy, 2021 to 2025
- Market Size Value (USD Million) Forecast By Market Taxonomy, 2026 to 2036
- By Country
- Poland
- Czech Republic
- Romania
- Hungary
- By Extraction Source
- By Formulation Format
- By Functional Role
- By Application Category
- By Distribution Channel
- By Country
- Market Attractiveness Analysis
- By Country
- By Extraction Source
- By Formulation Format
- By Functional Role
- By Application Category
- By Distribution Channel
- Key Takeaways
- East Asia Market Analysis and Forecast, By Country
- Historical Market Size Value (USD Million) Trend Analysis By Market Taxonomy, 2021 to 2025
- Market Size Value (USD Million) Forecast By Market Taxonomy, 2026 to 2036
- By Country
- China
- Japan
- South Korea
- By Extraction Source
- By Formulation Format
- By Functional Role
- By Application Category
- By Distribution Channel
- By Country
- Market Attractiveness Analysis
- By Country
- By Extraction Source
- By Formulation Format
- By Functional Role
- By Application Category
- By Distribution Channel
- Key Takeaways
- South Asia and Pacific Market Analysis and Forecast, By Country
- Historical Market Size Value (USD Million) Trend Analysis By Market Taxonomy, 2021 to 2025
- Market Size Value (USD Million) Forecast By Market Taxonomy, 2026 to 2036
- By Country
- India
- ASEAN
- Australia and New Zealand
- By Extraction Source
- By Formulation Format
- By Functional Role
- By Application Category
- By Distribution Channel
- By Country
- Market Attractiveness Analysis
- By Country
- By Extraction Source
- By Formulation Format
- By Functional Role
- By Application Category
- By Distribution Channel
- Key Takeaways
- Middle East and Africa Market Analysis and Forecast, By Country
- Historical Market Size Value (USD Million) Trend Analysis By Market Taxonomy, 2021 to 2025
- Market Size Value (USD Million) Forecast By Market Taxonomy, 2026 to 2036
- By Country
- GCC Countries
- South Africa
- Türkiye
- Israel
- By Extraction Source
- By Formulation Format
- By Functional Role
- By Application Category
- By Distribution Channel
- By Country
- Market Attractiveness Analysis
- By Country
- By Extraction Source
- By Formulation Format
- By Functional Role
- By Application Category
- By Distribution Channel
- Key Takeaways
- Key Countries Market Analysis
- United States
- Pricing Analysis
- Market Share Analysis, 2025
- By Extraction Source
- By Formulation Format
- By Functional Role
- By Application Category
- By Distribution Channel
- Canada
- Pricing Analysis
- Market Share Analysis, 2025
- By Extraction Source
- By Formulation Format
- By Functional Role
- By Application Category
- By Distribution Channel
- Mexico
- Pricing Analysis
- Market Share Analysis, 2025
- By Extraction Source
- By Formulation Format
- By Functional Role
- By Application Category
- By Distribution Channel
- Brazil
- Pricing Analysis
- Market Share Analysis, 2025
- By Extraction Source
- By Formulation Format
- By Functional Role
- By Application Category
- By Distribution Channel
- Chile
- Pricing Analysis
- Market Share Analysis, 2025
- By Extraction Source
- By Formulation Format
- By Functional Role
- By Application Category
- By Distribution Channel
- Germany
- Pricing Analysis
- Market Share Analysis, 2025
- By Extraction Source
- By Formulation Format
- By Functional Role
- By Application Category
- By Distribution Channel
- United Kingdom
- Pricing Analysis
- Market Share Analysis, 2025
- By Extraction Source
- By Formulation Format
- By Functional Role
- By Application Category
- By Distribution Channel
- Italy
- Pricing Analysis
- Market Share Analysis, 2025
- By Extraction Source
- By Formulation Format
- By Functional Role
- By Application Category
- By Distribution Channel
- Spain
- Pricing Analysis
- Market Share Analysis, 2025
- By Extraction Source
- By Formulation Format
- By Functional Role
- By Application Category
- By Distribution Channel
- France
- Pricing Analysis
- Market Share Analysis, 2025
- By Extraction Source
- By Formulation Format
- By Functional Role
- By Application Category
- By Distribution Channel
- India
- Pricing Analysis
- Market Share Analysis, 2025
- By Extraction Source
- By Formulation Format
- By Functional Role
- By Application Category
- By Distribution Channel
- ASEAN
- Pricing Analysis
- Market Share Analysis, 2025
- By Extraction Source
- By Formulation Format
- By Functional Role
- By Application Category
- By Distribution Channel
- Australia and New Zealand
- Pricing Analysis
- Market Share Analysis, 2025
- By Extraction Source
- By Formulation Format
- By Functional Role
- By Application Category
- By Distribution Channel
- China
- Pricing Analysis
- Market Share Analysis, 2025
- By Extraction Source
- By Formulation Format
- By Functional Role
- By Application Category
- By Distribution Channel
- Japan
- Pricing Analysis
- Market Share Analysis, 2025
- By Extraction Source
- By Formulation Format
- By Functional Role
- By Application Category
- By Distribution Channel
- South Korea
- Pricing Analysis
- Market Share Analysis, 2025
- By Extraction Source
- By Formulation Format
- By Functional Role
- By Application Category
- By Distribution Channel
- Poland
- Pricing Analysis
- Market Share Analysis, 2025
- By Extraction Source
- By Formulation Format
- By Functional Role
- By Application Category
- By Distribution Channel
- Hungary
- Pricing Analysis
- Market Share Analysis, 2025
- By Extraction Source
- By Formulation Format
- By Functional Role
- By Application Category
- By Distribution Channel
- Türkiye
- Pricing Analysis
- Market Share Analysis, 2025
- By Extraction Source
- By Formulation Format
- By Functional Role
- By Application Category
- By Distribution Channel
- South Africa
- Pricing Analysis
- Market Share Analysis, 2025
- By Extraction Source
- By Formulation Format
- By Functional Role
- By Application Category
- By Distribution Channel
- Netherlands
- Pricing Analysis
- Market Share Analysis, 2025
- By Extraction Source
- By Formulation Format
- By Functional Role
- By Application Category
- By Distribution Channel
- United States
- Market Structure Analysis
- Competition Dashboard
- Competition Benchmarking
- Market Share Analysis of Top Players
- By Regional
- By Extraction Source
- By Formulation Format
- By Functional Role
- By Application Category
- By Distribution Channel
- Emerging Startups
- Innovation Benchmarking
- Competition Analysis
- Competition Deep Dive
- dsm-firmenich
- Overview
- Product Portfolio
- Profitability by Market Segments
- Sales Footprint
- Strategy Overview
- Marketing Strategy
- Product Strategy
- Channel Strategy
- Archer Daniels Midland Company
- Cargill Incorporated
- International Flavors & Fragrances Inc.
- Kerry Group plc
- Givaudan SA
- Symrise AG
- Tate & Lyle PLC
- Ingredion Incorporated
- Sweegen Inc.
- Receptor-Guided Flavor and Taste-Modulation Houses
- Dedicated Sweet-Protein Biotechnology Innovators
- dsm-firmenich
- Case Studies
- Success Stories
- Recent Developments
- Competition Deep Dive
- Assumptions & Acronyms Used
List of Tables
- Table 1: Global Market Value (USD Million) Forecast by Region, 2021 to 2036
- Table 2: Global Market Value (USD Million) Forecast by Extraction Source, 2021 to 2036
- Table 3: Global Market Value (USD Million) Forecast by Formulation Format, 2021 to 2036
- Table 4: Global Market Value (USD Million) Forecast by Functional Role, 2021 to 2036
- Table 5: Global Market Value (USD Million) Forecast by Application Category, 2021 to 2036
- Table 6: Global Market Value (USD Million) Forecast by Distribution Channel, 2021 to 2036
- Table 7: North America Market Value (USD Million) Forecast by Country, 2021 to 2036
- Table 8: North America Market Value (USD Million) Forecast by Extraction Source, 2021 to 2036
- Table 9: North America Market Value (USD Million) Forecast by Formulation Format, 2021 to 2036
- Table 10: North America Market Value (USD Million) Forecast by Functional Role, 2021 to 2036
- Table 11: North America Market Value (USD Million) Forecast by Application Category, 2021 to 2036
- Table 12: North America Market Value (USD Million) Forecast by Distribution Channel, 2021 to 2036
- Table 13: Latin America Market Value (USD Million) Forecast by Country, 2021 to 2036
- Table 14: Latin America Market Value (USD Million) Forecast by Extraction Source, 2021 to 2036
- Table 15: Latin America Market Value (USD Million) Forecast by Formulation Format, 2021 to 2036
- Table 16: Latin America Market Value (USD Million) Forecast by Functional Role, 2021 to 2036
- Table 17: Latin America Market Value (USD Million) Forecast by Application Category, 2021 to 2036
- Table 18: Latin America Market Value (USD Million) Forecast by Distribution Channel, 2021 to 2036
- Table 19: Western Europe Market Value (USD Million) Forecast by Country, 2021 to 2036
- Table 20: Western Europe Market Value (USD Million) Forecast by Extraction Source, 2021 to 2036
- Table 21: Western Europe Market Value (USD Million) Forecast by Formulation Format, 2021 to 2036
- Table 22: Western Europe Market Value (USD Million) Forecast by Functional Role, 2021 to 2036
- Table 23: Western Europe Market Value (USD Million) Forecast by Application Category, 2021 to 2036
- Table 24: Western Europe Market Value (USD Million) Forecast by Distribution Channel, 2021 to 2036
- Table 25: Eastern Europe Market Value (USD Million) Forecast by Country, 2021 to 2036
- Table 26: Eastern Europe Market Value (USD Million) Forecast by Extraction Source, 2021 to 2036
- Table 27: Eastern Europe Market Value (USD Million) Forecast by Formulation Format, 2021 to 2036
- Table 28: Eastern Europe Market Value (USD Million) Forecast by Functional Role, 2021 to 2036
- Table 29: Eastern Europe Market Value (USD Million) Forecast by Application Category, 2021 to 2036
- Table 30: Eastern Europe Market Value (USD Million) Forecast by Distribution Channel, 2021 to 2036
- Table 31: East Asia Market Value (USD Million) Forecast by Country, 2021 to 2036
- Table 32: East Asia Market Value (USD Million) Forecast by Extraction Source, 2021 to 2036
- Table 33: East Asia Market Value (USD Million) Forecast by Formulation Format, 2021 to 2036
- Table 34: East Asia Market Value (USD Million) Forecast by Functional Role, 2021 to 2036
- Table 35: East Asia Market Value (USD Million) Forecast by Application Category, 2021 to 2036
- Table 36: East Asia Market Value (USD Million) Forecast by Distribution Channel, 2021 to 2036
- Table 37: South Asia and Pacific Market Value (USD Million) Forecast by Country, 2021 to 2036
- Table 38: South Asia and Pacific Market Value (USD Million) Forecast by Extraction Source, 2021 to 2036
- Table 39: South Asia and Pacific Market Value (USD Million) Forecast by Formulation Format, 2021 to 2036
- Table 40: South Asia and Pacific Market Value (USD Million) Forecast by Functional Role, 2021 to 2036
- Table 41: South Asia and Pacific Market Value (USD Million) Forecast by Application Category, 2021 to 2036
- Table 42: South Asia and Pacific Market Value (USD Million) Forecast by Distribution Channel, 2021 to 2036
- Table 43: Middle East and Africa Market Value (USD Million) Forecast by Country, 2021 to 2036
- Table 44: Middle East and Africa Market Value (USD Million) Forecast by Extraction Source, 2021 to 2036
- Table 45: Middle East and Africa Market Value (USD Million) Forecast by Formulation Format, 2021 to 2036
- Table 46: Middle East and Africa Market Value (USD Million) Forecast by Functional Role, 2021 to 2036
- Table 47: Middle East and Africa Market Value (USD Million) Forecast by Application Category, 2021 to 2036
- Table 48: Middle East and Africa Market Value (USD Million) Forecast by Distribution Channel, 2021 to 2036
List of Figures
- Figure 1: Global Market Pricing Analysis
- Figure 2: Global Market Value (USD Million) Forecast 2021-2036
- Figure 3: Global Market Value Share and BPS Analysis by Extraction Source, 2026 and 2036
- Figure 4: Global Market Y-o-Y Growth Comparison by Extraction Source, 2026-2036
- Figure 5: Global Market Attractiveness Analysis by Extraction Source
- Figure 6: Global Market Value Share and BPS Analysis by Formulation Format, 2026 and 2036
- Figure 7: Global Market Y-o-Y Growth Comparison by Formulation Format, 2026-2036
- Figure 8: Global Market Attractiveness Analysis by Formulation Format
- Figure 9: Global Market Value Share and BPS Analysis by Functional Role, 2026 and 2036
- Figure 10: Global Market Y-o-Y Growth Comparison by Functional Role, 2026-2036
- Figure 11: Global Market Attractiveness Analysis by Functional Role
- Figure 12: Global Market Value Share and BPS Analysis by Application Category, 2026 and 2036
- Figure 13: Global Market Y-o-Y Growth Comparison by Application Category, 2026-2036
- Figure 14: Global Market Attractiveness Analysis by Application Category
- Figure 15: Global Market Value Share and BPS Analysis by Distribution Channel, 2026 and 2036
- Figure 16: Global Market Y-o-Y Growth Comparison by Distribution Channel, 2026-2036
- Figure 17: Global Market Attractiveness Analysis by Distribution Channel
- Figure 18: Global Market Value (USD Million) Share and BPS Analysis by Region, 2026 and 2036
- Figure 19: Global Market Y-o-Y Growth Comparison by Region, 2026-2036
- Figure 20: Global Market Attractiveness Analysis by Region
- Figure 21: North America Market Incremental Dollar Opportunity, 2026-2036
- Figure 22: Latin America Market Incremental Dollar Opportunity, 2026-2036
- Figure 23: Western Europe Market Incremental Dollar Opportunity, 2026-2036
- Figure 24: Eastern Europe Market Incremental Dollar Opportunity, 2026-2036
- Figure 25: East Asia Market Incremental Dollar Opportunity, 2026-2036
- Figure 26: South Asia and Pacific Market Incremental Dollar Opportunity, 2026-2036
- Figure 27: Middle East and Africa Market Incremental Dollar Opportunity, 2026-2036
- Figure 28: North America Market Value Share and BPS Analysis by Country, 2026 and 2036
- Figure 29: North America Market Value Share and BPS Analysis by Extraction Source, 2026 and 2036
- Figure 30: North America Market Y-o-Y Growth Comparison by Extraction Source, 2026-2036
- Figure 31: North America Market Attractiveness Analysis by Extraction Source
- Figure 32: North America Market Value Share and BPS Analysis by Formulation Format, 2026 and 2036
- Figure 33: North America Market Y-o-Y Growth Comparison by Formulation Format, 2026-2036
- Figure 34: North America Market Attractiveness Analysis by Formulation Format
- Figure 35: North America Market Value Share and BPS Analysis by Functional Role, 2026 and 2036
- Figure 36: North America Market Y-o-Y Growth Comparison by Functional Role, 2026-2036
- Figure 37: North America Market Attractiveness Analysis by Functional Role
- Figure 38: North America Market Value Share and BPS Analysis by Application Category, 2026 and 2036
- Figure 39: North America Market Y-o-Y Growth Comparison by Application Category, 2026-2036
- Figure 40: North America Market Attractiveness Analysis by Application Category
- Figure 41: North America Market Value Share and BPS Analysis by Distribution Channel, 2026 and 2036
- Figure 42: North America Market Y-o-Y Growth Comparison by Distribution Channel, 2026-2036
- Figure 43: North America Market Attractiveness Analysis by Distribution Channel
- Figure 44: Latin America Market Value Share and BPS Analysis by Country, 2026 and 2036
- Figure 45: Latin America Market Value Share and BPS Analysis by Extraction Source, 2026 and 2036
- Figure 46: Latin America Market Y-o-Y Growth Comparison by Extraction Source, 2026-2036
- Figure 47: Latin America Market Attractiveness Analysis by Extraction Source
- Figure 48: Latin America Market Value Share and BPS Analysis by Formulation Format, 2026 and 2036
- Figure 49: Latin America Market Y-o-Y Growth Comparison by Formulation Format, 2026-2036
- Figure 50: Latin America Market Attractiveness Analysis by Formulation Format
- Figure 51: Latin America Market Value Share and BPS Analysis by Functional Role, 2026 and 2036
- Figure 52: Latin America Market Y-o-Y Growth Comparison by Functional Role, 2026-2036
- Figure 53: Latin America Market Attractiveness Analysis by Functional Role
- Figure 54: Latin America Market Value Share and BPS Analysis by Application Category, 2026 and 2036
- Figure 55: Latin America Market Y-o-Y Growth Comparison by Application Category, 2026-2036
- Figure 56: Latin America Market Attractiveness Analysis by Application Category
- Figure 57: Latin America Market Value Share and BPS Analysis by Distribution Channel, 2026 and 2036
- Figure 58: Latin America Market Y-o-Y Growth Comparison by Distribution Channel, 2026-2036
- Figure 59: Latin America Market Attractiveness Analysis by Distribution Channel
- Figure 60: Western Europe Market Value Share and BPS Analysis by Country, 2026 and 2036
- Figure 61: Western Europe Market Value Share and BPS Analysis by Extraction Source, 2026 and 2036
- Figure 62: Western Europe Market Y-o-Y Growth Comparison by Extraction Source, 2026-2036
- Figure 63: Western Europe Market Attractiveness Analysis by Extraction Source
- Figure 64: Western Europe Market Value Share and BPS Analysis by Formulation Format, 2026 and 2036
- Figure 65: Western Europe Market Y-o-Y Growth Comparison by Formulation Format, 2026-2036
- Figure 66: Western Europe Market Attractiveness Analysis by Formulation Format
- Figure 67: Western Europe Market Value Share and BPS Analysis by Functional Role, 2026 and 2036
- Figure 68: Western Europe Market Y-o-Y Growth Comparison by Functional Role, 2026-2036
- Figure 69: Western Europe Market Attractiveness Analysis by Functional Role
- Figure 70: Western Europe Market Value Share and BPS Analysis by Application Category, 2026 and 2036
- Figure 71: Western Europe Market Y-o-Y Growth Comparison by Application Category, 2026-2036
- Figure 72: Western Europe Market Attractiveness Analysis by Application Category
- Figure 73: Western Europe Market Value Share and BPS Analysis by Distribution Channel, 2026 and 2036
- Figure 74: Western Europe Market Y-o-Y Growth Comparison by Distribution Channel, 2026-2036
- Figure 75: Western Europe Market Attractiveness Analysis by Distribution Channel
- Figure 76: Eastern Europe Market Value Share and BPS Analysis by Country, 2026 and 2036
- Figure 77: Eastern Europe Market Value Share and BPS Analysis by Extraction Source, 2026 and 2036
- Figure 78: Eastern Europe Market Y-o-Y Growth Comparison by Extraction Source, 2026-2036
- Figure 79: Eastern Europe Market Attractiveness Analysis by Extraction Source
- Figure 80: Eastern Europe Market Value Share and BPS Analysis by Formulation Format, 2026 and 2036
- Figure 81: Eastern Europe Market Y-o-Y Growth Comparison by Formulation Format, 2026-2036
- Figure 82: Eastern Europe Market Attractiveness Analysis by Formulation Format
- Figure 83: Eastern Europe Market Value Share and BPS Analysis by Functional Role, 2026 and 2036
- Figure 84: Eastern Europe Market Y-o-Y Growth Comparison by Functional Role, 2026-2036
- Figure 85: Eastern Europe Market Attractiveness Analysis by Functional Role
- Figure 86: Eastern Europe Market Value Share and BPS Analysis by Application Category, 2026 and 2036
- Figure 87: Eastern Europe Market Y-o-Y Growth Comparison by Application Category, 2026-2036
- Figure 88: Eastern Europe Market Attractiveness Analysis by Application Category
- Figure 89: Eastern Europe Market Value Share and BPS Analysis by Distribution Channel, 2026 and 2036
- Figure 90: Eastern Europe Market Y-o-Y Growth Comparison by Distribution Channel, 2026-2036
- Figure 91: Eastern Europe Market Attractiveness Analysis by Distribution Channel
- Figure 92: East Asia Market Value Share and BPS Analysis by Country, 2026 and 2036
- Figure 93: East Asia Market Value Share and BPS Analysis by Extraction Source, 2026 and 2036
- Figure 94: East Asia Market Y-o-Y Growth Comparison by Extraction Source, 2026-2036
- Figure 95: East Asia Market Attractiveness Analysis by Extraction Source
- Figure 96: East Asia Market Value Share and BPS Analysis by Formulation Format, 2026 and 2036
- Figure 97: East Asia Market Y-o-Y Growth Comparison by Formulation Format, 2026-2036
- Figure 98: East Asia Market Attractiveness Analysis by Formulation Format
- Figure 99: East Asia Market Value Share and BPS Analysis by Functional Role, 2026 and 2036
- Figure 100: East Asia Market Y-o-Y Growth Comparison by Functional Role, 2026-2036
- Figure 101: East Asia Market Attractiveness Analysis by Functional Role
- Figure 102: East Asia Market Value Share and BPS Analysis by Application Category, 2026 and 2036
- Figure 103: East Asia Market Y-o-Y Growth Comparison by Application Category, 2026-2036
- Figure 104: East Asia Market Attractiveness Analysis by Application Category
- Figure 105: East Asia Market Value Share and BPS Analysis by Distribution Channel, 2026 and 2036
- Figure 106: East Asia Market Y-o-Y Growth Comparison by Distribution Channel, 2026-2036
- Figure 107: East Asia Market Attractiveness Analysis by Distribution Channel
- Figure 108: South Asia and Pacific Market Value Share and BPS Analysis by Country, 2026 and 2036
- Figure 109: South Asia and Pacific Market Value Share and BPS Analysis by Extraction Source, 2026 and 2036
- Figure 110: South Asia and Pacific Market Y-o-Y Growth Comparison by Extraction Source, 2026-2036
- Figure 111: South Asia and Pacific Market Attractiveness Analysis by Extraction Source
- Figure 112: South Asia and Pacific Market Value Share and BPS Analysis by Formulation Format, 2026 and 2036
- Figure 113: South Asia and Pacific Market Y-o-Y Growth Comparison by Formulation Format, 2026-2036
- Figure 114: South Asia and Pacific Market Attractiveness Analysis by Formulation Format
- Figure 115: South Asia and Pacific Market Value Share and BPS Analysis by Functional Role, 2026 and 2036
- Figure 116: South Asia and Pacific Market Y-o-Y Growth Comparison by Functional Role, 2026-2036
- Figure 117: South Asia and Pacific Market Attractiveness Analysis by Functional Role
- Figure 118: South Asia and Pacific Market Value Share and BPS Analysis by Application Category, 2026 and 2036
- Figure 119: South Asia and Pacific Market Y-o-Y Growth Comparison by Application Category, 2026-2036
- Figure 120: South Asia and Pacific Market Attractiveness Analysis by Application Category
- Figure 121: South Asia and Pacific Market Value Share and BPS Analysis by Distribution Channel, 2026 and 2036
- Figure 122: South Asia and Pacific Market Y-o-Y Growth Comparison by Distribution Channel, 2026-2036
- Figure 123: South Asia and Pacific Market Attractiveness Analysis by Distribution Channel
- Figure 124: Middle East and Africa Market Value Share and BPS Analysis by Country, 2026 and 2036
- Figure 125: Middle East and Africa Market Value Share and BPS Analysis by Extraction Source, 2026 and 2036
- Figure 126: Middle East and Africa Market Y-o-Y Growth Comparison by Extraction Source, 2026-2036
- Figure 127: Middle East and Africa Market Attractiveness Analysis by Extraction Source
- Figure 128: Middle East and Africa Market Value Share and BPS Analysis by Formulation Format, 2026 and 2036
- Figure 129: Middle East and Africa Market Y-o-Y Growth Comparison by Formulation Format, 2026-2036
- Figure 130: Middle East and Africa Market Attractiveness Analysis by Formulation Format
- Figure 131: Middle East and Africa Market Value Share and BPS Analysis by Functional Role, 2026 and 2036
- Figure 132: Middle East and Africa Market Y-o-Y Growth Comparison by Functional Role, 2026-2036
- Figure 133: Middle East and Africa Market Attractiveness Analysis by Functional Role
- Figure 134: Middle East and Africa Market Value Share and BPS Analysis by Application Category, 2026 and 2036
- Figure 135: Middle East and Africa Market Y-o-Y Growth Comparison by Application Category, 2026-2036
- Figure 136: Middle East and Africa Market Attractiveness Analysis by Application Category
- Figure 137: Middle East and Africa Market Value Share and BPS Analysis by Distribution Channel, 2026 and 2036
- Figure 138: Middle East and Africa Market Y-o-Y Growth Comparison by Distribution Channel, 2026-2036
- Figure 139: Middle East and Africa Market Attractiveness Analysis by Distribution Channel
- Figure 140: Global Market - Tier Structure Analysis
- Figure 141: Global Market - Company Share Analysis
Frequently Asked Questions
How big is the Curculin Market in 2026, and what is forecast for 2036?
FMI estimates that the global curculin market size stood at USD 620.5 million in 2025 and reached USD 651.7 million in 2026. Total market valuation is projected to attain USD 1,092.3 million by 2036 as beverage and dairy processors adopt acid-triggered sweet proteins and taste modulators.
What is the CAGR for the Curculin Market from 2026 to 2036?
The curculin market is forecast to expand at a 5.3% CAGR between 2026 and 2036. This progression generates USD 440.6 million in incremental revenue across reduced-sugar acidic beverages and chewable supplements.
Which extraction source segment leads the Curculin Market?
Curculigo capitulata and C. latifolia Fruit Neoculin Extraction holds 67.3% of extraction source demand in 2026 since purified botanical fruit preparations support clean-label natural flavor declarations.
Which formulation format segment leads the Curculin Market?
Lyophilized Purified Protein Powder represents 71.1% of the formulation format category in 2026 as vacuum freeze-drying with trehalose protects the disulfide-linked NAS-NBS heterodimer from dissociating.
Which country has a notable growth outlook during the assessment period?
China leads national growth projections at a 6.1% CAGR through 2036, driven by zero-sugar ready-to-drink fruit tea bottling and domestic biomanufacturing fermentation investments.
Who are the key players in the market?
Precision fermentation and sweetener suppliers include dsm-firmenich, ADM, and Cargill as well as Tate & Lyle and Ingredion. Flavor innovators include IFF, Kerry, and Givaudan. Symrise and Sweegen supply sweet-receptor modulators and sweet proteins.
Preview the report firsthand - request a free sample
Get SampleGet the brochure for pricing and purchase details.
Get PDF
