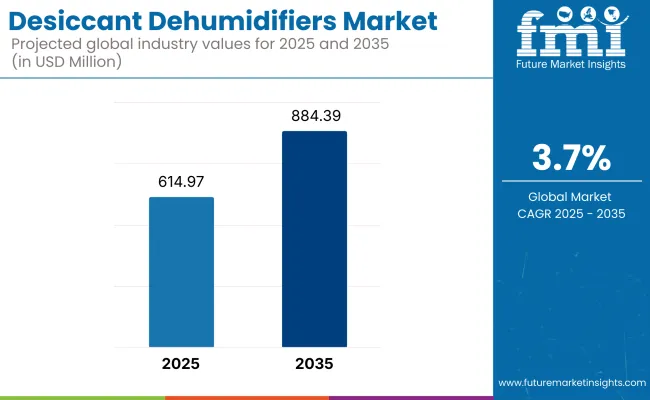
The global desiccant dehumidifiers market is estimated to be valued at USD 614.97 million in 2025, expanding steadily to USD 884.39 million by 2035, at a CAGR of 3.7%. Growth is largely driven by demand in pharmaceuticals, food processing, cold storage, and data centers.
While North America and Europe have historically led the market due to stringent humidity and energy-efficiency regulations, Asia-Pacific is emerging as the fastest-growing region, fueled by industrial expansion in China, India, and Southeast Asia.
Demand for precise humidity control across sensitive environments is pushing industries toward desiccant-based systems, which outperform traditional refrigerant models in low-temperature and low-humidity settings. Regulatory mandates, such as the EPA's Energy Star program in the U.S. and the Eco-design Directive in the EU, are further accelerating the adoption of energy-efficient systems.
Meanwhile, rental and temporary deployment models are finding traction in construction, disaster response, and event management sectors.
The outlook for the industry is increasingly shaped by smart technologies and AI integration. Over 70% of surveyed end-users in FMI's 2025 study showed interest in IoT-enabled dehumidifiers, while manufacturers are actively investing in modular, customizable, and eco-friendly solutions to meet evolving demand.
Challenges remain in the form of high upfront costs and supply chain volatility, but innovation in predictive maintenance and automation is expected to offset these barriers and open new revenue streams across industrial verticals.
Moreover, the push toward sustainable construction and green building certifications like LEED and BREEAM is amplifying the demand for energy-efficient desiccant dehumidification systems, particularly in commercial real estate and institutional infrastructure. Emerging trends include the integration of silica gel and lithium chloride desiccants with renewable energy-powered HVAC setups, as governments incentivize low-carbon technologies.
In parallel, manufacturers are developing compact, wall-mounted, and hybrid dehumidifiers to cater to space-constrained urban facilities and off-grid applications. As climate resilience becomes a critical infrastructure priority, the desiccant dehumidifier market is poised to play a vital role in maintaining air quality, product integrity, and process reliability across diverse industrial ecosystems.
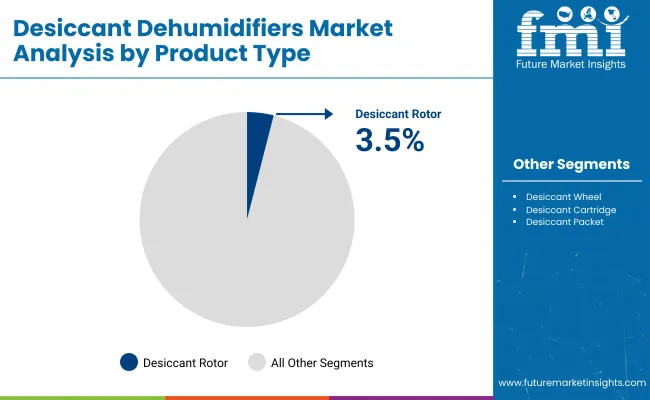
Desiccant rotor dehumidifiers are expected to continue dominating the market due to their superior efficiency in removing moisture under extreme low-humidity and low-temperature conditions. These systems are widely used in critical environments such as pharmaceutical production, cold chains, and server rooms, where conventional refrigerant-based units fall short.
Their modular design also makes them ideal for integration into commercial HVAC infrastructure, ensuring regulatory compliance and lower long-term operational costs.
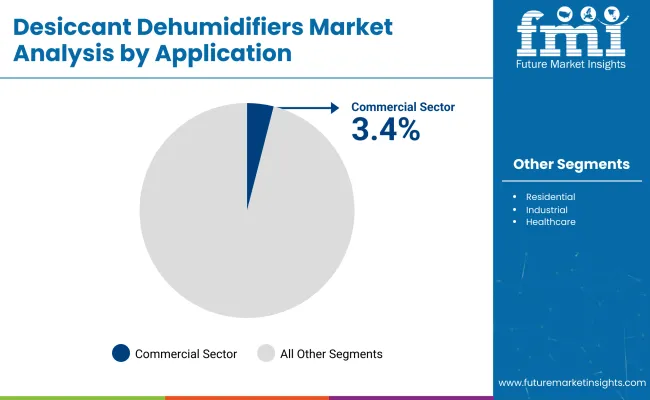
The commercial segment leads application-wise, growing at a CAGR of 3.4%, with strong demand from pharmaceuticals, hotels, data centers, and warehouses. Dehumidification is essential in pharmaceutical and electronics manufacturing to avoid contamination and corrosion. Additionally, the rapid expansion of data centers and logistics hubs worldwide is spurring demand for precise climate control systems to ensure operational continuity and protect sensitive assets.
(Survey conducted Q4 2024, n=500 participants across manufacturers, distributors, industrial end-users, and facility managers in North America, Europe, Asia-Pacific, and Latin America)
Regional Variance
Regional Insights
Regional Breakdown
Investment Priorities by Region
The desiccant dehumidifiers market is undergoing a transformation driven by energy efficiency, smart technology adoption, and customization needs. While developed industries are focusing on automation and sustainability, emerging regions prioritize affordability and reliability. As demand grows, businesses must align their strategies with regional trends and evolving regulations.
| Countries/Region | Regulations & Certifications Impacting the Industry |
|---|---|
| United States |
|
| European Union |
|
| China |
|
| Japan |
|
| South Korea |
|
| India |
|
| Australia |
|
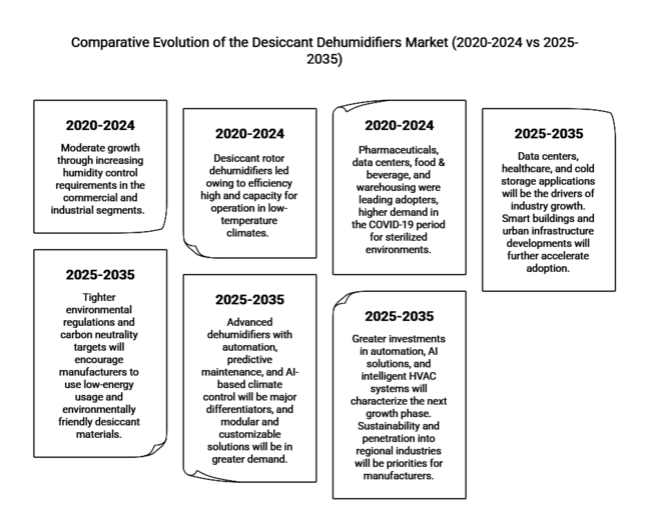
| 2020 to 2024 (Industry Performance & Trends) | 2025 to 2035 (Future Projections & Growth Drivers) |
|---|---|
| The desiccant dehumidifiers market displayed moderate growth through increasing humidity control requirements in the commercial and industrial segments. Regional differences were the CAGR continued at ~3.5%, steady. | Growth will be steady with a forecasted CAGR of 3.7% globally, driven by technological innovation, energy-efficient technology, and compliance with regulations. |
| Desiccant rotor dehumidifiers led owing to efficiency high and capacity for operation in low-temperature climates. Industrial, commercial applications prompted most sales. | There will be the ongoing dominance of desiccant rotor dehumidifiers but IoT-based and AI-based models will increase their foothold, leading to improved operational efficiency and remote monitoring. |
| Pharmaceuticals, data centers, food & beverage, and warehousing were leading adopters, higher demand in the COVID-19 period for sterilized environments. | Data centers, healthcare, and cold storage applications will be the drivers of industry growth. Smart buildings and urban infrastructure developments will further accelerate adoption. |
| North America and Europe dominated the industry because of strict regulations on humidity control. Asia-Pacific recorded high growth because of industrialization and growing investments in the pharmaceutical sector. | Asia-Pacific will lead, driven by expanding e-commerce warehouses, semiconductor businesses, and state-supported manufacturing expansion. North America and Europe will grow but more slowly. |
| The government mandated tough humidity control regulations in the pharma, food processing, and HVAC sectors. Energy-efficient dehumidifiers were encouraged by sustainability regulations. | Tighter environmental regulations and carbon neutrality targets will encourage manufacturers to use low-energy usage and environmentally friendly desiccant materials. |
| Conventional manual control dehumidifiers were very common, with less integration of IoT. Portable and rental dehumidifiers became more popular. | Advanced dehumidifiers with automation, predictive maintenance, and AI-based climate control will be major differentiators, and modular and customizable solutions will be in greater demand. |
| Supply chain disturbances, volatile raw material costs, and the upfront cost made adoption widespread among small enterprises and households difficult. | Energy cost volatility, price competition pressures, and technology adjustment costs will continue to test industry players. Relief may come in the form of government incentives for energy efficiency, though. |
| Large corporations undertook R&D spending on energy-saving models, whereas mergers and acquisitions enabled enlargement of manufacturing capabilities. | Greater investments in automation, AI solutions, and intelligent HVAC systems will characterize the next growth phase. Sustainability and penetration into regional industries will be priorities for manufacturers. |
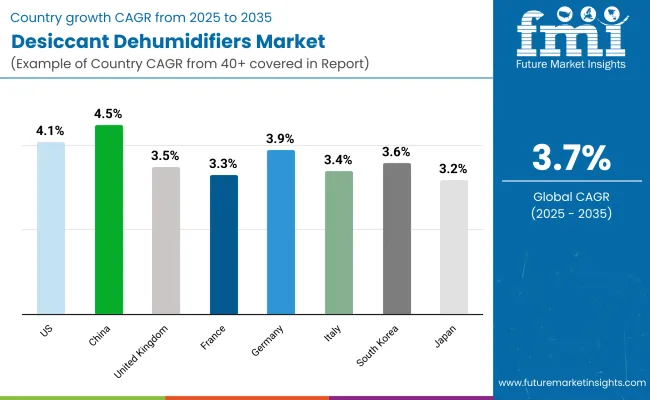
The USA is poised for steady growth in humidity control solutions, with an estimated CAGR of 4.1% from 2025 to 2035, surpassing the global average of 3.7%. This growth is fueled by rising demand in industrial applications, particularly in pharmaceuticals, food storage, data centers, and cleanrooms.
The USA EPA's Energy Star program and ASHRAE standards (90.1 & 62.1) are pushing manufacturers toward energy-efficient models, creating a strong demand for sustainable dehumidification solutions.
Additionally, disaster recovery and mold prevention are key drivers, as extreme weather events and humidity-related damage continue to impact residential and commercial properties. Construction sites and temporary humidity control services are witnessing a surge in demand for portable solutions.
The presence of leading HVAC and air quality solution providers in the USA further strengthens industry growth. However, high initial costs and maintenance expenses may slow adoption in small and medium-sized enterprises (SMEs).
Nevertheless, the increasing integration of IoT-enabled dehumidification systems for remote monitoring and predictive maintenance is expected to enhance adoption. The USA is expected to remain one of the most lucrative regions, with strong technological advancements and regulatory backing shaping future expansion.
The UK is forecasted to grow at a CAGR of 3.5% from 2025 to 2035, slightly below the global average. Industrial applications, commercial real estate, and data center expansion largely drive the demand. The UK’s Ecodesign and Energy Labelling Regulations, along with its Net Zero targets for 2050, have made energy-efficient solutions a priority, prompting increased investment in low-energy humidity control systems.
The UK’s damp climate and strict building regulations necessitate effective humidity control solutions, particularly in residential basements, heritage sites, and indoor swimming pools. Additionally, pharmaceutical, food processing, and logistics industries continue to rely on high-performance solutions to maintain compliance with stringent humidity standards.
Despite the growing demand, Brexit-related trade complexities have affected supply chains, leading to fluctuating product prices. Additionally, rising electricity costs pose a challenge to businesses adopting high-powered dehumidification solutions. However, government incentives for energy-efficient HVAC solutions and increased demand for rental humidity control services are expected to keep industry growth stable.
The UK remains a strong hub for premium dehumidification systems, with continued advancements in smart humidity control technologies and carbon-reducing innovations driving long-term expansion.
France is expected to register a CAGR of 3.3% from 2025 to 2035, slightly below the global average. The demand for industrial humidity control solutions is rising, particularly in winemaking, food processing, and pharmaceuticals, where humidity control is essential. Strict EU environmental policies, such as the Eco-design Directive, are pushing manufacturers to adopt energy-efficient systems that align with sustainability goals.
One of the key growth drivers is the increasing application of humidity control solutions in historical buildings, museums, and archives. The French government actively funds preservation efforts, ensuring demand for high-performance dehumidifiers in these settings. Additionally, urbanization and rising real estate developments are supporting the adoption of dehumidification systems in commercial and residential properties.
However, high product costs and economic uncertainties may impact overall expansion. French manufacturers are responding by introducing rental models and portable dehumidifiers, catering to seasonal demand in construction and event management. As France strengthens its energy efficiency policies, manufacturers focusing on IoT-driven, automated dehumidification systems are expected to gain a competitive advantage.
Germany is projected to grow at a CAGR of 3.9% from 2025 to 2035, driven by the country’s strict energy efficiency policies and industrial demand. Germany’s industrial sector-particularly automotive, pharmaceuticals, and food storage-accounts for significant adoption, as factories and warehouses require precise humidity control.
The EU’s Eco-design Directive and REACH compliance regulations have made sustainability a priority, encouraging German manufacturers to invest in low-energy, high-performance humidity control solutions. Additionally, data centers and semiconductor manufacturing are seeing increased demand for specialized dehumidification systems to maintain optimal air conditions.
Despite strong industry performance, high manufacturing and energy costs pose challenges for local companies. However, Germany’s engineering expertise and focus on automation have led to the rapid adoption of smart dehumidification solutions, integrating IoT, AI-based monitoring, and predictive maintenance. Expansion is expected to continue, driven by technological innovation and stringent efficiency standards.
Italy is forecast to expand at a CAGR of 3.4% from 2025 to 2035. The country's hot and humid climate, particularly in southern regions, drives high demand for industrial and residential humidity control solutions. The wine, food processing, and pharmaceutical industries are major adopters, as they require strict moisture control for product preservation.
The Italian government’s energy efficiency incentives encourage businesses to invest in sustainable HVAC solutions, driving demand for low-energy humidity control systems. Additionally, cultural heritage preservation efforts in historical buildings and museums have led to steady growth in demand for precision humidity control solutions.
However, economic volatility and high import taxes pose challenges, making rental and temporary dehumidification solutions increasingly popular. As the Italian construction sector continues to recover, demand for portable, high-performance dehumidifiers is expected to strengthen overall adoption.
South Korea is anticipated to expand at a CAGR of 3.6% from 2025 to 2035. The country’s booming semiconductor and electronics manufacturing industries require precise humidity control, fueling strong demand for industrial-grade dehumidifiers.
The Korea Energy Efficiency Label and Standard (KEELS) Program mandates high-efficiency dehumidification systems, driving innovation in smart, IoT-integrated devices. Additionally, rising commercial and residential real estate developments have increased the adoption of compact and modular dehumidifiers.
Despite strong growth prospects, fluctuating import duties on HVAC components present supply chain challenges. However, government incentives for eco-friendly technologies and rising consumer awareness of indoor air quality are expected to support sustained expansion.
Japan is projected to grow at a CAGR of ~3.2% from 2025 to 2035, slightly below the global average due to saturation in industrial applications. However, increasing adoption of smart homes and aging infrastructure maintenance are expected to drive steady demand. High humidity levels, frequent typhoons, and seasonal temperature variations make dehumidification essential in residential, commercial, and industrial settings.
The Japanese Industrial Standards (JIS) for HVAC systems enforce strict humidity control measures, particularly in pharmaceuticals, electronics, and food processing sectors. Additionally, the country's aging infrastructure, including museums, archives, and historical buildings, has created a demand for precision humidity control to prevent material degradation.
Japan’s rapid adoption of IoT-enabled appliances is also shaping industry trends. AI-driven dehumidification systems with automated controls and real-time humidity monitoring are becoming popular in smart home ecosystems.
However, high product costs and limited domestic manufacturing pose challenges, leading to increased imports from China and South Korea. Despite this, government incentives for energy-efficient appliances and growing awareness of indoor air quality solutions are expected to support long-term expansion.
China is forecast to expand at a CAGR of ~4.5% from 2025 to 2035, outpacing the global average due to strong industrialization, climate conditions, and government policies. The manufacturing, pharmaceutical, and logistics sectors require high-performance humidity control solutions, driving increased adoption of industrial dehumidification systems.
China’s National Energy Efficiency Standards for HVAC systems have pushed manufacturers to develop eco-friendly, low-energy dehumidifiers, aligning with the country’s carbon neutrality goals for 2060. Additionally, severe air pollution and high humidity levels in coastal regions are fueling demand for air purification and dehumidification combined systems.
China is also emerging as a key exporter of humidity control solutions, with local manufacturers producing cost-effective, high-volume units for industries. However, rising raw material costs and supply chain disruptions pose challenges. Additionally, foreign HVAC brands face competition from domestic manufacturers, leading to price-sensitive industry dynamics.
The rise of smart factories and AI-powered climate control systems is expected to drive the next phase of growth. Government-backed industrial modernization initiatives, such as Made in China 2025, will further support technological advancements and innovation in humidity control solutions.
The industry is segmented into desiccant rotor dehumidifiers, desiccant wheel dehumidifiers, desiccant cartridge dehumidifiers, and desiccant packet dehumidifiers.
In terms of application, the sector is segmented into commercial, residential, industrial, healthcare, food and beverage, pharmaceuticals, warehousing and storage, data centers, and others.
The industry is segmented by region into North America, Latin America, Western Europe, South Asia & Pacific, East Asia, Middle East, and Africa.
Growing industrial applications, stricter humidity control requirements, energy efficiency regulations, and increasing adoption in pharmaceuticals, food processing, and data centers are major drivers.
Advanced dehumidification systems excel in low-temperature and low-humidity environments, making them ideal for cold storage, pharmaceuticals, and industrial drying processes. At the same time, refrigerant-based units work better in warmer, high-humidity conditions.
Key industries include pharmaceuticals, food and beverage, warehousing, data centers, electronics manufacturing, healthcare, and commercial buildings, where precise moisture control is essential.
Innovations such as IoT integration, real-time monitoring, AI-driven efficiency optimization, and eco-friendly moisture-absorbing materials are enhancing performance, energy savings, and automation capabilities.
Regulations focused on energy efficiency, indoor air quality, and industrial safety are pushing businesses to invest in advanced humidity control solutions that comply with evolving standards.


Full Research Suite comprises of:
Market outlook & trends analysis
Interviews & case studies
Strategic recommendations
Vendor profiles & capabilities analysis
5-year forecasts
8 regions and 60+ country-level data splits
Market segment data splits
12 months of continuous data updates
DELIVERED AS:
PDF EXCEL ONLINE
Desiccant Bags Market Size and Share Forecast Outlook 2025 to 2035
Desiccants Market Size and Share Forecast Outlook 2025 to 2035
Desiccant Wheel Market Growth - Trends & Forecast 2025 to 2035
Desiccant Paper Market
Gas Desiccant Dehydration Unit Market Size and Share Forecast Outlook 2025 to 2035
Clay Desiccant Bag Market
Liquid Desiccant Natural Gas Dehydration Unit Market Size and Share Forecast Outlook 2025 to 2035
Portable Dehumidifiers Market Analysis & Forecast by Type, Power, Capacity, Application, Sales channels and region (2025 to 2035)

Thank you!
You will receive an email from our Business Development Manager. Please be sure to check your SPAM/JUNK folder too.
Chat With
MaRIA