Diphosphates Market Size and Share Forecast Outlook 2025 to 2035

The Diphosphates Market is estimated to be valued at USD 507.4 million in 2025 and is projected to reach USD 773.0 million by 2035, registering a compound annual growth rate (CAGR) of 4.3% over the forecast period.
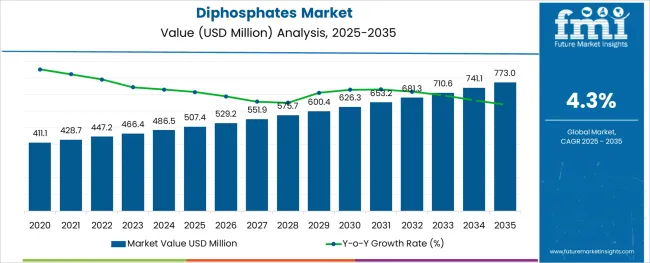
Quick Stats for Diphosphates Market

  • Market Industry Value (2025): USD 507.4 million
  • Market Forecast Value (2035): USD 773.0 million
  • Market Forecast CAGR: 4.3%
  • Leading Segment in 2025: Emulsifier (23.5%)
  • Key Growth Region: North America, Asia-Pacific, Europe
  • Top Key Players: Hubei Xingfa Chemicals Group Co., Ltd., Aditya Birla Chemicals, Sigma-Aldrich, Trivenichemical, Shandong IRO HEDP Co., Generichem Corp, Nexeo solutions, Mutchler Inc.

Diphosphates Market

Rationale for Segmental Growth in the Diphosphates Market

Market Overview

The diphosphates market is experiencing notable growth as industries increasingly adopt these compounds for their functional versatility and compliance with food safety and industrial standards. Rising demand from the food and beverage sector, coupled with expanding applications in water treatment, ceramics, and pharmaceuticals, is shaping market dynamics.

The ability of diphosphates to act as stabilizers, emulsifiers, and leavening agents has positioned them as critical ingredients in processed and packaged food formulations. Growing consumer preference for high quality, stable, and safe food products has encouraged manufacturers to integrate diphosphates into their production processes.

Future growth is anticipated to be supported by technological advancements in formulation techniques, stringent regulatory frameworks ensuring product quality, and increasing urbanization that drives demand for convenience foods. The combination of improved functional properties and adaptability to diverse industrial processes is expected to sustain market momentum and create further opportunities for innovation.

Segmental Analysis

The market is segmented by Application Type, End Use Industry Type, and Product Type and region. By Application Type, the market is divided into Emulsifier, Bulking agent, Thickener, Water retaining agent, Antioxidant, Texture modification, Maintain color, and Acidification. In terms of End Use Industry Type, the market is classified into Food Industry, Beverage Industry, and Cosmetic Industry.

Based on Product Type, the market is segmented into Disodium, Trisodium, Tetrasodium, Dipotassium, Magnesium dihydrogen, Tetrapotassium, Dicalcium, Calcium dihydrogen, and Dimagnesium. Regionally, the market is classified into North America, Latin America, Western Europe, Eastern Europe, Balkan & Baltic Countries, Russia & Belarus, Central Asia, East Asia, South Asia & Pacific, and the Middle East & Africa.
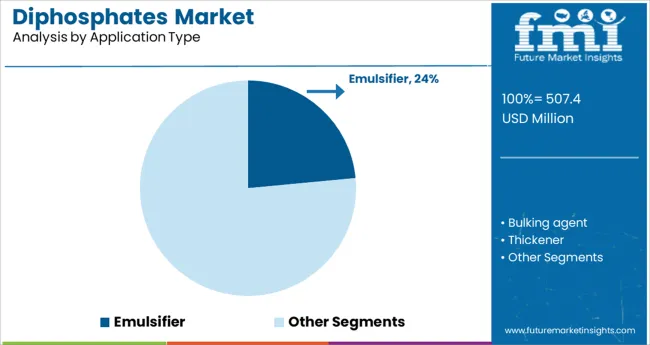
Insights into the Emulsifier Application Type Segment

Diphosphates Market Analysis By Application Type

When segmented by application type, the emulsifier segment is projected to account for 23.5% of the total market revenue in 2025, positioning it as the leading application. This dominance is attributed to the widespread use of diphosphates in enhancing texture, stability, and shelf life of processed foods and beverages.

Their ability to prevent phase separation in emulsions, maintain uniform consistency, and improve moisture retention has reinforced their importance in food formulations. Manufacturers have increasingly relied on these functional attributes to meet consumer expectations for high quality and visually appealing products while optimizing production efficiency.

The emulsifier segment’s leadership has also been strengthened by its role in supporting clean label trends, as it enables formulation of products with fewer synthetic additives while maintaining desirable sensory characteristics.
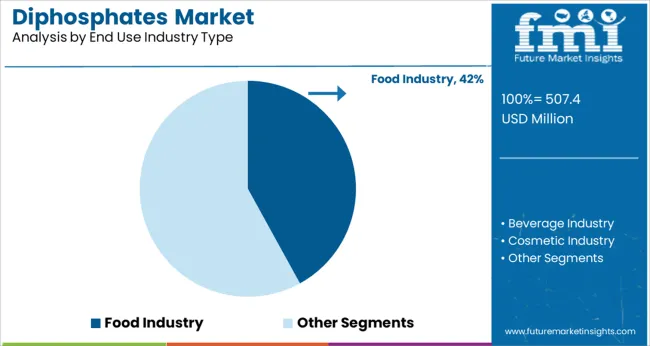
Insights into the Food Industry End Use Industry Type Segment

Diphosphates Market Analysis By End Use Industry Type

Segmented by end use industry type, the food industry is expected to hold 42.0% of the market revenue in 2025, making it the leading segment. This strong position is driven by the integral role of diphosphates in the production of baked goods, dairy, meat, and ready to eat products.

Their multifunctional properties, such as acting as leavening agents, pH regulators, and moisture binders, have made them indispensable in maintaining product quality and extending shelf life. The growing demand for convenience and packaged foods, fueled by urban lifestyles and changing dietary habits, has further propelled their adoption in the food sector.

Additionally, regulatory acceptance of diphosphates in food applications and manufacturers’ focus on delivering consistent, safe, and appealing products have reinforced the segment’s prominence and continued growth trajectory.
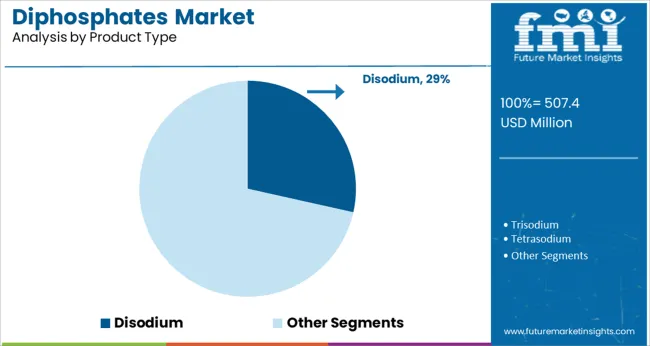
Insights into the Disodium Product Type Segment

Diphosphates Market Analysis By Product Type

When segmented by product type, disodium is forecast to capture 28.5% of the market revenue in 2025, establishing itself as the leading product segment. This leadership is supported by its high solubility, stability, and effectiveness across diverse industrial applications.

In the food sector, disodium diphosphate has been preferred for its ability to improve dough strength, enhance water retention in meat processing, and contribute to uniform texture in baked goods. Its ease of handling, compatibility with other ingredients, and cost effectiveness have further contributed to its widespread use.

Beyond food, its utility in ceramics, water treatment, and cleaning products has also supported demand, demonstrating its versatility and efficiency. The segment’s growth has been reinforced by ongoing process innovations and the ability to meet both functional and regulatory requirements effectively.

Historic Market Outlook for Diphosphates Chemicals

The demand for diphosphates from 2020 to 2025 showed a historical growth rate of less than 4% CAGR. This rise in demand is brought on by the growth of the food industry, beverage industry, cosmetic industry, and other end-use industries.

On the other hand, the global pandemic and Russia-Ukraine War Influence have had a negative impact on all aspects of society and most industries worldwide. This is due to significant disruptions to their respective manufacturing and supply-chain operations caused by various precautionary lockdowns.

The worldwide supply chain disruptions had some impact on the market for diphosphate. FMI's prediction of the demand for diphosphates predicts a CAGR of 4.30% by 2035.

What are the Various Factors Driving Diphosphates Market?

The global diphosphates market is expected to grow due to increased applications in the food, beverage, and cosmetics industries.

Because of its increasing industrial applications, the diphosphate compound is an important component of the food industry. In Australia, diphosphate is widely used to store frozen and unprocessed fish fillets. It can also be used to bulk up baked goods. Some of the food items contain natural sources of similar phosphates, but the amount is generally higher in processed foods, mostly in the form of additives.

Disodium phosphate is a chemical compound that can be found in food and cosmetics. Its purpose is to keep the product's pH balanced. Cosmetics is one of the fastest-growing industries, with consumers in cities of all sizes. The increasing use of technology in providing upgraded cosmetics and skincare products to customers is driving growth, which is expected to generate demand for diphosphate in the forecast period.

Macroeconomic factors such as a change in lifestyle, an increase in per capita income, and the rapid growth in the rate of urbanization also lead to an increase in demand for the diphosphates market.

Which Factors May Hinder the Diphosphate Market Growth?

The major restraint that may impede the growth of the magnesium phosphate market is the scarcity of raw materials required for phosphate production, despite rising demand over the forecast period.

The global market has not received 100% confirmation on the health impact of using diphosphates as food additives. Strict government regulations that prohibit the use of hazardous chemicals as well as an increase in demand for organic products made from natural materials are putting pressure on the market for diphosphate.
What is Regional Analysis of Diphosphate Market Share?

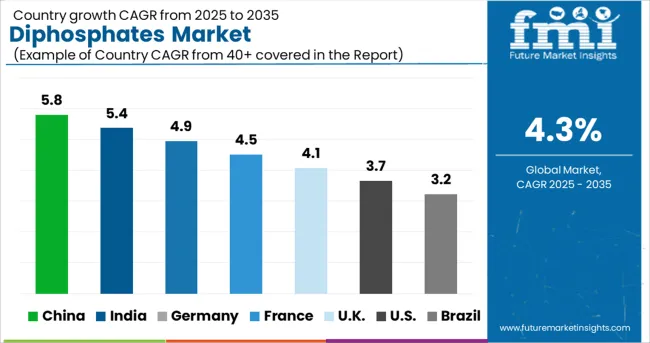
Diphosphates Market Cagr Analysis By Country

The diphosphate market is divided on the basis of regions such as North America, Latin America, Europe, East Asia, the South Asia-Pacific region, the Middle East, and Africa.

An increase in demand for diphosphates in the beverage industry in the Middle East, Africa, and Asia-Pacific regions helps fuel the market for diphosphates in these regions.

It is expected that the North America and Europe regions will hold the maximum market share of diphosphate owing to the high demand from the frozen food and manufacturing industries. The growth in the cosmetic and beverage industries is also expected to boost the overall diphosphate market across the globe.

The Asian market is expected to grow much more swiftly than other regions due to the rapidly growing end-use industries and their products.
Market Competition

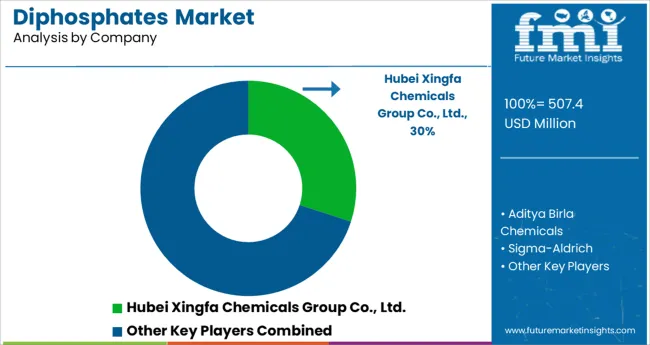
Diphosphates Market Analysis By Company

The prominent key players operating in the diphosphates market include Hubei Xingfa Chemicals Group Co., Ltd.; Aditya Birla Chemicals; Sigma-Aldrich; Trivenichemical; Shandong IRO HEDP Co.; Generichem Corp.; Nexeo Solutions; and Mutchler Inc.

The market is highly consolidated, with the majority of companies investing a large amount of money in detailed research and development to create new and improved products. Furthermore, several key market players in the global diphosphates sector are now more focused on setting up effective joint ventures, acquisitions, and/or collaborations in order to enhance their respective consumer bases.

  • In January 2025, the largest cosmetic brand, L'Oréal, closed a deal to acquire the Japanese company Takami Co., which develops and markets products licensed by the skincare brand Takami, owned by Doctor Hiroshi Takami. L'Oréal also renewed a long-term brand licensing agreement with Doctor Takami and agreed to work with Takami clinics.
  • In March 2025, Nestle Health Science, a business unit of Nestle SA, acquired a majority stake in Orgain, Irvine, Calif., a plant-based nutrition company that produces and markets powders, ready-to-drink beverages, and nutrition bars.

Scope of the Report

Attribute Details
Growth Rate CAGR of 4.30 % from 2025 to 2035
Base Year for Estimation 2025
Historical Data 2020 to 2025
Forecast Period 2025 to 2035
Quantitative Units Revenue in USD Million, Volume in Tons, and CAGR from 2025 to 2035
Report Coverage Revenue Forecast, Volume Forecast, Company Ranking, Competitive Landscape, Growth Factors, Trends, and Pricing Analysis
Segments Covered Application, End-use Industry, Product Type
Regions Covered North America, Latin America, Europe, East Asia, South Asia &, Pacific, Middle East and Africa
Key Countries Covered The USA, Canada, Mexico, Brazil, Germany, The United Kingdom, France, Italy, Spain, Russia, China, Japan, India, GCC Countries, Australia
Key Companies Profiled Hubei Xingfa Chemicals Group Co., Ltd, Aditya Birla Chemicals, Sigma-Aldrich, Trivenichemical, Shandong IRO HEDP Co., Generichem Corp, Nexeo solutions, Mutchler Inc.
Customization &, Pricing Available upon Request

Key Segments Profiled in the Diphosphate Market Report

By Application Type:

  • Bulking agent
  • Emulsifier
  • Thickener
  • Water retaining agent
  • Antioxidant
  • Texture modification
  • Maintain color
  • Acidification

By End Use Industry Type:

  • Food Industry
  • Beverage Industry
  • Cosmetic Industry

By Product Type:

  • Disodium Diphosphates
  • Trisodium Diphosphates
  • Tetrasodium Diphosphates
  • Dipotassium Diphosphates
  • Magnesium dihydrogen Diphosphates
  • Tetrapotassium Diphosphates
  • Dicalcium Diphosphates
  • Calcium dihydrogen Diphosphates
  • Dimagnesium Diphosphates

By Region:

  • North America
  • Latin America
  • Europe
  • South Asia & Pacific
  • East Asia
  • Middle East & Africa

Table of Content

  1. Executive Summary
    • Global Market Outlook
    • Demand to side Trends
    • Supply to side Trends
    • Technology Roadmap Analysis
    • Analysis and Recommendations
  2. Market Overview
    • Market Coverage / Taxonomy
    • Market Definition / Scope / Limitations
  3. Market Background
    • Market Dynamics
      • Drivers
      • Restraints
      • Opportunity
      • Trends
    • Scenario Forecast
      • Demand in Optimistic Scenario
      • Demand in Likely Scenario
      • Demand in Conservative Scenario
    • Opportunity Map Analysis
    • Product Life Cycle Analysis
    • Supply Chain Analysis
    • Investment Feasibility Matrix
    • Value Chain Analysis
    • PESTLE and Porter’s Analysis
    • Regulatory Landscape
    • Regional Parent Market Outlook
    • Production and Consumption Statistics
    • Import and Export Statistics
  4. Global Market Analysis 2020 to 2024 and Forecast, 2025 to 2035
    • Historical Market Size Value (USD Million) Analysis, 2020 to 2024
    • Current and Future Market Size Value (USD Million) Projections, 2025 to 2035
      • Y to o to Y Growth Trend Analysis
      • Absolute $ Opportunity Analysis
  5. Global Market Pricing Analysis 2020 to 2024 and Forecast 2025 to 2035
  6. Global Market Analysis 2020 to 2024 and Forecast 2025 to 2035, By Product Grade
    • Introduction / Key Findings
    • Historical Market Size Value (USD Million) Analysis By Product Grade , 2020 to 2024
    • Current and Future Market Size Value (USD Million) Analysis and Forecast By Product Grade , 2025 to 2035
      • Food-grade
      • Industrial-grade
    • Y to o to Y Growth Trend Analysis By Product Grade , 2020 to 2024
    • Absolute $ Opportunity Analysis By Product Grade , 2025 to 2035
  7. Global Market Analysis 2020 to 2024 and Forecast 2025 to 2035, By Application
    • Introduction / Key Findings
    • Historical Market Size Value (USD Million) Analysis By Application, 2020 to 2024
    • Current and Future Market Size Value (USD Million) Analysis and Forecast By Application, 2025 to 2035
      • Food additives
      • Emulsifiers
      • Free-fat stabilizers
      • Others
    • Y to o to Y Growth Trend Analysis By Application, 2020 to 2024
    • Absolute $ Opportunity Analysis By Application, 2025 to 2035
  8. Global Market Analysis 2020 to 2024 and Forecast 2025 to 2035, By Region
    • Introduction
    • Historical Market Size Value (USD Million) Analysis By Region, 2020 to 2024
    • Current Market Size Value (USD Million) Analysis and Forecast By Region, 2025 to 2035
      • North America
      • Latin America
      • Western Europe
      • Eastern Europe
      • East Asia
      • South Asia and Pacific
      • Middle East & Africa
    • Market Attractiveness Analysis By Region
  9. North America Market Analysis 2020 to 2024 and Forecast 2025 to 2035, By Country
    • Historical Market Size Value (USD Million) Trend Analysis By Market Taxonomy, 2020 to 2024
    • Market Size Value (USD Million) Forecast By Market Taxonomy, 2025 to 2035
      • By Country
        • USA
        • Canada
        • Mexico
      • By Product Grade
      • By Application
    • Market Attractiveness Analysis
      • By Country
      • By Product Grade
      • By Application
    • Key Takeaways
  10. Latin America Market Analysis 2020 to 2024 and Forecast 2025 to 2035, By Country
    • Historical Market Size Value (USD Million) Trend Analysis By Market Taxonomy, 2020 to 2024
    • Market Size Value (USD Million) Forecast By Market Taxonomy, 2025 to 2035
      • By Country
        • Brazil
        • Chile
        • Rest of Latin America
      • By Product Grade
      • By Application
    • Market Attractiveness Analysis
      • By Country
      • By Product Grade
      • By Application
    • Key Takeaways
  11. Western Europe Market Analysis 2020 to 2024 and Forecast 2025 to 2035, By Country
    • Historical Market Size Value (USD Million) Trend Analysis By Market Taxonomy, 2020 to 2024
    • Market Size Value (USD Million) Forecast By Market Taxonomy, 2025 to 2035
      • By Country
        • Germany
        • UK
        • Italy
        • Spain
        • France
        • Nordic
        • BENELUX
        • Rest of Western Europe
      • By Product Grade
      • By Application
    • Market Attractiveness Analysis
      • By Country
      • By Product Grade
      • By Application
    • Key Takeaways
  12. Eastern Europe Market Analysis 2020 to 2024 and Forecast 2025 to 2035, By Country
    • Historical Market Size Value (USD Million) Trend Analysis By Market Taxonomy, 2020 to 2024
    • Market Size Value (USD Million) Forecast By Market Taxonomy, 2025 to 2035
      • By Country
        • Russia
        • Poland
        • Hungary
        • Balkan & Baltic
        • Rest of Eastern Europe
      • By Product Grade
      • By Application
    • Market Attractiveness Analysis
      • By Country
      • By Product Grade
      • By Application
    • Key Takeaways
  13. East Asia Market Analysis 2020 to 2024 and Forecast 2025 to 2035, By Country
    • Historical Market Size Value (USD Million) Trend Analysis By Market Taxonomy, 2020 to 2024
    • Market Size Value (USD Million) Forecast By Market Taxonomy, 2025 to 2035
      • By Country
        • China
        • Japan
        • South Korea
      • By Product Grade
      • By Application
    • Market Attractiveness Analysis
      • By Country
      • By Product Grade
      • By Application
    • Key Takeaways
  14. South Asia and Pacific Market Analysis 2020 to 2024 and Forecast 2025 to 2035, By Country
    • Historical Market Size Value (USD Million) Trend Analysis By Market Taxonomy, 2020 to 2024
    • Market Size Value (USD Million) Forecast By Market Taxonomy, 2025 to 2035
      • By Country
        • India
        • ASEAN
        • Australia & New Zealand
        • Rest of South Asia and Pacific
      • By Product Grade
      • By Application
    • Market Attractiveness Analysis
      • By Country
      • By Product Grade
      • By Application
    • Key Takeaways
  15. Middle East & Africa Market Analysis 2020 to 2024 and Forecast 2025 to 2035, By Country
    • Historical Market Size Value (USD Million) Trend Analysis By Market Taxonomy, 2020 to 2024
    • Market Size Value (USD Million) Forecast By Market Taxonomy, 2025 to 2035
      • By Country
        • Kingdom of Saudi Arabia
        • Other GCC Countries
        • Turkiye
        • South Africa
        • Other African Union
        • Rest of Middle East & Africa
      • By Product Grade
      • By Application
    • Market Attractiveness Analysis
      • By Country
      • By Product Grade
      • By Application
    • Key Takeaways
  16. Key Countries Market Analysis
    • USA
      • Pricing Analysis
      • Market Share Analysis, 2024
        • By Product Grade
        • By Application
    • Canada
      • Pricing Analysis
      • Market Share Analysis, 2024
        • By Product Grade
        • By Application
    • Mexico
      • Pricing Analysis
      • Market Share Analysis, 2024
        • By Product Grade
        • By Application
    • Brazil
      • Pricing Analysis
      • Market Share Analysis, 2024
        • By Product Grade
        • By Application
    • Chile
      • Pricing Analysis
      • Market Share Analysis, 2024
        • By Product Grade
        • By Application
    • Germany
      • Pricing Analysis
      • Market Share Analysis, 2024
        • By Product Grade
        • By Application
    • UK
      • Pricing Analysis
      • Market Share Analysis, 2024
        • By Product Grade
        • By Application
    • Italy
      • Pricing Analysis
      • Market Share Analysis, 2024
        • By Product Grade
        • By Application
    • Spain
      • Pricing Analysis
      • Market Share Analysis, 2024
        • By Product Grade
        • By Application
    • France
      • Pricing Analysis
      • Market Share Analysis, 2024
        • By Product Grade
        • By Application
    • India
      • Pricing Analysis
      • Market Share Analysis, 2024
        • By Product Grade
        • By Application
    • ASEAN
      • Pricing Analysis
      • Market Share Analysis, 2024
        • By Product Grade
        • By Application
    • Australia & New Zealand
      • Pricing Analysis
      • Market Share Analysis, 2024
        • By Product Grade
        • By Application
    • China
      • Pricing Analysis
      • Market Share Analysis, 2024
        • By Product Grade
        • By Application
    • Japan
      • Pricing Analysis
      • Market Share Analysis, 2024
        • By Product Grade
        • By Application
    • South Korea
      • Pricing Analysis
      • Market Share Analysis, 2024
        • By Product Grade
        • By Application
    • Russia
      • Pricing Analysis
      • Market Share Analysis, 2024
        • By Product Grade
        • By Application
    • Poland
      • Pricing Analysis
      • Market Share Analysis, 2024
        • By Product Grade
        • By Application
    • Hungary
      • Pricing Analysis
      • Market Share Analysis, 2024
        • By Product Grade
        • By Application
    • Kingdom of Saudi Arabia
      • Pricing Analysis
      • Market Share Analysis, 2024
        • By Product Grade
        • By Application
    • Turkiye
      • Pricing Analysis
      • Market Share Analysis, 2024
        • By Product Grade
        • By Application
    • South Africa
      • Pricing Analysis
      • Market Share Analysis, 2024
        • By Product Grade
        • By Application
  17. Market Structure Analysis
    • Competition Dashboard
    • Competition Benchmarking
    • Market Share Analysis of Top Players
      • By Regional
      • By Product Grade
      • By Application
  18. Competition Analysis
    • Competition Deep Dive
      • FrieslandCampina Ingredients
        • Overview
        • Product Portfolio
        • Profitability by Market Segments (Product/Age /Sales Channel/Region)
        • Sales Footprint
        • Strategy Overview
          • Marketing Strategy
          • Product Strategy
          • Channel Strategy
      • Arla Foods Ingredients
      • Kerry Group
      • Fonterra Co-operative Group
      • AMCO Proteins
      • Charotar Casein Company
      • Dairygold Co-Operative Society
      • Farbest Brands
      • Tatua Cooperative Dairy Company
      • Westland Milk Products
  19. Assumptions & Acronyms Used
  20. Research Methodology

List of Tables

  • Table 1: Global Market Value (USD Million) Forecast by Region, 2020 to 2035
  • Table 2: Global Market Value (USD Million) Forecast by Product Grade , 2020 to 2035
  • Table 3: Global Market Value (USD Million) Forecast by Application, 2020 to 2035
  • Table 4: North America Market Value (USD Million) Forecast by Country, 2020 to 2035
  • Table 5: North America Market Value (USD Million) Forecast by Product Grade , 2020 to 2035
  • Table 6: North America Market Value (USD Million) Forecast by Application, 2020 to 2035
  • Table 7: Latin America Market Value (USD Million) Forecast by Country, 2020 to 2035
  • Table 8: Latin America Market Value (USD Million) Forecast by Product Grade , 2020 to 2035
  • Table 9: Latin America Market Value (USD Million) Forecast by Application, 2020 to 2035
  • Table 10: Western Europe Market Value (USD Million) Forecast by Country, 2020 to 2035
  • Table 11: Western Europe Market Value (USD Million) Forecast by Product Grade , 2020 to 2035
  • Table 12: Western Europe Market Value (USD Million) Forecast by Application, 2020 to 2035
  • Table 13: Eastern Europe Market Value (USD Million) Forecast by Country, 2020 to 2035
  • Table 14: Eastern Europe Market Value (USD Million) Forecast by Product Grade , 2020 to 2035
  • Table 15: Eastern Europe Market Value (USD Million) Forecast by Application, 2020 to 2035
  • Table 16: East Asia Market Value (USD Million) Forecast by Country, 2020 to 2035
  • Table 17: East Asia Market Value (USD Million) Forecast by Product Grade , 2020 to 2035
  • Table 18: East Asia Market Value (USD Million) Forecast by Application, 2020 to 2035
  • Table 19: South Asia and Pacific Market Value (USD Million) Forecast by Country, 2020 to 2035
  • Table 20: South Asia and Pacific Market Value (USD Million) Forecast by Product Grade , 2020 to 2035
  • Table 21: South Asia and Pacific Market Value (USD Million) Forecast by Application, 2020 to 2035
  • Table 22: Middle East & Africa Market Value (USD Million) Forecast by Country, 2020 to 2035
  • Table 23: Middle East & Africa Market Value (USD Million) Forecast by Product Grade , 2020 to 2035
  • Table 24: Middle East & Africa Market Value (USD Million) Forecast by Application, 2020 to 2035

List of Figures

  • Figure 1: Global Market Pricing Analysis
  • Figure 2: Global Market Value (USD Million) Forecast 2020-2035
  • Figure 3: Global Market Value Share and BPS Analysis by Product Grade , 2025 and 2035
  • Figure 4: Global Market Y to o to Y Growth Comparison by Product Grade , 2025-2035
  • Figure 5: Global Market Attractiveness Analysis by Product Grade
  • Figure 6: Global Market Value Share and BPS Analysis by Application, 2025 and 2035
  • Figure 7: Global Market Y to o to Y Growth Comparison by Application, 2025-2035
  • Figure 8: Global Market Attractiveness Analysis by Application
  • Figure 9: Global Market Value (USD Million) Share and BPS Analysis by Region, 2025 and 2035
  • Figure 10: Global Market Y to o to Y Growth Comparison by Region, 2025-2035
  • Figure 11: Global Market Attractiveness Analysis by Region
  • Figure 12: North America Market Incremental Dollar Opportunity, 2025-2035
  • Figure 13: Latin America Market Incremental Dollar Opportunity, 2025-2035
  • Figure 14: Western Europe Market Incremental Dollar Opportunity, 2025-2035
  • Figure 15: Eastern Europe Market Incremental Dollar Opportunity, 2025-2035
  • Figure 16: East Asia Market Incremental Dollar Opportunity, 2025-2035
  • Figure 17: South Asia and Pacific Market Incremental Dollar Opportunity, 2025-2035
  • Figure 18: Middle East & Africa Market Incremental Dollar Opportunity, 2025-2035
  • Figure 19: North America Market Value Share and BPS Analysis by Country, 2025 and 2035
  • Figure 20: North America Market Value Share and BPS Analysis by Product Grade , 2025 and 2035
  • Figure 21: North America Market Y to o to Y Growth Comparison by Product Grade , 2025-2035
  • Figure 22: North America Market Attractiveness Analysis by Product Grade
  • Figure 23: North America Market Value Share and BPS Analysis by Application, 2025 and 2035
  • Figure 24: North America Market Y to o to Y Growth Comparison by Application, 2025-2035
  • Figure 25: North America Market Attractiveness Analysis by Application
  • Figure 26: Latin America Market Value Share and BPS Analysis by Country, 2025 and 2035
  • Figure 27: Latin America Market Value Share and BPS Analysis by Product Grade , 2025 and 2035
  • Figure 28: Latin America Market Y to o to Y Growth Comparison by Product Grade , 2025-2035
  • Figure 29: Latin America Market Attractiveness Analysis by Product Grade
  • Figure 30: Latin America Market Value Share and BPS Analysis by Application, 2025 and 2035
  • Figure 31: Latin America Market Y to o to Y Growth Comparison by Application, 2025-2035
  • Figure 32: Latin America Market Attractiveness Analysis by Application
  • Figure 33: Western Europe Market Value Share and BPS Analysis by Country, 2025 and 2035
  • Figure 34: Western Europe Market Value Share and BPS Analysis by Product Grade , 2025 and 2035
  • Figure 35: Western Europe Market Y to o to Y Growth Comparison by Product Grade , 2025-2035
  • Figure 36: Western Europe Market Attractiveness Analysis by Product Grade
  • Figure 37: Western Europe Market Value Share and BPS Analysis by Application, 2025 and 2035
  • Figure 38: Western Europe Market Y to o to Y Growth Comparison by Application, 2025-2035
  • Figure 39: Western Europe Market Attractiveness Analysis by Application
  • Figure 40: Eastern Europe Market Value Share and BPS Analysis by Country, 2025 and 2035
  • Figure 41: Eastern Europe Market Value Share and BPS Analysis by Product Grade , 2025 and 2035
  • Figure 42: Eastern Europe Market Y to o to Y Growth Comparison by Product Grade , 2025-2035
  • Figure 43: Eastern Europe Market Attractiveness Analysis by Product Grade
  • Figure 44: Eastern Europe Market Value Share and BPS Analysis by Application, 2025 and 2035
  • Figure 45: Eastern Europe Market Y to o to Y Growth Comparison by Application, 2025-2035
  • Figure 46: Eastern Europe Market Attractiveness Analysis by Application
  • Figure 47: East Asia Market Value Share and BPS Analysis by Country, 2025 and 2035
  • Figure 48: East Asia Market Value Share and BPS Analysis by Product Grade , 2025 and 2035
  • Figure 49: East Asia Market Y to o to Y Growth Comparison by Product Grade , 2025-2035
  • Figure 50: East Asia Market Attractiveness Analysis by Product Grade
  • Figure 51: East Asia Market Value Share and BPS Analysis by Application, 2025 and 2035
  • Figure 52: East Asia Market Y to o to Y Growth Comparison by Application, 2025-2035
  • Figure 53: East Asia Market Attractiveness Analysis by Application
  • Figure 54: South Asia and Pacific Market Value Share and BPS Analysis by Country, 2025 and 2035
  • Figure 55: South Asia and Pacific Market Value Share and BPS Analysis by Product Grade , 2025 and 2035
  • Figure 56: South Asia and Pacific Market Y to o to Y Growth Comparison by Product Grade , 2025-2035
  • Figure 57: South Asia and Pacific Market Attractiveness Analysis by Product Grade
  • Figure 58: South Asia and Pacific Market Value Share and BPS Analysis by Application, 2025 and 2035
  • Figure 59: South Asia and Pacific Market Y to o to Y Growth Comparison by Application, 2025-2035
  • Figure 60: South Asia and Pacific Market Attractiveness Analysis by Application
  • Figure 61: Middle East & Africa Market Value Share and BPS Analysis by Country, 2025 and 2035
  • Figure 62: Middle East & Africa Market Value Share and BPS Analysis by Product Grade , 2025 and 2035
  • Figure 63: Middle East & Africa Market Y to o to Y Growth Comparison by Product Grade , 2025-2035
  • Figure 64: Middle East & Africa Market Attractiveness Analysis by Product Grade
  • Figure 65: Middle East & Africa Market Value Share and BPS Analysis by Application, 2025 and 2035
  • Figure 66: Middle East & Africa Market Y to o to Y Growth Comparison by Application, 2025-2035
  • Figure 67: Middle East & Africa Market Attractiveness Analysis by Application
  • Figure 68: Global Market - Tier Structure Analysis
  • Figure 69: Global Market - Company Share Analysis

Frequently Asked Questions

How big is the diphosphates market in 2025?

The global diphosphates market is estimated to be valued at USD 507.4 million in 2025.

What will be the market size for the diphosphates market in 2035?

It is projected to reach USD 773.0 million by 2035.

How much will be the CAGR of the diphosphates market between 2025 and 2035?

The market is expected to grow at a 4.3% CAGR between 2025 and 2035.

What are the key product types in the diphosphates market?

The key product types are emulsifier, bulking agent, thickener, water retaining agent, antioxidant, texture modification, maintain color and acidification.

Which food industry segment is expected to dominate the diphosphates market in 2025?

food industry segment is expected to dominate with a 42.0% industry share in 2025.

Future Market Insights

Diphosphates Market

Chat With MaRIA

Chat With

MaRIA

Hi There, I am MaRIA, Your Market Research Intelligence Assistant. How may I help you?