The E-gasoline market is estimated to be valued at USD 1.6 billion in 2025. It is projected to reach USD 26.1 billion by 2035, registering a compound annual growth rate (CAGR) of 32.3% over the forecast period. The e-gasoline market sees a multiplying factor of approximately 12.3x over the forecast period. The absolute dollar opportunity across these ten years amounts to USD 18.1 billion. Growth accelerates in both relative and absolute terms, with annual additions rising from USD 0.5 billion between 2025 and 2026 to USD 4.8 billion between 2034 and 2035. This sharply widening spread indicates that most of the total value will be captured in the latter half of the decade.
Between 2025 and 2030, the market adds USD 4.8 billion, while from 2031 to 2035, it gains an additional USD 13.3 billion. This split confirms that over 70% of the absolute opportunity lies in the final five years, driven by regulatory support for low-carbon fuels, rising cost-competitiveness of synthetic gasoline, and commercial-scale plant deployments. The 12.3x multiplying factor reflects not just high demand but also capacity unlocking, particularly for sectors with limited alternatives to liquid fuels. These include aviation, shipping, and heavy-duty vehicles. This compounding growth profile presents clear value capture points for investors, technology providers, and fuel distributors focused on late-decade entry and scale-up.
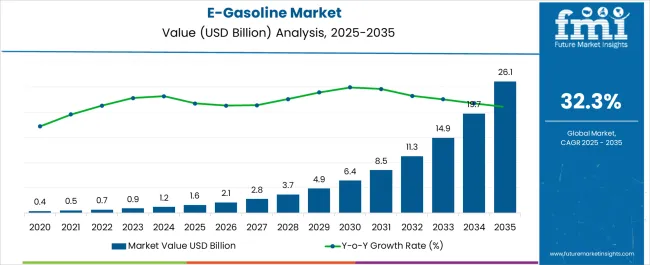
| Metric | Value |
|---|---|
| E-Gasoline Market Estimated Value in (2025E) | USD 1.6 billion |
| E-Gasoline Market Forecast Value in (2035F) | USD 26.1 billion |
| Forecast CAGR (2025 to 2035) | 32.3% |
The e-gasoline market channels approximately 34% of demand through automotive transport fuels, where synthetic gasoline serves as a drop-in fuel for existing combustion engine vehicles. Around 21% of the market is linked to marine shipping, where tighter emissions rules prompt the use of low-carbon alternatives.
Aviation accounts for roughly 12%, with e-gasoline used in blending or experimental routes toward carbon-neutral flight. Industrial energy and power systems absorb close to 20%, often integrating e-gasoline in machinery or backup generators. The remaining 13% is tied to the renewable fuel infrastructure segment, covering production, storage, and distribution platforms built around green hydrogen and carbon capture systems.
The e-gasoline market is gaining momentum as transportation sectors seek a sustainable alternative to fuel for existing engines. Leading innovators include Arcadia eFuels, ExxonMobil, LanzaJet, Climeworks, and Ineratec. These companies invest in synthetic fuel plants combining renewable hydrogen and captured CO₂, leveraging Fischer-Tropsch synthesis and advanced catalysis. Key trends include strategic partnerships between automakers and energy firms, government incentives under clean fuel programmes, and pilot projects producing e-gasoline in regions like Europe, Asia and Latin America. Production cost reduction and scalable modular refinery designs are essential to wider adoption. Emission regulations, climate awareness and limited electrification in marine and legacy vehicle fleets drive growth.
The E-gasoline market is experiencing a strong upward trajectory, driven by the global shift toward low-emission fuels and the decarbonization of the transportation sector. Increasing regulatory pressure to reduce greenhouse gas emissions and the introduction of net-zero mandates by major economies are creating favorable conditions for synthetic fuel adoption. The market is benefiting from technological advances that have improved the scalability and efficiency of renewable energy integration in fuel synthesis.
Electrolyzer and carbon capture technologies are being increasingly deployed, allowing for sustainable feedstock generation from atmospheric CO₂ and water. Government-backed investments and partnerships with energy companies are accelerating commercialization and helping bridge the gap between pilot and industrial-scale production.
Furthermore, the compatibility of e-gasoline with existing internal combustion engines has positioned it as a viable transitional solution in the path toward full electrification. As global energy strategies emphasize fuel diversification and supply resilience, the market for e-gasoline is anticipated to witness significant expansion across both developed and emerging economies..
The e-gasoline market is segmented by renewable source, technology, application and geographic regions. The renewable source of the e-gasoline market is divided into On-site solar and Wind. In terms of technology, the e-gasoline market is classified into Fischer-Tropsch, eRWGS, and Others. Based on application of the e gasoline market is segmented into Automotive, Marine, Aviation, Industrial, and Others. Regionally, the e-gasoline industry is classified into North America, Latin America, Western Europe, Eastern Europe, Balkan & Baltic Countries, Russia & Belarus, Central Asia, East Asia, South Asia & Pacific, and the Middle East & Africa.
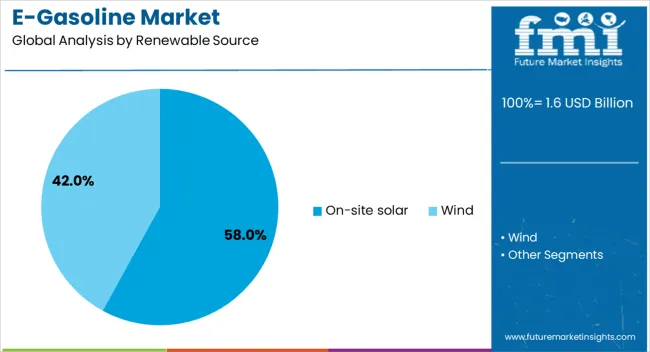
The on-site solar subsegment within the renewable source segment is projected to account for 58% of the E Gasoline market revenue share in 2025, making it the leading contributor. Growth in this subsegment has been primarily driven by the availability of low-cost solar technologies and the increasing demand for decentralized, carbon-neutral energy inputs in fuel production. On-site solar infrastructure has enabled localized hydrogen generation through water electrolysis, allowing for more controlled and efficient integration into synthetic fuel synthesis.
This approach has minimized energy transmission losses and reduced dependency on external grids, improving the overall sustainability and economics of e-gasoline production. Adoption of on-site solar has also been supported by declining photovoltaic system costs and incentives for self-generation, particularly in regions with high solar irradiation.
In addition, real-time energy balancing enabled by smart grid interfaces has made it feasible to align fuel production cycles with peak solar output, improving conversion efficiency. These advantages have collectively positioned on-site solar as the most preferred renewable source in this market..
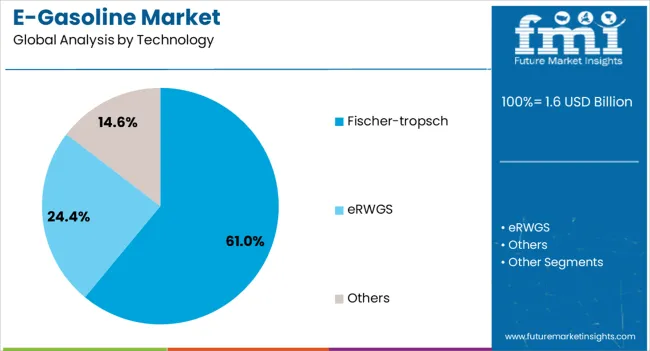
The Fischer Tropsch subsegment within the technology segment is expected to capture 61% of the e-gasoline market revenue share in 2025, emerging as the dominant pathway. This technology has been widely adopted due to its proven capability to convert syngas into high-quality liquid hydrocarbons that meet existing fuel standards. Its compatibility with various feedstocks, including hydrogen and captured carbon dioxide, has enhanced its suitability for use in e-gasoline synthesis.
The controlled chain-length formation enabled by Fischer-Tropsch synthesis allows for precise tailoring of fuel characteristics, which is essential for meeting performance and emission standards. As synthetic fuel developers focus on scalability, this technology has been favored for its industrial readiness and long-standing use in similar applications.
Integration of renewable hydrogen and direct air capture with Fischer-Tropsch reactors has further improved the carbon neutrality of the process. Its operational flexibility and ability to produce drop-in fuels without requiring modifications to vehicle engines or infrastructure have made it the leading choice in the market..
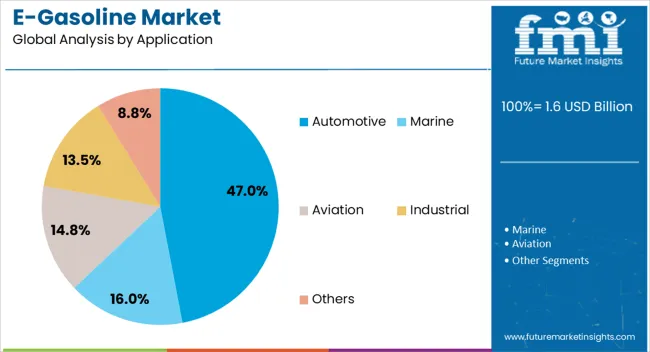
The automotive subsegment within the application segment is anticipated to hold 47% of the e-gasoline market revenue share in 2025, signifying its leading position. Growth in this segment has been driven by increasing efforts to decarbonize road transport while maintaining compatibility with existing vehicle fleets. E-gasoline offers a seamless replacement for conventional gasoline, eliminating the need for changes in engine architecture or fuel distribution networks.
This advantage has made it particularly attractive for governments and industries seeking near-term emission reductions without extensive capital investment. The segment’s expansion has also been fueled by regulatory targets that encourage the use of low-carbon fuels in transportation, especially for light-duty vehicles.
The continued presence of internal combustion engine vehicles in global markets, particularly in regions with limited electric vehicle infrastructure, has sustained demand for synthetic alternatives. The automotive sector has actively explored e-gasoline as a strategic component of hybrid transition models, reinforcing its commercial viability and supporting its dominant share within the market..
Growth in the E-Gasoline market has been fueled by rising regulatory adoption of ethanol-blending mandates and support from domestic biofuel supply chains. Ethanol blends are now integrated into a large portion of national fuel inventories, particularly in countries with active decarbonization goals. Flex-fuel vehicles and fuel infrastructure upgrades have been critical enablers.
National mandates requiring 10% to 20% ethanol blending in transport fuel have become a key force behind market expansion. These policies have created direct demand pull from refineries and fuel station operators, who are increasingly investing in E-Gasoline-compatible systems. Fleet-wide compliance for flex-fuel vehicles is being pursued in multiple countries, with automakers reporting rising demand from both public and private transport operators. In agricultural economies, domestic ethanol production has been synchronized with seasonal grain surplus to ensure an uninterrupted supply. Fuel marketers are incentivizing end-users through cleaner fuel promotions and bundling loyalty-based rebates on blended fuel options.
E-gasoline uptake remains restricted in regions where older internal combustion engines dominate or where pipeline and dispenser infrastructure has not been retrofitted. Ethanol’s hygroscopic nature increases storage and transportation challenges, especially in humid or variable climates. Cold start difficulties and reduced fuel efficiency with higher ethanol blends have discouraged adoption among commercial vehicle operators. Capital costs for stainless-steel compliant storage systems and distribution lines have discouraged independent station operators from converting to e-gas dispensing. Moreover, fleet operators still voice concerns over engine maintenance intervals when using mid-to-high ethanol blends without modification.
Significant headroom exists in expanding beyond E10 blends, particularly in countries where regulatory frameworks are advancing toward E20 and E85 as default standards. Dedicated ethanol pipelines and blending depots are being set up within agro-industrial zones, allowing for efficient ethanol transfer to regional terminals. Intermodal ethanol transport solutions using flexitanks and rail tankers are reducing last-mile delivery costs. With urban transport systems adopting biofuel-compatible buses and hybrid fleets, demand for higher ethanol concentrations is being redirected toward mass transit hubs. Fuel brands are now exploring co-branded E-Gasoline pumps that target carbon-conscious drivers, pairing higher blend offers with digital incentives.
Technological developments in fuel labeling, quality tracking, and engine additive formulation are enhancing the usability and appeal of E-Gasoline. Real-time ethanol concentration data and QR-based product verification are being introduced at dispenser terminals. Fuel additives are being optimized to counteract ethanol’s water absorption and volatility traits, improving shelf life and engine compatibility. In urban markets, E-Gasoline is being positioned as a complementary solution to electrification, especially for hybrid vehicle segments and delivery fleets not yet viable for full electric transition. Retail chains are experimenting with variable ethanol blends based on regional climate profiles, allowing for seasonal optimization in performance.
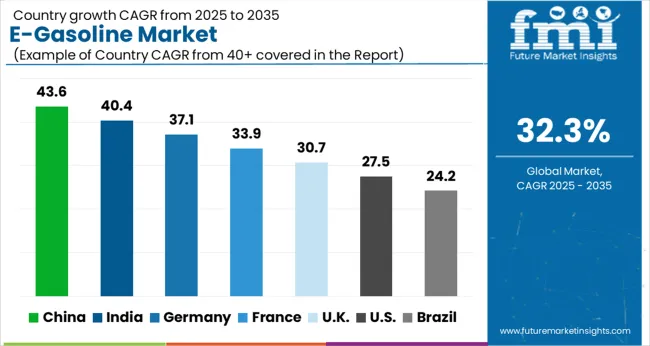
| Country | CAGR |
|---|---|
| China | 43.6% |
| India | 40.4% |
| Germany | 37.1% |
| France | 33.9% |
| UK | 30.7% |
| USA | 27.5% |
| Brazil | 24.2% |
The E-gasoline market is expanding globally at a CAGR of 32.3% between 2025 and 2035. China is advancing well ahead of this pace, reaching 43.6%, backed by intensified synthetic fuel trials and broader energy diversification policies. India follows with 40.4%, showing a 25% uplift above the global average, reflecting aggressive ethanol blending mandates and investment in bio-based alternatives. Germany grows at 37.1%, underscoring active industrial partnerships and EU-aligned carbon reduction goals. The UK, at 30.7%, stays close to the global average, supported by transport fuel reform and clean mobility programs. The US trails at 27.5%, slowed by policy fragmentation and infrastructure gaps. This report includes granular insights from over 40 countries, highlighting the top five here as reference.
China led the global E-gasoline market in 2025 with a 43.6% share. Local refinery-electrolyzer hybrid facilities were prioritized in Shandong and Inner Mongolia. Integration of carbon capture units with synthetic methanol plants fueled the scaling of e-gasoline, particularly for the aviation and off-road vehicle sectors. Strategic partnerships between Sinopec, Envision Energy, and Huaneng advanced commercial-scale power-to-liquid projects. Policy incentives under the national dual-carbon targets accelerated pilot-scale conversion plants using captured CO₂ and green hydrogen.
India captured a 40.4% share in the e-gasoline market in 2025, with investments aimed at displacing fossil-based gasoline in railways and industrial mobility. Government-funded hydrogen hubs in Gujarat and Tamil Nadu facilitated methanol-to-gasoline (MTG) pilot plants. Companies such as Indian Oil Corporation and ReNew Power explored decentralised CO₂ electrolysis technologies to produce drop-in fuels. Demand was strongest from logistics operators, particularly those using synthetic fuels in internal combustion engine retrofits.
Germany held a 37.1% share in 2025, driven by high energy transition targets in the mobility sector. Demand was led by aviation-grade e-gasoline trials approved for Lufthansa and cargo aviation firms. The market was supported by Audi’s e-fuel pilot unit in Lower Saxony and Siemens Energy’s electrolyzer deployment in Hürth. Green hydrogen-derived synthetic fuel was integrated into conventional refining operations at a limited scale. Regulatory support from the Federal Ministry for Economic Affairs and Climate Action remained active through 2025.
The United Kingdom had a 30.7% share in 2025, with a concentrated push to decarbonize short-haul maritime and remote community transport systems. Scotland and Wales hosted early-stage synthetic fuel trials under marine pilot programs. Ceres Power and Johnson Matthey collaborated on solid oxide electrolysis cell (SOEC) integration into refineries for cost-effective synthetic fuel output. Demand from high-utility sectors like fisheries and island transport operators shaped the technology landscape for blended fuel deployment.
The United States had a 27.5% share in 2025, with an export-oriented strategy for e-gasoline development across Texas, North Dakota, and California. Clean fuel credits and the Inflation Reduction Act (IRA) subsidies strengthened upstream investment in CO₂ electrolysis and Fischer-Tropsch synthesis. ExxonMobil and NRG Energy spearheaded feasibility studies on power-to-liquid projects targeting both domestic aviation and export to Japan and Germany. Interest grew from utilities investing in decarbonizing backup fuel systems.
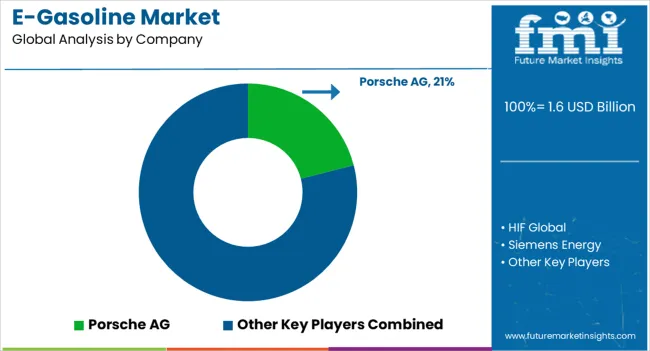
The e-gasoline market includes companies involved in synthetic fuel production using renewable hydrogen and captured CO₂, with a focus on compatibility with internal combustion engines and existing fuel infrastructure. Porsche AG, in collaboration with HIF Global, has invested in pilot production facilities in Chile, aiming to commercialize e-fuels for motorsports and premium automotive segments. HIF Global manages large-scale synthetic fuel projects using wind-powered electrolysis and direct air capture for CO₂, producing drop-in fuels for export and domestic consumption.
Siemens Energy supplies electrolyzer units and process integration technologies essential for e-gasoline synthesis, focusing on improving system efficiency and scalability. ExxonMobil has conducted R&D on synthetic fuel pathways, with pilot programs evaluating carbon-neutral gasoline derived from industrial CO₂ sources. Carbon Recycling International supports the market through its CO₂-to-methanol technology platform, which can be extended toward hydrocarbon synthesis for e-gasoline blending. Other contributors include energy startups and chemical companies developing Fischer-Tropsch and methanol-to-gasoline processes. Key considerations include carbon intensity reduction, feedstock accessibility, cost per liter, and regulatory alignment with clean fuel mandates.
Between 2023 and 2025, the e‑gasoline market matured through strategic industry moves, policy enhancements, and growing infrastructure support. Major energy firms began constructing pilot production facilities focused on synthetic fuel synthesis using renewable electricity, carbon capture, and modular process units.
Governments in Europe and the USA introduced subsidies and clean‑fuel credits to spur adoption, while partnerships between automakers and fuel producers emerged to align vehicle compatibility with synthetic blends.
Temporary approvals for mid‑level ethanol blends like E15 in the USA facilitated broader fuel choice during peak seasons. In Brazil and parts of Asia, ethanol‑gasoline blends became increasingly common, supported by national biofuel policies that promote local production and reduce fossil dependence. E‑gasoline is gaining credibility as a drop‑in option in existing internal combustion fleets.
| Item | Value |
|---|---|
| Quantitative Units | USD 1.6 Billion |
| Renewable Source | On-site solar and Wind |
| Technology | Fischer-tropsch, eRWGS, and Others |
| Application | Automotive, Marine, Aviation, Industrial, and Others |
| Regions Covered | North America, Europe, Asia-Pacific, Latin America, Middle East & Africa |
| Country Covered | United States, Canada, Germany, France, United Kingdom, China, Japan, India, Brazil, South Africa |
| Key Companies Profiled | Porsche AG, HIF Global, Siemens Energy, ExxonMobil, Carbon Recycling Intl., and Others |
| Additional Attributes | Dollar sales by fuel type (E5, E10, E15 gasoline blends) and application (passenger cars, two/four‑wheelers, industrial engines), demand from fleet electrification transition and emission norms, led by Asia‑Pacific with North America catching up, innovation in flex‑fuel engines and blend‑optimized combustion. |
The global e gasoline market is estimated to be valued at USD 1.6 billion in 2025.
The market size for the e gasoline market is projected to reach USD 26.1 billion by 2035.
The e gasoline market is expected to grow at a 32.3% CAGR between 2025 and 2035.
The key product types in e gasoline market are on-site solar and wind.
In terms of technology, fischer-tropsch segment to command 61.0% share in the e gasoline market in 2025.


Our Research Products

The "Full Research Suite" delivers actionable market intel, deep dives on markets or technologies, so clients act faster, cut risk, and unlock growth.

The Leaderboard benchmarks and ranks top vendors, classifying them as Established Leaders, Leading Challengers, or Disruptors & Challengers.

Locates where complements amplify value and substitutes erode it, forecasting net impact by horizon

We deliver granular, decision-grade intel: market sizing, 5-year forecasts, pricing, adoption, usage, revenue, and operational KPIs—plus competitor tracking, regulation, and value chains—across 60 countries broadly.

Spot the shifts before they hit your P&L. We track inflection points, adoption curves, pricing moves, and ecosystem plays to show where demand is heading, why it is changing, and what to do next across high-growth markets and disruptive tech

Real-time reads of user behavior. We track shifting priorities, perceptions of today’s and next-gen services, and provider experience, then pace how fast tech moves from trial to adoption, blending buyer, consumer, and channel inputs with social signals (#WhySwitch, #UX).

Partner with our analyst team to build a custom report designed around your business priorities. From analysing market trends to assessing competitors or crafting bespoke datasets, we tailor insights to your needs.
Supplier Intelligence
Discovery & Profiling
Capacity & Footprint
Performance & Risk
Compliance & Governance
Commercial Readiness
Who Supplies Whom
Scorecards & Shortlists
Playbooks & Docs
Category Intelligence
Definition & Scope
Demand & Use Cases
Cost Drivers
Market Structure
Supply Chain Map
Trade & Policy
Operating Norms
Deliverables
Buyer Intelligence
Account Basics
Spend & Scope
Procurement Model
Vendor Requirements
Terms & Policies
Entry Strategy
Pain Points & Triggers
Outputs
Pricing Analysis
Benchmarks
Trends
Should-Cost
Indexation
Landed Cost
Commercial Terms
Deliverables
Brand Analysis
Positioning & Value Prop
Share & Presence
Customer Evidence
Go-to-Market
Digital & Reputation
Compliance & Trust
KPIs & Gaps
Outputs
Full Research Suite comprises of:
Market outlook & trends analysis
Interviews & case studies
Strategic recommendations
Vendor profiles & capabilities analysis
5-year forecasts
8 regions and 60+ country-level data splits
Market segment data splits
12 months of continuous data updates
DELIVERED AS:
PDF EXCEL ONLINE

Thank you!
You will receive an email from our Business Development Manager. Please be sure to check your SPAM/JUNK folder too.
Chat With
MaRIA