Reports

- Global Locations -

Headquarters

Future Market Insights, Inc.

Christiana Corporate, 200
Continental Drive, Suite 401,
Newark, Delaware - 19713,
United States

T: +1-845-579-5705

Americas

Future Market Insights, Inc.

616 Corporate Way, Suite 2-9018,
Valley Cottage, NY 10989, United States

T: +1-347-918-3531

MEA

Future Market Insights

1602-6 Jumeirah Bay X2 Tower, Plot No: JLT-PH2-X2A,
Jumeirah Lakes Towers, Dubai,
United Arab Emirates

Europe

Future Market Insights

3rd Floor, 207 Regent Street,
W1B 3HH London
United Kingdom

T: + 44 (0) 20 8123 9659
D: +44 (0) 20 3287 4268

Asia Pacific

Future Market Insights

IndiaLand Global Tech Park, Unit UG-1, Behind Grand HighStreet, Phase 1, Hinjawadi, MH, Pune – 411057, India

Eosinophilic Esophagitis Market Snapshot (2023 to 2033)

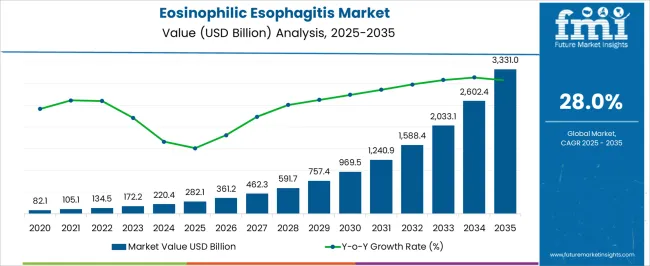
The global eosinophilic esophagitis market is expected to reach at US$ 172.2 Billion in 2023 and is projected to exhibit a CAGR of 28% from 2022 to 2032. Over the forecast period, the market is projected to grow at a rapid rate due to factors such as increased awareness programs for disorders associated with Eosinophils. A new generation of non-invasive diagnostic tools is emerging. A minimally invasive method for diagnosing EoE and assessing disease activity has been proposed due to the invasive nature of repetitive endoscopic evaluation with multiple biopsies.

The worldwide EoE market is growing rapidly due to the increasing use of eosinophilic esophagitis drugs and therapies for the treatment of numerous inflammations in developed nations. For instance, European officials recently approved a budesonide effervescent tablet formulated especially for EoE, which optimizes mucosal deposition.

Women and men can both be affected by EoE, but men in their 30s and 40s are most likely to be affected. According to current estimates, one in 2000 Americans suffer from EoE, and there is evidence to suggest that the number is on the rise. There has been an upward trend in the number of new cases of EoE globally over the last few decades, especially since the early 2000s, in a review of over 30 European and North American studies.

For instance, the FDA has approved dupilumab, the first therapy specifically for EoE. Two parallel-group, randomized, double-blind, multicenter, placebo-controlled, randomized evaluations of safety and efficacy were conducted with approval from the FDA during the study.

Data Points Key Statistics
Estimated Base Year Value (2022) US$ 140 Billion
Expected Market Value (2023) US$ 172.21 Billion
Anticipated Forecast Value (2033) US$ 2,032.8 Billion
Projected Growth Rate (2023 to 2033) 28% CAGR

Don't pay for what you don't need

Customize your report by selecting specific countries or regions and save 30%!

2018 to 2022 Eosinophilic Esophagitis Demand Analysis vs. Forecast 2023 to 2033

The global demand for eosinophilic esophagitis is projected to increase at a CAGR of 28% during the forecast period between 2023 and 2033, reaching a total of US$ 2,032.8 Billion in 2033, according to a report from Future Market Insights (FMI). From 2018 to 2022, sales witnessed significant growth, registering a CAGR of 23%.

In the past decade, advances in EoE diagnosis have included endoscopic functional lumen imaging probes (FLIP), transnasal endoscopy (TNE), and noninvasive test methods such as mucosal impedance probes, EoE cytosponge, and esophageal string tests. There has not been clinical evidence to support biomarkers for EoE. EoE continues to evolve with the development of new diagnostic algorithms, treatment modalities, and noninvasive diagnostic methods. In order to manage EoE patients effectively, multimodal and multidisciplinary approaches are still required.?

Increasing public-private subsidies are expected for target investigation activities, the demand for minimally invasive surgery will increase, the number of children participating in sports will increase, and as technology advances throughout the world, new product inventions and developments will increase the profits for market players. As the internet diffusion rate increases, arthroscopic surgeries are increasingly implemented, and the elderly and obese population are growing throughout the world, the market is expected to expand at a higher rate in future years.

What are the Major Drivers of the Eosinophilic Esophagitis Market?

Extensive Uptake during the Pandemic Crisis for Developing Drugs provided a Major Boost in past years

Increasing awareness of EoE and conditions are expected to grow the market in the near future. In order to spread awareness of eosinophil-associated complaints, numerous awareness plans have been developed and implemented, which are predicted to drive market growth over the forecast period. As a non-profit organization, the American Enterprise for Eosinophilic Disorders (APFED) educates, hovers consciousness, supports, and advocates for patients and families dealing with eosinophil-associated conditions.?

Increasing funding for Research and Development programs and the development of new treatments for EoE is expected to further drive the market's growth in the future. As new technologies and drug delivery methods are developed in the coming years, it is expected that the market will continue to grow in the future. EGD requires invasive procedures for monitoring and diagnosis, so offices are seeking minimally invasive tests and noninvasive biomarkers.

Numerous New Initiatives Offer Lucrative Opportunities to Treat Eosinophilic Esophagitis

Market players are also taking strategic initiatives to develop products for eosinophilic esophagitis and market them effectively. As well, several new drugs are being developed for the treatment of inflammatory conditions of the esophagus. For example, Jorveza (budesonide), a medicine for treating eosinophilic oesophagitis, a condition affecting the esophagus, was recommended for marketing authorization by the European Medicines Agency (EMA).

Similarly, in December 2022, a professor of medicine at the University of Toronto who heads the Center for Esophageal Diseases and Swallowing, Prof. Evan Dellon, MD, MPH, will be leading an effort to get an allergy medicine, dupilumab, approved to treat high-grade eosinophilic esophagitis in adults and adolescents.

Sabyasachi Ghosh
Sabyasachi Ghosh

Principal Consultant

Talk to Analyst

Find your sweet spots for generating winning opportunities in this market.

What are the Market Challenges for Eosinophilic Esophagitis?

Economic Costs of Eosinophilic Esophagitis Impede Growth?

Market growth is expected to be hindered by regulatory approval challenges over the forecast period. Regulation authorities require a lot of effort and time to approve the drug, as regulatory authorities such as the US Food and Drug Administration (FDA) companies that develop, manufacture, market, and distribute drugs face substantial and burdensome requirements.

Eosinophilic esophagitis is not widely understood and improper treatment can further harm the market if it is not treated timely. As a result of the high cost of treatment and the lack of information provided to patients, the eosinophilic esophagitis market in various regions has been constrained.
Country-Wise Insights

What makes North America the Largest Eosinophilic Esophagitis Market?

Healthcare Sector Expansion Boosts Eosinophilic Esophagitis Adoption

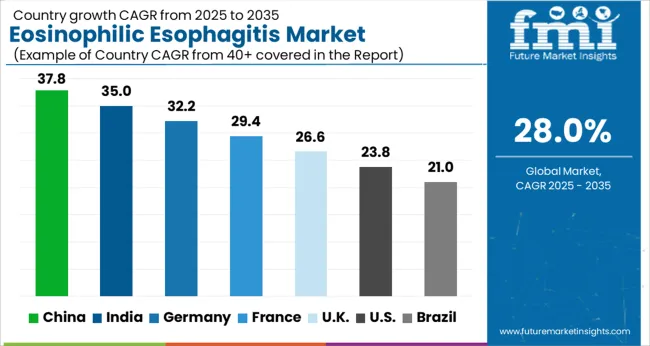
With an established healthcare infrastructure, high patient awareness, and growing EoE research prospects, North America held the biggest market share of 33% in 2023. There is an increase in demand for advanced treatments in North America, a rise in health care expenditures, and a high level of diagnosis in the region which contributes to the growth of this market. Because there is no FDA-approved drug for EoE and the burden of EoE has been increasing over the past few years, there is intense competition between market players to get a first-mover advantage.

According to the US Government, about 160,000 people in the country suffer from eosinophilic esophagitis, which is treated with off-label drugs that have not been approved by the FDA, and dietary modifications. Healthcare costs associated with EoE in the United States alone are approximately USD 1.6 billion annually.

APFED (American Partnership for Eosinophilic Disorders) and Rare Diseases Clinical Research Network (CEGIR) are two organizations that provide research grants and funding, particularly in developed economies. For instance, The American Academy of Allergy, Asthma & Immunology (AAAAI) and the American Academy of Pediatrics and Pediatric Feeding Disorders (APFED) have awarded US$ 140,000 for a two-year study to investigate to what extent the immune system interacts with foods that cause food allergy reactions. Moreover, the research will play a significant role in the identification of future drug targets as well as disease pathogenesis.
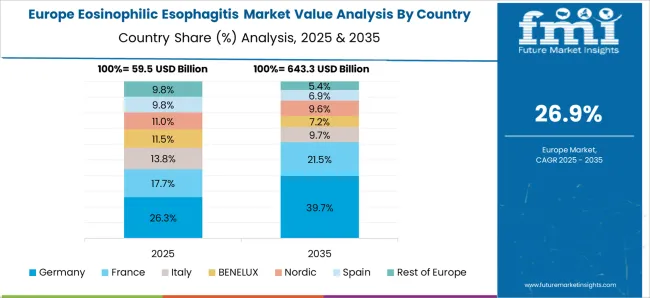
What makes Europe such a Lucrative Market for Eosinophilic Esophagitis?

New Drugs and Medical Infrastructure are propelling Eosinophilic Esophagitis Treatment Demand in Europe?

As the forecast period continues to unfold, the Europe region is projected to exhibit the fastest growth rate due to the increasing disposable incomes, the large population of patients who suffer from EoE Oesophagitis, and an increased focus on healthcare during the forecast period.

Research and development prospects are expected to be positively affected by countries such as the UK that offer attractive investment opportunities for clinical research. For instance, EsoCap supports the first Europe EoE Day in May 2022 of the European Society of Eosinophilic Oesophagitis. EoE diagnosis and treatment pathways are the focus of the campaign, which is the first of its kind in Europe. Increasing public awareness will increase screening and better diagnosis rates, which are critical for effectively treating EoE since early intervention is key.

Get the data you need at a Fraction of the cost

Personalize your report by choosing insights you need
and save 40%!

Category-wise Insights

What is the Impact of PPI on EoE Market Growth?

Patients with GERD Disease are expected to Increase PPI Production at a Significant Rate

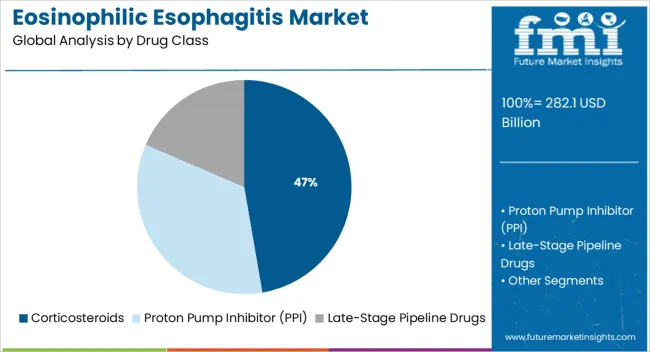
In the field of gastroesophageal reflux disease (GERD), proton pump inhibitors are the gold standard medication. Various factors are driving the growth of this market, including an increase in GERD cases, the acceptance of new drug delivery systems, as well as the growth in proton pump inhibitor sales. A rise in the prevalence of gastrointestinal disorders, including barrettes esophagus, duodenal ulcers, and non-erosive reflux disease (NERD), is likely to fuel the market growth for proton pump inhibitors in the coming years.

In the last few years, proton pump inhibitors have become more widely prescribed in ambulatory settings in the US. The marketing of brands is also a major expense for many firms. The American Board of Internal Medicine has also acknowledged the widespread use of PPIs; therefore, a campaign was launched to promote their appropriate use. Furthermore, the market will also be affected by product launches in a generic category. For instance, Hanmi Pharmaceutical aims to address the gastritis treatment market with Esomezol DR SR Cap. 10 mg (esomeprazole magnesium trihydrate), or Esomezol DR 10 mg, which was released recently. Watchers of the industry pay attention to which medicine or component will prevail in the fierce competition over gastritis treatments.

Which Distribution Channel Shows Higher Sales of Eosinophilic Esophagitis Market?

Demand for Eosinophilic Esophagitis in Hospital Pharmacies to Gain Traction

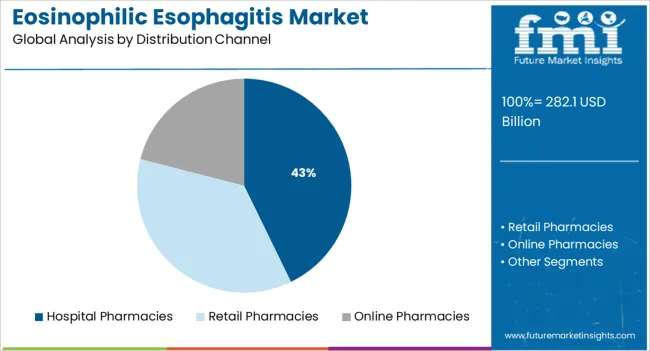
EoE treatments for GERD are becoming increasingly popular in hospitals, which is leading to a 42.1% market share in 2023. It is expected that the segment will continue to dominate during the forecast period due to rising healthcare expenditures globally, growing patient awareness levels, and advanced hospital infrastructure in developed countries.

A tenfold increase in EoE-related hospitalizations from 2010 to 2016 has been observed in US hospital admission rates, along with an associated increase in mean costs. The high risk of side effects and risks associated with medicines may further increase the market sales of medicines in hospital pharmacies.

The Start-Up Ecosystem: How Key Players are Opening Frontiers for Future Growth?

Some of the start-ups in the eosinophilic esophagitis market? include?
  • i-Gastro.net has developed the EoE Tracker application to help patients suffering from Eosinophilic Esophagitis (EoE). This is an allergy to the esophagus that causes difficulty swallowing and chest pain. In addition to tracking symptoms, the application suggests removing the most common food groups associated with EoE. Elimination diets assist patients in identifying symptoms and communicating relevant diet information to their physicians by correlating symptoms to certain food groups.
  • The US-based NexEos Bio develops non-invasive imaging agents for the diagnosis and treatment of diseases induced by eosinophils. NDX33-o) (oral administration) is the lead product designated as a noninvasive imaging agent for Eosinophilic Esophagitis (EoE). A SPECT-CT scan is used to image the agent for the presence of eosinophilic inflammation.
  • Switzerland-based EsoCap Biotech is a developer of topical drug delivery systems for treating disorders of the upper gastrointestinal tract. To treat eosinophilic esophagitis, ESO101 I delivers mometasone topically.

Market Competition

Manufacturers can increase production and meet consumer demand with strategic partnerships, boosting revenue and market share. End users will benefit from natural drugs for the treatment of EoE by leveraging new products and technologies. Strategic partnerships can help companies expand their production capabilities.

  • In December 2022, as part of an announcement by Sanofi and Regeneron, the European Medicines Agency (EMA) Committee for Medicinal Products for Human Use (CHMP) has approved Dupixent (dupilumab) for treating chronic inflammatory diseases such as eosinophilic esophagitis in adults and adolescents. In May 2022, the FDA approved Dupixent to treat patients with eosinophilic esophagitis. US FDA approves this medicine for the treatment of eosinophilic esophagitis.
  • Eupraxia Pharmaceuticals Inc. with a drug delivery technology platform that is in Phase 2 clinical development, a biotech company with an innovative drug delivery platform has initiated a Phase 2 trial for EP-104IAR in adults with eosinophilic esophagitis (EoE), a rare condition affecting the ability to swallow food. As a result of the proven efficacy of oral immediate-release fluticasone propionate in this indication, the Company believes its drug delivery technology platform could work in EoE, and a growing body of evidence supports the value of extended-release steroids.

Report Scope

Report Attribute Details
Market Value in 2023 US$ 172.21 Billion
Market Value in 2033 US$ 2,032.8 Billion
Growth Rate CAGR of 28% from 2022 to 2032
Base Year for Estimation 2022
Historical Data 2018 to 2022
Forecast Period 2023 to 2033
Quantitative Units Revenue in US$ Billion and CAGR from 2023 to 2033
Report Coverage Revenue Forecast, Volume Forecast, Company Ranking, Competitive Landscape, Growth Factors, Trends, and Pricing Analysis
Segments Covered
  • Drug Class
  • Distribution Channel
  • Region
Regions Covered
  • North America
  • Latin America
  • Europe
  • South Asia
  • East Asia
  • Oceania
  • Middle East & Africa (MEA)
Key Countries Profiled
  • The US
  • Canada
  • Brazil
  • Mexico
  • Germany
  • The UK
  • France
  • Spain
  • Italy
  • India
  • Malaysia
  • Singapore
  • Thailand
  • China
  • Japan
  • South Korea
  • Australia
  • New Zealand
  • GCC
  • South Africa
  • Israel
Key Companies Profiled
  • Ellodi Pharmaceuticals
  • EsoCap AG
  • GlaxoSmithKline plc.
  • Teva Pharmaceutical Industries Ltd.
  • Cipla Limited
  • Sun Pharmaceutical Industries Limited
  • AstraZeneca Plc
  • Sanofi S.A.
  • Arena Pharmaceuticals, Inc.
  • Takeda Pharmaceutical Company Limited
  • Revolo Biotherapeutics
  • Allakos Inc.
Customization Available Upon Request

Key Segments Profiled in the Eosinophilic Esophagitis Market Industry Survey

By Drug Class:

  • Corticosteroids
    • Budesonide
      • Jorveza
      • Off-label budesonide
    • Fluticasone
  • Proton Pump Inhibitor (PPI)
    • Omeprazole
    • Esomeprazole
    • Others
  • Late-Stage Pipeline Drugs
    • Dupixent
    • APT-1011
    • Lirentelimab (AK002)
    • Cendakimab
    • Etrasimod
    • TAK-721
    • Omilancor (BT-11)

By Distribution Channel:

  • Hospital Pharmacies
  • Retail Pharmacies
  • Online Pharmacies

By Region:

  • North America
  • Latin America
  • Europe
  • South Asia
  • East Asia
  • Oceania
  • Middle East & Africa (MEA)

Frequently Asked Questions

What is the anticipated growth of the market eosinophilic esophagitis until 2033?

FMI projects the global eosinophilic esophagitis market to expand at a 28% value CAGR by 2033.

What is the estimated market value of the eosinophilic esophagitis market expected in 2023?

The global eosinophilic esophagitis market is estimated at a market value of US$ 172.21 Billion.

What is the estimated market value of the eosinophilic esophagitis market expected in 2033?

The global eosinophilic esophagitis market is expected to garner a market value of US$ 2032.8 Billion.

Which region is forecast to be the most lucrative for eosinophilic esophagitis market growth?

FMI has projected North America to be one of the key regions for the eosinophilic esophagitis market, with the US expected to account for over 33% of the North American market during the forecast period.

Which are some prominent eosinophilic esophagitis manufacturers?

Sanofi S.A., GlaxoSmithKline plc, Cipla Limited, and Teva Pharmaceutical Industries Ltd. are some prominent eosinophilic esophagitis manufacturers.

Which drug class of eosinophilic esophagitis is expected to account for the largest share in the forecast period 2023-2033?

The PPI drug class held the largest share and accounted for 54% of the market value in 2023. 

Table of Content

1. Executive Summary | Eosinophilic Esophagitis Market

    1.1. Global Market Outlook

    1.2. Demand-side Trends

    1.3. Supply-side Trends

    1.4. Technology Roadmap Analysis

    1.5. Analysis and Recommendations

2. Market Overview

    2.1. Market Coverage / Taxonomy

    2.2. Market Definition / Scope / Limitations

3. Market Background

    3.1. Market Dynamics

        3.1.1. Drivers

        3.1.2. Restraints

        3.1.3. Opportunity

        3.1.4. Trends

    3.2. Scenario Forecast

        3.2.1. Demand in Optimistic Scenario

        3.2.2. Demand in Likely Scenario

        3.2.3. Demand in Conservative Scenario

    3.3. Opportunity Map Analysis

    3.4. Investment Feasibility Matrix

    3.5. PESTLE and Porter’s Analysis

    3.6. Regulatory Landscape

        3.6.1. By Key Regions

        3.6.2. By Key Countries

    3.7. Regional Parent Market Outlook

4. Global Market Analysis 2018 to 2022 and Forecast, 2023 to 2033

    4.1. Historical Market Size Value (US$ Million) Analysis, 2018 to 2022

    4.2. Current and Future Market Size Value (US$ Million) Projections, 2023 to 2033

        4.2.1. Y-o-Y Growth Trend Analysis

        4.2.2. Absolute $ Opportunity Analysis

5. Global Market Analysis 2018 to 2022 and Forecast 2023 to 2033, By Drug Class

    5.1. Introduction / Key Findings

    5.2. Historical Market Size Value (US$ Million) Analysis By Drug Class, 2018 to 2022

    5.3. Current and Future Market Size Value (US$ Million) Analysis and Forecast By Drug Class, 2023 to 2033

        5.3.1. Corticosteroids

            5.3.1.1. Budesonide

                5.3.1.1.1. Jorveza

                5.3.1.1.2. Off-label budesonide

            5.3.1.2. Fluticasone

        5.3.2. Proton Pump Inhibitor (PPI)

            5.3.2.1. Omeprazole

            5.3.2.2. Esomeprazole

            5.3.2.3. Others

        5.3.3. Late-Stage Pipeline Drugs

            5.3.3.1. Dupixent

            5.3.3.2. APT-1011

            5.3.3.3. Lirentelimab (AK002)

            5.3.3.4. Cendakimab

            5.3.3.5. Etrasimod

            5.3.3.6. TAK-721

            5.3.3.7. Omilancor (BT-11)

    5.4. Y-o-Y Growth Trend Analysis By Drug Class, 2018 to 2022

    5.5. Absolute $ Opportunity Analysis By Drug Class, 2023 to 2033

6. Global Market Analysis 2018 to 2022 and Forecast 2023 to 2033, By Distribution Channel

    6.1. Introduction / Key Findings

    6.2. Historical Market Size Value (US$ Million) Analysis By Distribution Channel, 2018 to 2022

    6.3. Current and Future Market Size Value (US$ Million) Analysis and Forecast By Distribution Channel, 2023 to 2033

        6.3.1. Hospital Pharmacies

        6.3.2. Retail Pharmacies

        6.3.3. Online Pharmacies

    6.4. Y-o-Y Growth Trend Analysis By Distribution Channel, 2018 to 2022

    6.5. Absolute $ Opportunity Analysis By Distribution Channel, 2023 to 2033

7. Global Market Analysis 2018 to 2022 and Forecast 2023 to 2033, By Region

    7.1. Introduction

    7.2. Historical Market Size Value (US$ Million) Analysis By Region, 2018 to 2022

    7.3. Current Market Size Value (US$ Million) Analysis and Forecast By Region, 2023 to 2033

        7.3.1. North America

        7.3.2. Latin America

        7.3.3. Europe

        7.3.4. South Asia

        7.3.5. East Asia

        7.3.6. Oceania

        7.3.7. Middle East & Africa (MEA)

    7.4. Market Attractiveness Analysis By Region

8. North America Market Analysis 2018 to 2022 and Forecast 2023 to 2033, By Country

    8.1. Historical Market Size Value (US$ Million) Trend Analysis By Market Taxonomy, 2018 to 2022

    8.2. Market Size Value (US$ Million) Forecast By Market Taxonomy, 2023 to 2033

        8.2.1. By Country

            8.2.1.1. The US

            8.2.1.2. Canada

        8.2.2. By Drug Class

        8.2.3. By Distribution Channel

    8.3. Market Attractiveness Analysis

        8.3.1. By Country

        8.3.2. By Drug Class

        8.3.3. By Distribution Channel

    8.4. Key Takeaways

9. Latin America Market Analysis 2018 to 2022 and Forecast 2023 to 2033, By Country

    9.1. Historical Market Size Value (US$ Million) Trend Analysis By Market Taxonomy, 2018 to 2022

    9.2. Market Size Value (US$ Million) Forecast By Market Taxonomy, 2023 to 2033

        9.2.1. By Country

            9.2.1.1. Brazil

            9.2.1.2. Mexico

            9.2.1.3. Rest of Latin America

        9.2.2. By Drug Class

        9.2.3. By Distribution Channel

    9.3. Market Attractiveness Analysis

        9.3.1. By Country

        9.3.2. By Drug Class

        9.3.3. By Distribution Channel

    9.4. Key Takeaways

10. Europe Market Analysis 2018 to 2022 and Forecast 2023 to 2033, By Country

    10.1. Historical Market Size Value (US$ Million) Trend Analysis By Market Taxonomy, 2018 to 2022

    10.2. Market Size Value (US$ Million) Forecast By Market Taxonomy, 2023 to 2033

        10.2.1. By Country

            10.2.1.1. Germany

            10.2.1.2. The UK

            10.2.1.3. France

            10.2.1.4. Spain

            10.2.1.5. Italy

            10.2.1.6. Rest of Europe

        10.2.2. By Drug Class

        10.2.3. By Distribution Channel

    10.3. Market Attractiveness Analysis

        10.3.1. By Country

        10.3.2. By Drug Class

        10.3.3. By Distribution Channel

    10.4. Key Takeaways

11. South Asia Market Analysis 2018 to 2022 and Forecast 2023 to 2033, By Country

    11.1. Historical Market Size Value (US$ Million) Trend Analysis By Market Taxonomy, 2018 to 2022

    11.2. Market Size Value (US$ Million) Forecast By Market Taxonomy, 2023 to 2033

        11.2.1. By Country

            11.2.1.1. India

            11.2.1.2. Malaysia

            11.2.1.3. Singapore

            11.2.1.4. Thailand

            11.2.1.5. Rest of South Asia

        11.2.2. By Drug Class

        11.2.3. By Distribution Channel

    11.3. Market Attractiveness Analysis

        11.3.1. By Country

        11.3.2. By Drug Class

        11.3.3. By Distribution Channel

    11.4. Key Takeaways

12. East Asia Market Analysis 2018 to 2022 and Forecast 2023 to 2033, By Country

    12.1. Historical Market Size Value (US$ Million) Trend Analysis By Market Taxonomy, 2018 to 2022

    12.2. Market Size Value (US$ Million) Forecast By Market Taxonomy, 2023 to 2033

        12.2.1. By Country

            12.2.1.1. China

            12.2.1.2. Japan

            12.2.1.3. South Korea

        12.2.2. By Drug Class

        12.2.3. By Distribution Channel

    12.3. Market Attractiveness Analysis

        12.3.1. By Country

        12.3.2. By Drug Class

        12.3.3. By Distribution Channel

    12.4. Key Takeaways

13. Oceania Market Analysis 2018 to 2022 and Forecast 2023 to 2033, By Country

    13.1. Historical Market Size Value (US$ Million) Trend Analysis By Market Taxonomy, 2018 to 2022

    13.2. Market Size Value (US$ Million) Forecast By Market Taxonomy, 2023 to 2033

        13.2.1. By Country

            13.2.1.1. Australia

            13.2.1.2. New Zealand

        13.2.2. By Drug Class

        13.2.3. By Distribution Channel

    13.3. Market Attractiveness Analysis

        13.3.1. By Country

        13.3.2. By Drug Class

        13.3.3. By Distribution Channel

    13.4. Key Takeaways

14. MEA Market Analysis 2018 to 2022 and Forecast 2023 to 2033, By Country

    14.1. Historical Market Size Value (US$ Million) Trend Analysis By Market Taxonomy, 2018 to 2022

    14.2. Market Size Value (US$ Million) Forecast By Market Taxonomy, 2023 to 2033

        14.2.1. By Country

            14.2.1.1. GCC Countries

            14.2.1.2. South Africa

            14.2.1.3. Israel

            14.2.1.4. Rest of MEA

        14.2.2. By Drug Class

        14.2.3. By Distribution Channel

    14.3. Market Attractiveness Analysis

        14.3.1. By Country

        14.3.2. By Drug Class

        14.3.3. By Distribution Channel

    14.4. Key Takeaways

15. Key Countries Market Analysis

    15.1. The US

        15.1.1. Pricing Analysis

        15.1.2. Market Share Analysis, 2022

            15.1.2.1. By Drug Class

            15.1.2.2. By Distribution Channel

    15.2. Canada

        15.2.1. Pricing Analysis

        15.2.2. Market Share Analysis, 2022

            15.2.2.1. By Drug Class

            15.2.2.2. By Distribution Channel

    15.3. Brazil

        15.3.1. Pricing Analysis

        15.3.2. Market Share Analysis, 2022

            15.3.2.1. By Drug Class

            15.3.2.2. By Distribution Channel

    15.4. Mexico

        15.4.1. Pricing Analysis

        15.4.2. Market Share Analysis, 2022

            15.4.2.1. By Drug Class

            15.4.2.2. By Distribution Channel

    15.5. Germany

        15.5.1. Pricing Analysis

        15.5.2. Market Share Analysis, 2022

            15.5.2.1. By Drug Class

            15.5.2.2. By Distribution Channel

    15.6. The UK

        15.6.1. Pricing Analysis

        15.6.2. Market Share Analysis, 2022

            15.6.2.1. By Drug Class

            15.6.2.2. By Distribution Channel

    15.7. France

        15.7.1. Pricing Analysis

        15.7.2. Market Share Analysis, 2022

            15.7.2.1. By Drug Class

            15.7.2.2. By Distribution Channel

    15.8. Spain

        15.8.1. Pricing Analysis

        15.8.2. Market Share Analysis, 2022

            15.8.2.1. By Drug Class

            15.8.2.2. By Distribution Channel

    15.9. Italy

        15.9.1. Pricing Analysis

        15.9.2. Market Share Analysis, 2022

            15.9.2.1. By Drug Class

            15.9.2.2. By Distribution Channel

    15.10. India

        15.10.1. Pricing Analysis

        15.10.2. Market Share Analysis, 2022

            15.10.2.1. By Drug Class

            15.10.2.2. By Distribution Channel

    15.11. Malaysia

        15.11.1. Pricing Analysis

        15.11.2. Market Share Analysis, 2022

            15.11.2.1. By Drug Class

            15.11.2.2. By Distribution Channel

    15.12. Singapore

        15.12.1. Pricing Analysis

        15.12.2. Market Share Analysis, 2022

            15.12.2.1. By Drug Class

            15.12.2.2. By Distribution Channel

    15.13. Thailand

        15.13.1. Pricing Analysis

        15.13.2. Market Share Analysis, 2022

            15.13.2.1. By Drug Class

            15.13.2.2. By Distribution Channel

    15.14. China

        15.14.1. Pricing Analysis

        15.14.2. Market Share Analysis, 2022

            15.14.2.1. By Drug Class

            15.14.2.2. By Distribution Channel

    15.15. Japan

        15.15.1. Pricing Analysis

        15.15.2. Market Share Analysis, 2022

            15.15.2.1. By Drug Class

            15.15.2.2. By Distribution Channel

    15.16. South Korea

        15.16.1. Pricing Analysis

        15.16.2. Market Share Analysis, 2022

            15.16.2.1. By Drug Class

            15.16.2.2. By Distribution Channel

    15.17. Australia

        15.17.1. Pricing Analysis

        15.17.2. Market Share Analysis, 2022

            15.17.2.1. By Drug Class

            15.17.2.2. By Distribution Channel

    15.18. New Zealand

        15.18.1. Pricing Analysis

        15.18.2. Market Share Analysis, 2022

            15.18.2.1. By Drug Class

            15.18.2.2. By Distribution Channel

    15.19. GCC Countries

        15.19.1. Pricing Analysis

        15.19.2. Market Share Analysis, 2022

            15.19.2.1. By Drug Class

            15.19.2.2. By Distribution Channel

    15.20. South Africa

        15.20.1. Pricing Analysis

        15.20.2. Market Share Analysis, 2022

            15.20.2.1. By Drug Class

            15.20.2.2. By Distribution Channel

    15.21. Israel

        15.21.1. Pricing Analysis

        15.21.2. Market Share Analysis, 2022

            15.21.2.1. By Drug Class

            15.21.2.2. By Distribution Channel

16. Market Structure Analysis

    16.1. Competition Dashboard

    16.2. Competition Benchmarking

    16.3. Market Share Analysis of Top Players

        16.3.1. By Regional

        16.3.2. By Drug Class

        16.3.3. By Distribution Channel

17. Competition Analysis

    17.1. Competition Deep Dive

        17.1.1. Ellodi Pharmaceuticals

            17.1.1.1. Overview

            17.1.1.2. Product Portfolio

            17.1.1.3. Profitability by Market Segments

            17.1.1.4. Sales Footprint

            17.1.1.5. Strategy Overview

                17.1.1.5.1. Marketing Strategy

        17.1.2. EsoCap AG

            17.1.2.1. Overview

            17.1.2.2. Product Portfolio

            17.1.2.3. Profitability by Market Segments

            17.1.2.4. Sales Footprint

            17.1.2.5. Strategy Overview

                17.1.2.5.1. Marketing Strategy

        17.1.3. GlaxoSmithKline plc.

            17.1.3.1. Overview

            17.1.3.2. Product Portfolio

            17.1.3.3. Profitability by Market Segments

            17.1.3.4. Sales Footprint

            17.1.3.5. Strategy Overview

                17.1.3.5.1. Marketing Strategy

        17.1.4. Teva Pharmaceutical Industries Ltd.

            17.1.4.1. Overview

            17.1.4.2. Product Portfolio

            17.1.4.3. Profitability by Market Segments

            17.1.4.4. Sales Footprint

            17.1.4.5. Strategy Overview

                17.1.4.5.1. Marketing Strategy

        17.1.5. Cipla Limited

            17.1.5.1. Overview

            17.1.5.2. Product Portfolio

            17.1.5.3. Profitability by Market Segments

            17.1.5.4. Sales Footprint

            17.1.5.5. Strategy Overview

                17.1.5.5.1. Marketing Strategy

        17.1.6. Sun Pharmaceutical Industries Limited

            17.1.6.1. Overview

            17.1.6.2. Product Portfolio

            17.1.6.3. Profitability by Market Segments

            17.1.6.4. Sales Footprint

            17.1.6.5. Strategy Overview

                17.1.6.5.1. Marketing Strategy

        17.1.7. AstraZeneca Plc

            17.1.7.1. Overview

            17.1.7.2. Product Portfolio

            17.1.7.3. Profitability by Market Segments

            17.1.7.4. Sales Footprint

            17.1.7.5. Strategy Overview

                17.1.7.5.1. Marketing Strategy

        17.1.8. Sanofi S.A.

            17.1.8.1. Overview

            17.1.8.2. Product Portfolio

            17.1.8.3. Profitability by Market Segments

            17.1.8.4. Sales Footprint

            17.1.8.5. Strategy Overview

                17.1.8.5.1. Marketing Strategy

        17.1.9. Arena Pharmaceuticals, Inc.

            17.1.9.1. Overview

            17.1.9.2. Product Portfolio

            17.1.9.3. Profitability by Market Segments

            17.1.9.4. Sales Footprint

            17.1.9.5. Strategy Overview

                17.1.9.5.1. Marketing Strategy

        17.1.10. Takeda Pharmaceutical Company Limited

            17.1.10.1. Overview

            17.1.10.2. Product Portfolio

            17.1.10.3. Profitability by Market Segments

            17.1.10.4. Sales Footprint

            17.1.10.5. Strategy Overview

                17.1.10.5.1. Marketing Strategy

        17.1.11. Revolo Biotherapeutics

            17.1.11.1. Overview

            17.1.11.2. Product Portfolio

            17.1.11.3. Profitability by Market Segments

            17.1.11.4. Sales Footprint

            17.1.11.5. Strategy Overview

                17.1.11.5.1. Marketing Strategy

        17.1.12. Allakos Inc.

            17.1.12.1. Overview

            17.1.12.2. Product Portfolio

            17.1.12.3. Profitability by Market Segments

            17.1.12.4. Sales Footprint

            17.1.12.5. Strategy Overview

                17.1.12.5.1. Marketing Strategy

18. Assumptions & Acronyms Used

19. Research Methodology

List of Tables

Table 1: Global Market Value (US$ Million) Forecast by Region, 2018 to 2033

Table 2: Global Market Value (US$ Million) Forecast by Drug Class, 2018 to 2033

Table 3: Global Market Value (US$ Million) Forecast by Distribution Channel, 2018 to 2033

Table 4: North America Market Value (US$ Million) Forecast by Country, 2018 to 2033

Table 5: North America Market Value (US$ Million) Forecast by Drug Class, 2018 to 2033

Table 6: North America Market Value (US$ Million) Forecast by Distribution Channel, 2018 to 2033

Table 7: Latin America Market Value (US$ Million) Forecast by Country, 2018 to 2033

Table 8: Latin America Market Value (US$ Million) Forecast by Drug Class, 2018 to 2033

Table 9: Latin America Market Value (US$ Million) Forecast by Distribution Channel, 2018 to 2033

Table 10: Europe Market Value (US$ Million) Forecast by Country, 2018 to 2033

Table 11: Europe Market Value (US$ Million) Forecast by Drug Class, 2018 to 2033

Table 12: Europe Market Value (US$ Million) Forecast by Distribution Channel, 2018 to 2033

Table 13: South Asia Market Value (US$ Million) Forecast by Country, 2018 to 2033

Table 14: South Asia Market Value (US$ Million) Forecast by Drug Class, 2018 to 2033

Table 15: South Asia Market Value (US$ Million) Forecast by Distribution Channel, 2018 to 2033

Table 16: East Asia Market Value (US$ Million) Forecast by Country, 2018 to 2033

Table 17: East Asia Market Value (US$ Million) Forecast by Drug Class, 2018 to 2033

Table 18: East Asia Market Value (US$ Million) Forecast by Distribution Channel, 2018 to 2033

Table 19: Oceania Market Value (US$ Million) Forecast by Country, 2018 to 2033

Table 20: Oceania Market Value (US$ Million) Forecast by Drug Class, 2018 to 2033

Table 21: Oceania Market Value (US$ Million) Forecast by Distribution Channel, 2018 to 2033

Table 22: MEA Market Value (US$ Million) Forecast by Country, 2018 to 2033

Table 23: MEA Market Value (US$ Million) Forecast by Drug Class, 2018 to 2033

Table 24: MEA Market Value (US$ Million) Forecast by Distribution Channel, 2018 to 2033

List of Charts

Figure 1: Global Market Value (US$ Million) by Drug Class, 2023 to 2033

Figure 2: Global Market Value (US$ Million) by Distribution Channel, 2023 to 2033

Figure 3: Global Market Value (US$ Million) by Region, 2023 to 2033

Figure 4: Global Market Value (US$ Million) Analysis by Region, 2018 to 2033

Figure 5: Global Market Value Share (%) and BPS Analysis by Region, 2023 to 2033

Figure 6: Global Market Y-o-Y Growth (%) Projections by Region, 2023 to 2033

Figure 7: Global Market Value (US$ Million) Analysis by Drug Class, 2018 to 2033

Figure 8: Global Market Value Share (%) and BPS Analysis by Drug Class, 2023 to 2033

Figure 9: Global Market Y-o-Y Growth (%) Projections by Drug Class, 2023 to 2033

Figure 10: Global Market Value (US$ Million) Analysis by Distribution Channel, 2018 to 2033

Figure 11: Global Market Value Share (%) and BPS Analysis by Distribution Channel, 2023 to 2033

Figure 12: Global Market Y-o-Y Growth (%) Projections by Distribution Channel, 2023 to 2033

Figure 13: Global Market Attractiveness by Drug Class, 2023 to 2033

Figure 14: Global Market Attractiveness by Distribution Channel, 2023 to 2033

Figure 15: Global Market Attractiveness by Region, 2023 to 2033

Figure 16: North America Market Value (US$ Million) by Drug Class, 2023 to 2033

Figure 17: North America Market Value (US$ Million) by Distribution Channel, 2023 to 2033

Figure 18: North America Market Value (US$ Million) by Country, 2023 to 2033

Figure 19: North America Market Value (US$ Million) Analysis by Country, 2018 to 2033

Figure 20: North America Market Value Share (%) and BPS Analysis by Country, 2023 to 2033

Figure 21: North America Market Y-o-Y Growth (%) Projections by Country, 2023 to 2033

Figure 22: North America Market Value (US$ Million) Analysis by Drug Class, 2018 to 2033

Figure 23: North America Market Value Share (%) and BPS Analysis by Drug Class, 2023 to 2033

Figure 24: North America Market Y-o-Y Growth (%) Projections by Drug Class, 2023 to 2033

Figure 25: North America Market Value (US$ Million) Analysis by Distribution Channel, 2018 to 2033

Figure 26: North America Market Value Share (%) and BPS Analysis by Distribution Channel, 2023 to 2033

Figure 27: North America Market Y-o-Y Growth (%) Projections by Distribution Channel, 2023 to 2033

Figure 28: North America Market Attractiveness by Drug Class, 2023 to 2033

Figure 29: North America Market Attractiveness by Distribution Channel, 2023 to 2033

Figure 30: North America Market Attractiveness by Country, 2023 to 2033

Figure 31: Latin America Market Value (US$ Million) by Drug Class, 2023 to 2033

Figure 32: Latin America Market Value (US$ Million) by Distribution Channel, 2023 to 2033

Figure 33: Latin America Market Value (US$ Million) by Country, 2023 to 2033

Figure 34: Latin America Market Value (US$ Million) Analysis by Country, 2018 to 2033

Figure 35: Latin America Market Value Share (%) and BPS Analysis by Country, 2023 to 2033

Figure 36: Latin America Market Y-o-Y Growth (%) Projections by Country, 2023 to 2033

Figure 37: Latin America Market Value (US$ Million) Analysis by Drug Class, 2018 to 2033

Figure 38: Latin America Market Value Share (%) and BPS Analysis by Drug Class, 2023 to 2033

Figure 39: Latin America Market Y-o-Y Growth (%) Projections by Drug Class, 2023 to 2033

Figure 40: Latin America Market Value (US$ Million) Analysis by Distribution Channel, 2018 to 2033

Figure 41: Latin America Market Value Share (%) and BPS Analysis by Distribution Channel, 2023 to 2033

Figure 42: Latin America Market Y-o-Y Growth (%) Projections by Distribution Channel, 2023 to 2033

Figure 43: Latin America Market Attractiveness by Drug Class, 2023 to 2033

Figure 44: Latin America Market Attractiveness by Distribution Channel, 2023 to 2033

Figure 45: Latin America Market Attractiveness by Country, 2023 to 2033

Figure 46: Europe Market Value (US$ Million) by Drug Class, 2023 to 2033

Figure 47: Europe Market Value (US$ Million) by Distribution Channel, 2023 to 2033

Figure 48: Europe Market Value (US$ Million) by Country, 2023 to 2033

Figure 49: Europe Market Value (US$ Million) Analysis by Country, 2018 to 2033

Figure 50: Europe Market Value Share (%) and BPS Analysis by Country, 2023 to 2033

Figure 51: Europe Market Y-o-Y Growth (%) Projections by Country, 2023 to 2033

Figure 52: Europe Market Value (US$ Million) Analysis by Drug Class, 2018 to 2033

Figure 53: Europe Market Value Share (%) and BPS Analysis by Drug Class, 2023 to 2033

Figure 54: Europe Market Y-o-Y Growth (%) Projections by Drug Class, 2023 to 2033

Figure 55: Europe Market Value (US$ Million) Analysis by Distribution Channel, 2018 to 2033

Figure 56: Europe Market Value Share (%) and BPS Analysis by Distribution Channel, 2023 to 2033

Figure 57: Europe Market Y-o-Y Growth (%) Projections by Distribution Channel, 2023 to 2033

Figure 58: Europe Market Attractiveness by Drug Class, 2023 to 2033

Figure 59: Europe Market Attractiveness by Distribution Channel, 2023 to 2033

Figure 60: Europe Market Attractiveness by Country, 2023 to 2033

Figure 61: South Asia Market Value (US$ Million) by Drug Class, 2023 to 2033

Figure 62: South Asia Market Value (US$ Million) by Distribution Channel, 2023 to 2033

Figure 63: South Asia Market Value (US$ Million) by Country, 2023 to 2033

Figure 64: South Asia Market Value (US$ Million) Analysis by Country, 2018 to 2033

Figure 65: South Asia Market Value Share (%) and BPS Analysis by Country, 2023 to 2033

Figure 66: South Asia Market Y-o-Y Growth (%) Projections by Country, 2023 to 2033

Figure 67: South Asia Market Value (US$ Million) Analysis by Drug Class, 2018 to 2033

Figure 68: South Asia Market Value Share (%) and BPS Analysis by Drug Class, 2023 to 2033

Figure 69: South Asia Market Y-o-Y Growth (%) Projections by Drug Class, 2023 to 2033

Figure 70: South Asia Market Value (US$ Million) Analysis by Distribution Channel, 2018 to 2033

Figure 71: South Asia Market Value Share (%) and BPS Analysis by Distribution Channel, 2023 to 2033

Figure 72: South Asia Market Y-o-Y Growth (%) Projections by Distribution Channel, 2023 to 2033

Figure 73: South Asia Market Attractiveness by Drug Class, 2023 to 2033

Figure 74: South Asia Market Attractiveness by Distribution Channel, 2023 to 2033

Figure 75: South Asia Market Attractiveness by Country, 2023 to 2033

Figure 76: East Asia Market Value (US$ Million) by Drug Class, 2023 to 2033

Figure 77: East Asia Market Value (US$ Million) by Distribution Channel, 2023 to 2033

Figure 78: East Asia Market Value (US$ Million) by Country, 2023 to 2033

Figure 79: East Asia Market Value (US$ Million) Analysis by Country, 2018 to 2033

Figure 80: East Asia Market Value Share (%) and BPS Analysis by Country, 2023 to 2033

Figure 81: East Asia Market Y-o-Y Growth (%) Projections by Country, 2023 to 2033

Figure 82: East Asia Market Value (US$ Million) Analysis by Drug Class, 2018 to 2033

Figure 83: East Asia Market Value Share (%) and BPS Analysis by Drug Class, 2023 to 2033

Figure 84: East Asia Market Y-o-Y Growth (%) Projections by Drug Class, 2023 to 2033

Figure 85: East Asia Market Value (US$ Million) Analysis by Distribution Channel, 2018 to 2033

Figure 86: East Asia Market Value Share (%) and BPS Analysis by Distribution Channel, 2023 to 2033

Figure 87: East Asia Market Y-o-Y Growth (%) Projections by Distribution Channel, 2023 to 2033

Figure 88: East Asia Market Attractiveness by Drug Class, 2023 to 2033

Figure 89: East Asia Market Attractiveness by Distribution Channel, 2023 to 2033

Figure 90: East Asia Market Attractiveness by Country, 2023 to 2033

Figure 91: Oceania Market Value (US$ Million) by Drug Class, 2023 to 2033

Figure 92: Oceania Market Value (US$ Million) by Distribution Channel, 2023 to 2033

Figure 93: Oceania Market Value (US$ Million) by Country, 2023 to 2033

Figure 94: Oceania Market Value (US$ Million) Analysis by Country, 2018 to 2033

Figure 95: Oceania Market Value Share (%) and BPS Analysis by Country, 2023 to 2033

Figure 96: Oceania Market Y-o-Y Growth (%) Projections by Country, 2023 to 2033

Figure 97: Oceania Market Value (US$ Million) Analysis by Drug Class, 2018 to 2033

Figure 98: Oceania Market Value Share (%) and BPS Analysis by Drug Class, 2023 to 2033

Figure 99: Oceania Market Y-o-Y Growth (%) Projections by Drug Class, 2023 to 2033

Figure 100: Oceania Market Value (US$ Million) Analysis by Distribution Channel, 2018 to 2033

Figure 101: Oceania Market Value Share (%) and BPS Analysis by Distribution Channel, 2023 to 2033

Figure 102: Oceania Market Y-o-Y Growth (%) Projections by Distribution Channel, 2023 to 2033

Figure 103: Oceania Market Attractiveness by Drug Class, 2023 to 2033

Figure 104: Oceania Market Attractiveness by Distribution Channel, 2023 to 2033

Figure 105: Oceania Market Attractiveness by Country, 2023 to 2033

Figure 106: MEA Market Value (US$ Million) by Drug Class, 2023 to 2033

Figure 107: MEA Market Value (US$ Million) by Distribution Channel, 2023 to 2033

Figure 108: MEA Market Value (US$ Million) by Country, 2023 to 2033

Figure 109: MEA Market Value (US$ Million) Analysis by Country, 2018 to 2033

Figure 110: MEA Market Value Share (%) and BPS Analysis by Country, 2023 to 2033

Figure 111: MEA Market Y-o-Y Growth (%) Projections by Country, 2023 to 2033

Figure 112: MEA Market Value (US$ Million) Analysis by Drug Class, 2018 to 2033

Figure 113: MEA Market Value Share (%) and BPS Analysis by Drug Class, 2023 to 2033

Figure 114: MEA Market Y-o-Y Growth (%) Projections by Drug Class, 2023 to 2033

Figure 115: MEA Market Value (US$ Million) Analysis by Distribution Channel, 2018 to 2033

Figure 116: MEA Market Value Share (%) and BPS Analysis by Distribution Channel, 2023 to 2033

Figure 117: MEA Market Y-o-Y Growth (%) Projections by Distribution Channel, 2023 to 2033

Figure 118: MEA Market Attractiveness by Drug Class, 2023 to 2033

Figure 119: MEA Market Attractiveness by Distribution Channel, 2023 to 2033

Figure 120: MEA Market Attractiveness by Country, 2023 to 2033

Recommendations

Healthcare

Gastroesophageal Reflux Disease (GERD) Device Market

Published : March 2024

Healthcare

Esophagoscopes & Gastroscopes Market

Published : January 2023

Healthcare

Gastroesophageal Reflux Disease Therapeutics Market

Published : November 2022

Healthcare

Esophageal Catheters Market

Published : March 2022

Explore Healthcare Insights

View Reports

Eosinophilic Esophagitis Market