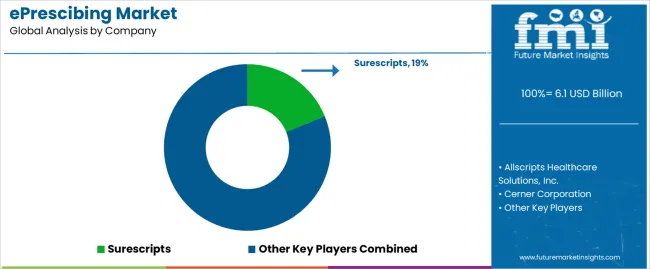
ePrescibing Market Overview from 2024 to 2034

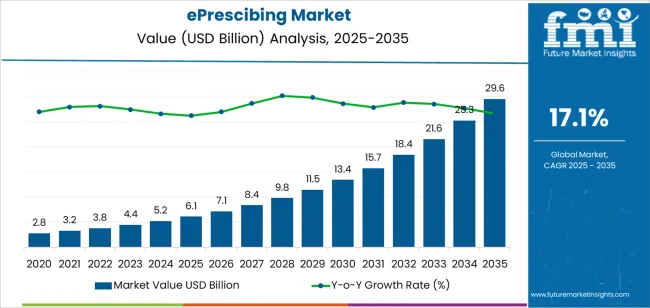
The ePrescibing market is expected to grow at a CAGR of 27.1% during the projected period. The market value is projected to increase from US$ 4.8 billion in 2024 to US$ 52.2 billion by 2034.

ePrescibing Market Size, Analysis, and Insights

  • The increasing demand for efficient and accurate electronic prescribing systems can help reduce medication errors and improve patient outcomes.
  • The rising need to improve medication safety and reduce prescription errors is driving the market. Governments and regulatory bodies around the world are implementing new regulations and guidelines to promote the adoption of ePrescribing systems and encourage healthcare providers to use digital tools for medication management.
  • The rising prevalence of chronic diseases and the growing elderly population are also driving the demand for ePrescribing solutions.
  • Patients require complex medication regimes and often require multiple prescriptions, making it essential to have accurate and efficient medication management systems in place.
  • Increasing adoption of cloud-based ePrescribing solutions, as they offer several benefits, including scalability, flexibility, and cost-effectiveness is also resulting in market growth.
  • Cloud-based systems enable healthcare providers to access patient data and medication information from anywhere, at any time, making it easier to deliver high-quality care to patients.
Attributes Details
ePrescibing Market Size, 2024 US$ 4.8 billion
Projected Market Size, 2034 US$ 52.2 billion
Value-based CAGR (2024 to 2034) 27.1%

Don't pay for what you don't need

Customize your report by selecting specific countries or regions and save 30%!

Key Opportunities for the ePrescibing Market

  • The increasing adoption of electronic health records (EHRs) by healthcare providers.
  • Rising need for more accurate and efficient prescribing reduces errors and improving patient safety.
  • Growing need to reduce healthcare costs by minimizing waste and improving medication adherence is expected to create lucrative opportunities over the forecast period.
  • The demand for mobile healthcare solutions is increasing. Patients are becoming more comfortable with using mobile apps and other digital tools to manage their health, and ePrescribing systems are no exception.
  • Growing need for healthcare providers to streamline their workflows makes mobile prescribing solutions the best tool.
  • Pharmaceutical companies can also benefit from the ePrescribing market by leveraging data to improve medication adherence and patient outcomes. By analyzing prescribing patterns, pharmaceutical companies can identify opportunities to improve their products or develop new treatments.

Challenges in the ePrescibing Market

  • Interoperability is expected to hamper the market during the forecast period.
  • EHRs are often designed by different vendors and have varying levels of compatibility, which can make it difficult to share data across different systems. The difficulty leads to errors and duplication of data, which can ultimately compromise patient safety and the integrity of the healthcare system.
  • The lack of standardization leads to medication errors, which can be dangerous for patients and can also result in additional healthcare costs.
  • Rising concerns regarding data privacy and security also restrict market growth.
  • As more patient data is digitized and shared across different platforms, there is an increased risk of data breaches and cyberattacks.
  • Ensuring the security and privacy of patient data is crucial to maintain patient trust and credibility of the healthcare system.
Sabyasachi Ghosh
Sabyasachi Ghosh

Principal Consultant

Talk to Analyst

Find your sweet spots for generating winning opportunities in this market.

Category-wise Insights

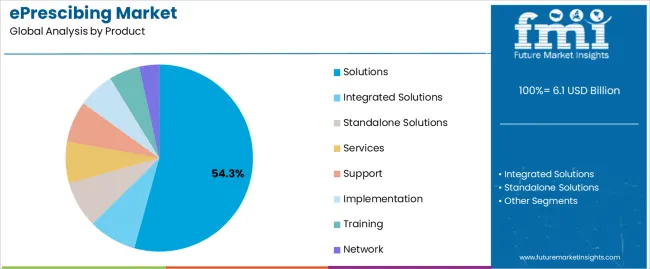
The Solutions Segment Dominates the Market by Product Type

Attributes Details
Top Product Type Solutions
CAGR from 2024 to 2034 26.9%
  • The complete end-to-end solution by healthcare providers drives the segment’s growth in the market.
  • Increasing need for reducing medication errors, increasing patient safety, and improving efficiency in the prescription process drive the segment’s growth.
  • Solutions are designed to integrate with electronic health records (EHRs), enabling seamless tracking of patient medication histories and reducing the risk of prescription drug abuse.
  • As a result, healthcare providers are increasingly adopting e-prescribing solutions, driving the growth of the solutions segment.

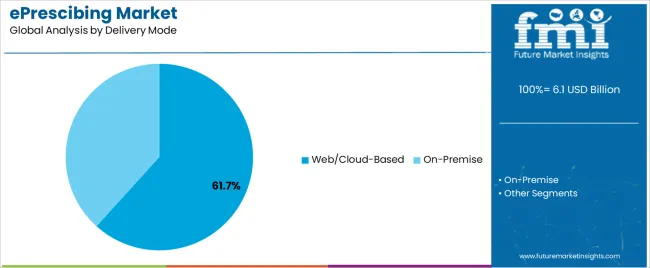
The Web/Cloud-Based Segment Dominates the Market by Delivery Mode

Attributes Details
Top Delivery Mode Web/Cloud-Based
CAGR from 2024 to 2034 26.7%
  • Rising need for convenience and accessibility is boosting the market.
  • By using web-based e-prescribing, healthcare providers can easily access patient information from anywhere with an internet connection, which allows them to quickly and securely prescribe medications to patients without having to be in the same location as them.
  • Web-based e-prescribing systems often come with features such as drug interaction checking and patient history tracking, which can help reduce the risk of medication errors and improve patient outcomes.
  • Cloud-based e-prescribing allows for easier integration with other healthcare IT systems, such as electronic health records (EHRs), which can help streamline workflow and improve overall efficiency in healthcare settings.

Country-wise insights

Countries CAGR through 2024 to 2034
United States 27.3%
United Kingdom 27.6%
China 27.4%
Japan 28.6%
South Korea 28.8%

Surge in Oil and Gas Production in the United States

  • The increasing need for accuracy and efficiency in healthcare in the United States.
  • Electronic prescribing is much more accurate than traditional paper-based methods, reducing the risk of medication errors and improving patient safety.
  • Growing need for convenience for healthcare providers and patients in the United States.
  • In line with ePrescribing, healthcare providers can easily send prescriptions to pharmacies, eliminating the need for patients to physically visit their doctors to pick up paper prescriptions.
  • ePrescribing not only saves time but also reduces the chances of prescription errors.
  • The government has also been promoting the adoption of ePrescribing.
  • The Centers for Medicare & Medicaid Services (CMS) have introduced incentive programs to encourage healthcare providers to adopt electronic prescribing.
  • The incentive programs aim to improve healthcare quality, reduce costs, and promote the use of technology in healthcare.

Increasing Use of Solid Sulphur in the Chemical Industry in the United Kingdom

  • By implementing electronic prescribing systems, healthcare providers can save time and reduce the risk of errors associated with traditional paper-based prescribing methods. Implementation leads to safer and more effective patient care, as well as lower costs and increased productivity for healthcare providers.
  • Rising focus on patient safety in the United Kingdom is driving the market demand.
  • With electronic prescribing, healthcare providers can reduce the risk of medication errors, such as prescribing the wrong medication or incorrect dosage.
  • Electronic prescribing systems can also help to identify potential drug interactions or allergies, which can prevent adverse reactions and improve patient outcomes.
  • The adoption of digital technologies in the healthcare industry has made ePrescribing more accessible and user-friendly in the United Kingdom.
  • With the use of smartphones, tablets, and other mobile devices, healthcare providers can access patient records and prescribing information quickly and easily, improving the accuracy and efficiency of the prescribing process.

Rising Focus on Agriculture Development in China

  • The increasing population of elderly citizens who require medication management.
  • With the use of ePrescribing, doctors and pharmacists can easily access patient medication histories, avoid prescription errors, and improve medication adherence.
  • The government's push for healthcare reforms in China is also driving the market forward.
  • The Chinese government has recently introduced policies to promote the use of electronic medical records and other healthcare technologies, including ePrescribing.
  • The government initiatives have led to increased investments in ePrescribing systems by healthcare providers and hospitals.
  • Increasing need to reduce healthcare costs and boost efficiency. With electronic prescriptions, doctors can quickly and accurately send prescriptions to pharmacies, reducing the need for paper-based processes.
  • ePrescribing reduces the risk of prescription errors, which can lead to adverse drug events and other negative health outcomes.

Increasing Production of Fertilizers in Japan
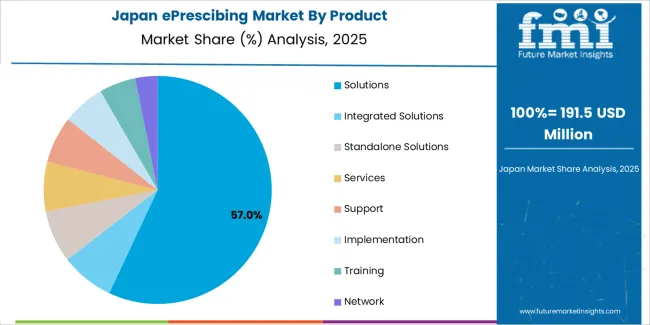
  • Increasing elimination of paper prescriptions and widespread adoption of electronic medical records (EMRs) in Japan is fueling market growth.
  • ePrescribing not only saves time but also reduces errors, as illegible handwriting and incorrect dosages can be avoided.
  • It helps prevent prescription fraud and abuse, as the system can track prescriptions and monitor patient history.
  • With EMRs, doctors can access patient information easily and quickly, enabling them to make informed decisions about prescriptions.
  • ePrescribing can be integrated with EMRs, making the process even more seamless.
  • The COVID-19 pandemic has accelerated the adoption of ePrescribing in Japan.
  • With social distancing measures in place, people are avoiding unnecessary visits to hospitals and clinics.
  • ePrescribing allows doctors to prescribe medicines remotely, reducing the need for in-person consultations.

Expansion of the Petrochemical Industry in South Korea
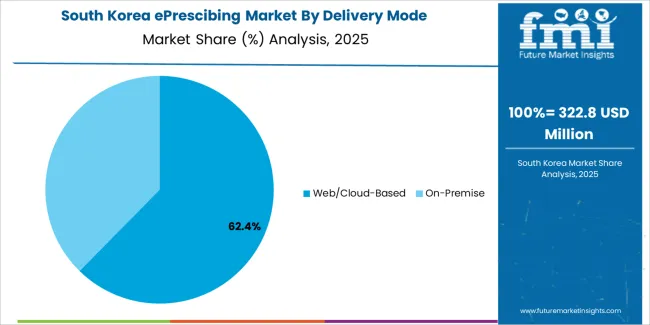
  • Increasing need to reduce medication errors in South Korea. The use of paper-based prescriptions can increase the risk of medication errors, such as prescribing the wrong dosage or medication.
  • ePrescribing can help to reduce these errors by providing doctors with real-time access to a patient's medication history, allergies, and other relevant information.
  • Increased efficiency in healthcare delivery allows doctors to quickly and easily send prescriptions to pharmacies, reducing the time spent on administrative tasks with increased focus on patient care.
  • ePrescribing can help to reduce the number of medication-related phone calls between doctors and pharmacies, further streamlining the healthcare delivery process.
  • The growing need for better healthcare services is also contributing to the increase in demand for ePrescribing in South Korea.
  • Patients are increasingly demanding more convenient and efficient healthcare services, and ePrescribing can help to meet these demands by providing patients with a more streamlined and convenient prescription process.

Get the data you need at a Fraction of the cost

Personalize your report by choosing insights you need
and save 40%!

Competitive Landscape

The ePrescribing market is constantly evolving with the emergence of new players in the industry. Companies offer a range of solutions for electronic prescribing, such as software platforms, mobile applications, and cloud-based services.

Additionally, several smaller companies and start-ups are entering the market and providing innovative solutions to meet the growing demand for e-prescribing services. Overall, the competition in the market is intense, and companies are constantly striving to differentiate themselves by offering unique features and capabilities.

Recent Developments

In 2020, DrFirst, a United States-based company, collaborated with ID.me to streamline the process of identity verification when using iPrescribe, the mobile e-prescribing application developed by DrFirst.

Key Market Players

  • Surescripts
  • Allscripts Healthcare Solutions, Inc.
  • Cerner Corporation
  • GE Healthcare
  • RelayHealth Corporation
  • Athenahealth, Inc.
  • DrFirst, Practice Fusion Inc.
  • Medical Information Technology, Inc.
  • Henry Schein, Inc.

Key Coverage in the ePrescribing Market

  • Global ePrescribing Market Trends
  • Incentive Programs in Key Countries Fostering Adoption of Electronic Prescription
  • Top ePrescribing Software Developers
  • Innovations in ePrescribing Solution Market
  • eRX Software Adoption Trends in Key Regions

Key Market Segments

By Product:

  • Solutions
    • Integrated Solutions
    • Standalone Solutions
  • Services
    • Support
    • Implementation
    • Training
    • Network

By Delivery Mode:

  • Web/Cloud-Based
  • On-premise

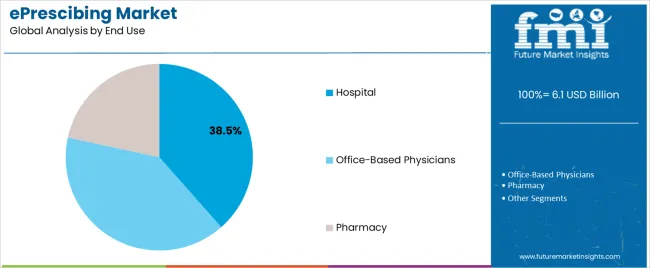
By End Use:

  • Hospital
  • Office-based Physicians
  • Pharmacy

By Usage Methods:

  • Handheld
  • Computer-Based Devices

By Substances:

  • Controlled Substances
  • Non-controlled Substances

By Specialities:

  • Oncology
  • Sports Medicine
  • Neurology
  • Cardiology
  • Others

By Region:

  • North America
  • Latin America
  • East Asia
  • South Asia
  • Europe
  • Oceania
  • MEA

Frequently Asked Questions

How Big is the ePrescribing Market in 2024?

The ePrescribing market is estimated to be valued at US$ 4.8 billion in 2024.

What is China’s Market Outlook?

The market in China is expected to progress at a CAGR of 27.4% over the forecast period.

Which Product Segment Contributes More to the ePrescribing Market?

The solutions segment is expected to register a 26.9% CAGR through 2034.

What is the United States Market Outlook?

The United States market is expected to rise at a 27.3% CAGR from 2024 to 2034.

What is the Projected Market Value by 2034?

The market is set to reach a valuation of around US$ 52.2 billion by the end of 2034.

What Was the Historical CAGR for the Global Market?

The demand for ePrescribing increased at a 30.1% CAGR from 2019 to 2023.

Table of Content
1. Executive Summary
    1.1. Global Market Outlook
    1.2. Demand-side Trends
    1.3. Supply-side Trends
    1.4. Technology Roadmap Analysis
    1.5. Analysis and Recommendations
2. Market Overview
    2.1. Market Coverage / Taxonomy
    2.2. Market Definition / Scope / Limitations
3. Market Background
    3.1. Market Dynamics
        3.1.1. Drivers
        3.1.2. Restraints
        3.1.3. Opportunity
        3.1.4. Trends
    3.2. Scenario Forecast
        3.2.1. Demand in Optimistic Scenario
        3.2.2. Demand in Likely Scenario
        3.2.3. Demand in Conservative Scenario
    3.3. Opportunity Map Analysis
    3.4. Investment Feasibility Matrix
    3.5. PESTLE and Porter’s Analysis
    3.6. Regulatory Landscape
        3.6.1. By Key Regions
        3.6.2. By Key Countries
    3.7. Regional Parent Market Outlook
4. Global Market Analysis 2019 to 2023 and Forecast, 2024 to 2034
    4.1. Historical Market Size Value (US$ Million) Analysis, 2019 to 2023
    4.2. Current and Future Market Size Value (US$ Million) Projections, 2024 to 2034
        4.2.1. Y-o-Y Growth Trend Analysis
        4.2.2. Absolute $ Opportunity Analysis
5. Global Market Analysis 2019 to 2023 and Forecast 2024 to 2034, By Product
    5.1. Introduction / Key Findings
    5.2. Historical Market Size Value (US$ Million) Analysis By Product, 2019 to 2023
    5.3. Current and Future Market Size Value (US$ Million) Analysis and Forecast By Product, 2024 to 2034
        5.3.1. Solutions
            5.3.1.1. Integrated Solutions
            5.3.1.2. Standalone Solutions
        5.3.2. Services
            5.3.2.1. Support
            5.3.2.2. Implementation
            5.3.2.3. Training
            5.3.2.4. Network
    5.4. Y-o-Y Growth Trend Analysis By Product, 2019 to 2023
    5.5. Absolute $ Opportunity Analysis By Product, 2024 to 2034
6. Global Market Analysis 2019 to 2023 and Forecast 2024 to 2034, By Delivery Mode
    6.1. Introduction / Key Findings
    6.2. Historical Market Size Value (US$ Million) Analysis By Delivery Mode, 2019 to 2023
    6.3. Current and Future Market Size Value (US$ Million) Analysis and Forecast By Delivery Mode, 2024 to 2034
        6.3.1. Web/Cloud-Based
        6.3.2. On-premise
    6.4. Y-o-Y Growth Trend Analysis By Delivery Mode, 2019 to 2023
    6.5. Absolute $ Opportunity Analysis By Delivery Mode, 2024 to 2034
7. Global Market Analysis 2019 to 2023 and Forecast 2024 to 2034, By End-use
    7.1. Introduction / Key Findings
    7.2. Historical Market Size Value (US$ Million) Analysis By End-use, 2019 to 2023
    7.3. Current and Future Market Size Value (US$ Million) Analysis and Forecast By End-use, 2024 to 2034
        7.3.1. Hospital
        7.3.2. Office-based Physicians
        7.3.3. Pharmacy
    7.4. Y-o-Y Growth Trend Analysis By End-use, 2019 to 2023
    7.5. Absolute $ Opportunity Analysis By End-use, 2024 to 2034
8. Global Market Analysis 2019 to 2023 and Forecast 2024 to 2034, By Usage Methods
    8.1. Introduction / Key Findings
    8.2. Historical Market Size Value (US$ Million) Analysis By Usage Methods, 2019 to 2023
    8.3. Current and Future Market Size Value (US$ Million) Analysis and Forecast By Usage Methods, 2024 to 2034
        8.3.1. Handheld
        8.3.2. Computer Based Devices
    8.4. Y-o-Y Growth Trend Analysis By Usage Methods, 2019 to 2023
    8.5. Absolute $ Opportunity Analysis By Usage Methods, 2024 to 2034
9. Global Market Analysis 2019 to 2023 and Forecast 2024 to 2034, By Substances
    9.1. Introduction / Key Findings
    9.2. Historical Market Size Value (US$ Million) Analysis By Substances, 2019 to 2023
    9.3. Current and Future Market Size Value (US$ Million) Analysis and Forecast By Substances, 2024 to 2034
        9.3.1. Controlled Substances
        9.3.2. Non-controlled Substances
    9.4. Y-o-Y Growth Trend Analysis By Substances, 2019 to 2023
    9.5. Absolute $ Opportunity Analysis By Substances, 2024 to 2034
10. Global Market Analysis 2019 to 2023 and Forecast 2024 to 2034, By Specialties
    10.1. Introduction / Key Findings
    10.2. Historical Market Size Value (US$ Million) Analysis By Specialties, 2019 to 2023
    10.3. Current and Future Market Size Value (US$ Million) Analysis and Forecast By Specialties, 2024 to 2034
        10.3.1. Oncology
        10.3.2. Sports Medicine
        10.3.3. Neurology
        10.3.4. Cardiology
        10.3.5. Others
    10.4. Y-o-Y Growth Trend Analysis By Specialties, 2019 to 2023
    10.5. Absolute $ Opportunity Analysis By Specialties, 2024 to 2034
11. Global Market Analysis 2019 to 2023 and Forecast 2024 to 2034, By Region
    11.1. Introduction
    11.2. Historical Market Size Value (US$ Million) Analysis By Region, 2019 to 2023
    11.3. Current Market Size Value (US$ Million) Analysis and Forecast By Region, 2024 to 2034
        11.3.1. North America
        11.3.2. Latin America
        11.3.3. Western Europe
        11.3.4. Eastern Europe
        11.3.5. South Asia and Pacific
        11.3.6. East Asia
        11.3.7. Middle East and Africa
    11.4. Market Attractiveness Analysis By Region
12. North America Market Analysis 2019 to 2023 and Forecast 2024 to 2034, By Country
    12.1. Historical Market Size Value (US$ Million) Trend Analysis By Market Taxonomy, 2019 to 2023
    12.2. Market Size Value (US$ Million) Forecast By Market Taxonomy, 2024 to 2034
        12.2.1. By Country
            12.2.1.1. USA
            12.2.1.2. Canada
        12.2.2. By Product
        12.2.3. By Delivery Mode
        12.2.4. By End-use
        12.2.5. By Usage Methods
        12.2.6. By Substances
        12.2.7. By Specialties
    12.3. Market Attractiveness Analysis
        12.3.1. By Country
        12.3.2. By Product
        12.3.3. By Delivery Mode
        12.3.4. By End-use
        12.3.5. By Usage Methods
        12.3.6. By Substances
        12.3.7. By Specialties
    12.4. Key Takeaways
13. Latin America Market Analysis 2019 to 2023 and Forecast 2024 to 2034, By Country
    13.1. Historical Market Size Value (US$ Million) Trend Analysis By Market Taxonomy, 2019 to 2023
    13.2. Market Size Value (US$ Million) Forecast By Market Taxonomy, 2024 to 2034
        13.2.1. By Country
            13.2.1.1. Brazil
            13.2.1.2. Mexico
            13.2.1.3. Rest of Latin America
        13.2.2. By Product
        13.2.3. By Delivery Mode
        13.2.4. By End-use
        13.2.5. By Usage Methods
        13.2.6. By Substances
        13.2.7. By Specialties
    13.3. Market Attractiveness Analysis
        13.3.1. By Country
        13.3.2. By Product
        13.3.3. By Delivery Mode
        13.3.4. By End-use
        13.3.5. By Usage Methods
        13.3.6. By Substances
        13.3.7. By Specialties
    13.4. Key Takeaways
14. Western Europe Market Analysis 2019 to 2023 and Forecast 2024 to 2034, By Country
    14.1. Historical Market Size Value (US$ Million) Trend Analysis By Market Taxonomy, 2019 to 2023
    14.2. Market Size Value (US$ Million) Forecast By Market Taxonomy, 2024 to 2034
        14.2.1. By Country
            14.2.1.1. Germany
            14.2.1.2. UK
            14.2.1.3. France
            14.2.1.4. Spain
            14.2.1.5. Italy
            14.2.1.6. Rest of Western Europe
        14.2.2. By Product
        14.2.3. By Delivery Mode
        14.2.4. By End-use
        14.2.5. By Usage Methods
        14.2.6. By Substances
        14.2.7. By Specialties
    14.3. Market Attractiveness Analysis
        14.3.1. By Country
        14.3.2. By Product
        14.3.3. By Delivery Mode
        14.3.4. By End-use
        14.3.5. By Usage Methods
        14.3.6. By Substances
        14.3.7. By Specialties
    14.4. Key Takeaways
15. Eastern Europe Market Analysis 2019 to 2023 and Forecast 2024 to 2034, By Country
    15.1. Historical Market Size Value (US$ Million) Trend Analysis By Market Taxonomy, 2019 to 2023
    15.2. Market Size Value (US$ Million) Forecast By Market Taxonomy, 2024 to 2034
        15.2.1. By Country
            15.2.1.1. Poland
            15.2.1.2. Russia
            15.2.1.3. Czech Republic
            15.2.1.4. Romania
            15.2.1.5. Rest of Eastern Europe
        15.2.2. By Product
        15.2.3. By Delivery Mode
        15.2.4. By End-use
        15.2.5. By Usage Methods
        15.2.6. By Substances
        15.2.7. By Specialties
    15.3. Market Attractiveness Analysis
        15.3.1. By Country
        15.3.2. By Product
        15.3.3. By Delivery Mode
        15.3.4. By End-use
        15.3.5. By Usage Methods
        15.3.6. By Substances
        15.3.7. By Specialties
    15.4. Key Takeaways
16. South Asia and Pacific Market Analysis 2019 to 2023 and Forecast 2024 to 2034, By Country
    16.1. Historical Market Size Value (US$ Million) Trend Analysis By Market Taxonomy, 2019 to 2023
    16.2. Market Size Value (US$ Million) Forecast By Market Taxonomy, 2024 to 2034
        16.2.1. By Country
            16.2.1.1. India
            16.2.1.2. Bangladesh
            16.2.1.3. Australia
            16.2.1.4. New Zealand
            16.2.1.5. Rest of South Asia and Pacific
        16.2.2. By Product
        16.2.3. By Delivery Mode
        16.2.4. By End-use
        16.2.5. By Usage Methods
        16.2.6. By Substances
        16.2.7. By Specialties
    16.3. Market Attractiveness Analysis
        16.3.1. By Country
        16.3.2. By Product
        16.3.3. By Delivery Mode
        16.3.4. By End-use
        16.3.5. By Usage Methods
        16.3.6. By Substances
        16.3.7. By Specialties
    16.4. Key Takeaways
17. East Asia Market Analysis 2019 to 2023 and Forecast 2024 to 2034, By Country
    17.1. Historical Market Size Value (US$ Million) Trend Analysis By Market Taxonomy, 2019 to 2023
    17.2. Market Size Value (US$ Million) Forecast By Market Taxonomy, 2024 to 2034
        17.2.1. By Country
            17.2.1.1. China
            17.2.1.2. Japan
            17.2.1.3. South Korea
        17.2.2. By Product
        17.2.3. By Delivery Mode
        17.2.4. By End-use
        17.2.5. By Usage Methods
        17.2.6. By Substances
        17.2.7. By Specialties
    17.3. Market Attractiveness Analysis
        17.3.1. By Country
        17.3.2. By Product
        17.3.3. By Delivery Mode
        17.3.4. By End-use
        17.3.5. By Usage Methods
        17.3.6. By Substances
        17.3.7. By Specialties
    17.4. Key Takeaways
18. Middle East and Africa Market Analysis 2019 to 2023 and Forecast 2024 to 2034, By Country
    18.1. Historical Market Size Value (US$ Million) Trend Analysis By Market Taxonomy, 2019 to 2023
    18.2. Market Size Value (US$ Million) Forecast By Market Taxonomy, 2024 to 2034
        18.2.1. By Country
            18.2.1.1. GCC Countries
            18.2.1.2. South Africa
            18.2.1.3. Israel
            18.2.1.4. Rest of MEA
        18.2.2. By Product
        18.2.3. By Delivery Mode
        18.2.4. By End-use
        18.2.5. By Usage Methods
        18.2.6. By Substances
        18.2.7. By Specialties
    18.3. Market Attractiveness Analysis
        18.3.1. By Country
        18.3.2. By Product
        18.3.3. By Delivery Mode
        18.3.4. By End-use
        18.3.5. By Usage Methods
        18.3.6. By Substances
        18.3.7. By Specialties
    18.4. Key Takeaways
19. Key Countries Market Analysis
    19.1. USA
        19.1.1. Pricing Analysis
        19.1.2. Market Share Analysis, 2023
            19.1.2.1. By Product
            19.1.2.2. By Delivery Mode
            19.1.2.3. By End-use
            19.1.2.4. By Usage Methods
            19.1.2.5. By Substances
            19.1.2.6. By Specialties
    19.2. Canada
        19.2.1. Pricing Analysis
        19.2.2. Market Share Analysis, 2023
            19.2.2.1. By Product
            19.2.2.2. By Delivery Mode
            19.2.2.3. By End-use
            19.2.2.4. By Usage Methods
            19.2.2.5. By Substances
            19.2.2.6. By Specialties
    19.3. Brazil
        19.3.1. Pricing Analysis
        19.3.2. Market Share Analysis, 2023
            19.3.2.1. By Product
            19.3.2.2. By Delivery Mode
            19.3.2.3. By End-use
            19.3.2.4. By Usage Methods
            19.3.2.5. By Substances
            19.3.2.6. By Specialties
    19.4. Mexico
        19.4.1. Pricing Analysis
        19.4.2. Market Share Analysis, 2023
            19.4.2.1. By Product
            19.4.2.2. By Delivery Mode
            19.4.2.3. By End-use
            19.4.2.4. By Usage Methods
            19.4.2.5. By Substances
            19.4.2.6. By Specialties
    19.5. Germany
        19.5.1. Pricing Analysis
        19.5.2. Market Share Analysis, 2023
            19.5.2.1. By Product
            19.5.2.2. By Delivery Mode
            19.5.2.3. By End-use
            19.5.2.4. By Usage Methods
            19.5.2.5. By Substances
            19.5.2.6. By Specialties
    19.6. UK
        19.6.1. Pricing Analysis
        19.6.2. Market Share Analysis, 2023
            19.6.2.1. By Product
            19.6.2.2. By Delivery Mode
            19.6.2.3. By End-use
            19.6.2.4. By Usage Methods
            19.6.2.5. By Substances
            19.6.2.6. By Specialties
    19.7. France
        19.7.1. Pricing Analysis
        19.7.2. Market Share Analysis, 2023
            19.7.2.1. By Product
            19.7.2.2. By Delivery Mode
            19.7.2.3. By End-use
            19.7.2.4. By Usage Methods
            19.7.2.5. By Substances
            19.7.2.6. By Specialties
    19.8. Spain
        19.8.1. Pricing Analysis
        19.8.2. Market Share Analysis, 2023
            19.8.2.1. By Product
            19.8.2.2. By Delivery Mode
            19.8.2.3. By End-use
            19.8.2.4. By Usage Methods
            19.8.2.5. By Substances
            19.8.2.6. By Specialties
    19.9. Italy
        19.9.1. Pricing Analysis
        19.9.2. Market Share Analysis, 2023
            19.9.2.1. By Product
            19.9.2.2. By Delivery Mode
            19.9.2.3. By End-use
            19.9.2.4. By Usage Methods
            19.9.2.5. By Substances
            19.9.2.6. By Specialties
    19.10. Poland
        19.10.1. Pricing Analysis
        19.10.2. Market Share Analysis, 2023
            19.10.2.1. By Product
            19.10.2.2. By Delivery Mode
            19.10.2.3. By End-use
            19.10.2.4. By Usage Methods
            19.10.2.5. By Substances
            19.10.2.6. By Specialties
    19.11. Russia
        19.11.1. Pricing Analysis
        19.11.2. Market Share Analysis, 2023
            19.11.2.1. By Product
            19.11.2.2. By Delivery Mode
            19.11.2.3. By End-use
            19.11.2.4. By Usage Methods
            19.11.2.5. By Substances
            19.11.2.6. By Specialties
    19.12. Czech Republic
        19.12.1. Pricing Analysis
        19.12.2. Market Share Analysis, 2023
            19.12.2.1. By Product
            19.12.2.2. By Delivery Mode
            19.12.2.3. By End-use
            19.12.2.4. By Usage Methods
            19.12.2.5. By Substances
            19.12.2.6. By Specialties
    19.13. Romania
        19.13.1. Pricing Analysis
        19.13.2. Market Share Analysis, 2023
            19.13.2.1. By Product
            19.13.2.2. By Delivery Mode
            19.13.2.3. By End-use
            19.13.2.4. By Usage Methods
            19.13.2.5. By Substances
            19.13.2.6. By Specialties
    19.14. India
        19.14.1. Pricing Analysis
        19.14.2. Market Share Analysis, 2023
            19.14.2.1. By Product
            19.14.2.2. By Delivery Mode
            19.14.2.3. By End-use
            19.14.2.4. By Usage Methods
            19.14.2.5. By Substances
            19.14.2.6. By Specialties
    19.15. Bangladesh
        19.15.1. Pricing Analysis
        19.15.2. Market Share Analysis, 2023
            19.15.2.1. By Product
            19.15.2.2. By Delivery Mode
            19.15.2.3. By End-use
            19.15.2.4. By Usage Methods
            19.15.2.5. By Substances
            19.15.2.6. By Specialties
    19.16. Australia
        19.16.1. Pricing Analysis
        19.16.2. Market Share Analysis, 2023
            19.16.2.1. By Product
            19.16.2.2. By Delivery Mode
            19.16.2.3. By End-use
            19.16.2.4. By Usage Methods
            19.16.2.5. By Substances
            19.16.2.6. By Specialties
    19.17. New Zealand
        19.17.1. Pricing Analysis
        19.17.2. Market Share Analysis, 2023
            19.17.2.1. By Product
            19.17.2.2. By Delivery Mode
            19.17.2.3. By End-use
            19.17.2.4. By Usage Methods
            19.17.2.5. By Substances
            19.17.2.6. By Specialties
    19.18. China
        19.18.1. Pricing Analysis
        19.18.2. Market Share Analysis, 2023
            19.18.2.1. By Product
            19.18.2.2. By Delivery Mode
            19.18.2.3. By End-use
            19.18.2.4. By Usage Methods
            19.18.2.5. By Substances
            19.18.2.6. By Specialties
    19.19. Japan
        19.19.1. Pricing Analysis
        19.19.2. Market Share Analysis, 2023
            19.19.2.1. By Product
            19.19.2.2. By Delivery Mode
            19.19.2.3. By End-use
            19.19.2.4. By Usage Methods
            19.19.2.5. By Substances
            19.19.2.6. By Specialties
    19.20. South Korea
        19.20.1. Pricing Analysis
        19.20.2. Market Share Analysis, 2023
            19.20.2.1. By Product
            19.20.2.2. By Delivery Mode
            19.20.2.3. By End-use
            19.20.2.4. By Usage Methods
            19.20.2.5. By Substances
            19.20.2.6. By Specialties
    19.21. GCC Countries
        19.21.1. Pricing Analysis
        19.21.2. Market Share Analysis, 2023
            19.21.2.1. By Product
            19.21.2.2. By Delivery Mode
            19.21.2.3. By End-use
            19.21.2.4. By Usage Methods
            19.21.2.5. By Substances
            19.21.2.6. By Specialties
    19.22. South Africa
        19.22.1. Pricing Analysis
        19.22.2. Market Share Analysis, 2023
            19.22.2.1. By Product
            19.22.2.2. By Delivery Mode
            19.22.2.3. By End-use
            19.22.2.4. By Usage Methods
            19.22.2.5. By Substances
            19.22.2.6. By Specialties
    19.23. Israel
        19.23.1. Pricing Analysis
        19.23.2. Market Share Analysis, 2023
            19.23.2.1. By Product
            19.23.2.2. By Delivery Mode
            19.23.2.3. By End-use
            19.23.2.4. By Usage Methods
            19.23.2.5. By Substances
            19.23.2.6. By Specialties
20. Market Structure Analysis
    20.1. Competition Dashboard
    20.2. Competition Benchmarking
    20.3. Market Share Analysis of Top Players
        20.3.1. By Regional
        20.3.2. By Product
        20.3.3. By Delivery Mode
        20.3.4. By End-use
        20.3.5. By Usage Methods
        20.3.6. By Substances
        20.3.7. By Specialties
21. Competition Analysis
    21.1. Competition Deep Dive
        21.1.1. Cerner Corporation (Oracle)
            21.1.1.1. Overview
            21.1.1.2. Product Portfolio
            21.1.1.3. Profitability by Market Segments
            21.1.1.4. Sales Footprint
            21.1.1.5. Strategy Overview
                21.1.1.5.1. Marketing Strategy
        21.1.2. Allscripts Healthcare, LLC
            21.1.2.1. Overview
            21.1.2.2. Product Portfolio
            21.1.2.3. Profitability by Market Segments
            21.1.2.4. Sales Footprint
            21.1.2.5. Strategy Overview
                21.1.2.5.1. Marketing Strategy
        21.1.3. Epic Systems Corporation
            21.1.3.1. Overview
            21.1.3.2. Product Portfolio
            21.1.3.3. Profitability by Market Segments
            21.1.3.4. Sales Footprint
            21.1.3.5. Strategy Overview
                21.1.3.5.1. Marketing Strategy
        21.1.4. DrFirst
            21.1.4.1. Overview
            21.1.4.2. Product Portfolio
            21.1.4.3. Profitability by Market Segments
            21.1.4.4. Sales Footprint
            21.1.4.5. Strategy Overview
                21.1.4.5.1. Marketing Strategy
        21.1.5. Athenahealth
            21.1.5.1. Overview
            21.1.5.2. Product Portfolio
            21.1.5.3. Profitability by Market Segments
            21.1.5.4. Sales Footprint
            21.1.5.5. Strategy Overview
                21.1.5.5.1. Marketing Strategy
        21.1.6. NXGN Management, LLC
            21.1.6.1. Overview
            21.1.6.2. Product Portfolio
            21.1.6.3. Profitability by Market Segments
            21.1.6.4. Sales Footprint
            21.1.6.5. Strategy Overview
                21.1.6.5.1. Marketing Strategy
        21.1.7. McKesson Corporation
            21.1.7.1. Overview
            21.1.7.2. Product Portfolio
            21.1.7.3. Profitability by Market Segments
            21.1.7.4. Sales Footprint
            21.1.7.5. Strategy Overview
                21.1.7.5.1. Marketing Strategy
        21.1.8. Surescripts
            21.1.8.1. Overview
            21.1.8.2. Product Portfolio
            21.1.8.3. Profitability by Market Segments
            21.1.8.4. Sales Footprint
            21.1.8.5. Strategy Overview
                21.1.8.5.1. Marketing Strategy
        21.1.9. Change Healthcare
            21.1.9.1. Overview
            21.1.9.2. Product Portfolio
            21.1.9.3. Profitability by Market Segments
            21.1.9.4. Sales Footprint
            21.1.9.5. Strategy Overview
                21.1.9.5.1. Marketing Strategy
        21.1.10. Practice Fusion, Inc.
            21.1.10.1. Overview
            21.1.10.2. Product Portfolio
            21.1.10.3. Profitability by Market Segments
            21.1.10.4. Sales Footprint
            21.1.10.5. Strategy Overview
                21.1.10.5.1. Marketing Strategy
        21.1.11. Networking Technology, Inc. (RXNT)
            21.1.11.1. Overview
            21.1.11.2. Product Portfolio
            21.1.11.3. Profitability by Market Segments
            21.1.11.4. Sales Footprint
            21.1.11.5. Strategy Overview
                21.1.11.5.1. Marketing Strategy
22. Assumptions & Acronyms Used
23. Research Methodology
Recommendations

Healthcare

Digital Patient Monitoring System Market

June 2024

REP-GB-14951

250 pages

Healthcare

Prescription Delivery Service Market

March 2024

REP-GB-12534

342 pages

Explore Healthcare Insights

View Reports
Future Market Insights

ePrescibing Market

Schedule a Call