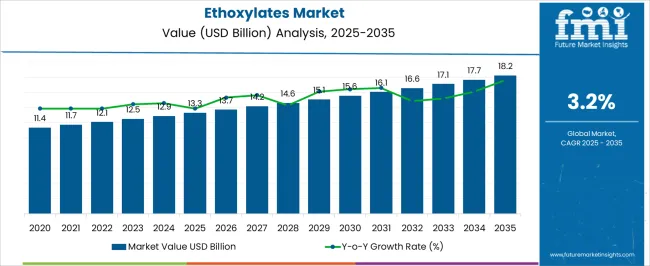
The Ethoxylates Market is estimated to be valued at USD 13.3 billion in 2025 and is projected to reach USD 18.2 billion by 2035, registering a compound annual growth rate (CAGR) of 3.2% over the forecast period.
| Metric | Value |
|---|---|
| Ethoxylates Market Estimated Value in (2025 E) | USD 13.3 billion |
| Ethoxylates Market Forecast Value in (2035 F) | USD 18.2 billion |
| Forecast CAGR (2025 to 2035) | 3.2% |
The ethoxylates market is expanding steadily due to rising demand for nonionic surfactants across industrial, institutional, and household applications. Growing awareness around hygiene, increasing disposable income in emerging economies, and shifting consumer preferences toward effective yet mild cleaning agents have bolstered the use of ethoxylate-based formulations.
These compounds are favored for their emulsifying, wetting, and dispersing properties, which enhance product performance in personal care, fabric care, and agrochemical formulations. In addition, environmental regulations encouraging the use of biodegradable and low-toxicity surfactants are supporting the transition from harsher alternatives to ethoxylates.
Technological advancements in feedstock selection and ethoxylation processes are improving efficiency and product customization. As industries prioritize cost effectiveness, performance enhancement, and regulatory compliance, the market outlook remains positive with considerable opportunities in specialized product development and green chemistry innovations.
The market is segmented by Application and Product and region. By Application, the market is divided into Household and Personal Care, Agrochemicals, Oil and Gas, Pharmaceuticals, and Other Applications. In terms of Product, the market is classified into Alcohol, Fatty Amine, Fatty Acid, Methyl Ester, and Glyceride. Regionally, the market is classified into North America, Latin America, Western Europe, Eastern Europe, Balkan & Baltic Countries, Russia & Belarus, Central Asia, East Asia, South Asia & Pacific, and the Middle East & Africa.
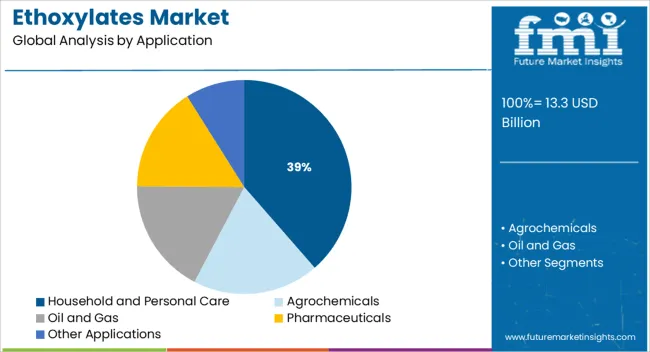
The household and personal care segment is anticipated to contribute 38.60% of the total revenue by 2025, making it the leading application area. Growth in this segment is being driven by rising consumer demand for effective yet gentle cleansing agents used in shampoos, detergents, liquid soaps, and skincare formulations.
Ethoxylates are valued for their excellent emulsifying and foaming properties, which improve product texture and usability while ensuring skin compatibility. Their compatibility with a broad range of ingredients and stability in various pH levels has further increased their usage in home and personal hygiene products.
Additionally, the trend toward sulfate-free and milder surfactant systems has supported the replacement of traditional ingredients with ethoxylates. These factors collectively position household and personal care as the dominant application segment in the ethoxylates market.
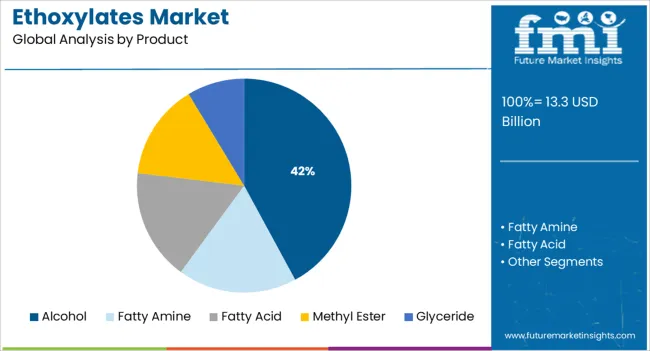
The alcohol-based ethoxylates segment is expected to account for 42.10% of the overall market by 2025, establishing itself as the leading product category. This is attributed to the wide applicability of alcohol ethoxylates in laundry detergents, dishwashing liquids, and surface cleaners.
These compounds offer excellent biodegradability, low aquatic toxicity, and strong cleaning performance, aligning with both consumer preferences and environmental standards. Their favorable ecological profile has made them a preferred choice among formulators seeking regulatory-compliant alternatives to nonylphenol ethoxylates.
Furthermore, alcohol ethoxylates are cost-effective and can be derived from both synthetic and bio-based sources, making them suitable for high-volume production and sustainable formulation strategies. These advantages have positioned alcohol ethoxylates as the cornerstone of product development across a broad spectrum of end-use applications.
The global ethoxylates market size was valued at USD 11.4 Billion in 2020 and exhibited a CAGR of 3% during the historic period. The market is anticipated to be driven by the consumption of ethoxylates across various industries, including personal care, pharmaceutical, industrial, and household cleaning.
The product is widely used as a foaming and wetting agent in detergent and cosmetic product formulations. Owing to these factors the ethoxylates market is anticipated to be valued at USD 18.2 Billion, exhibiting a CAGR of 3.2% by the end of 2035.
The demand for Ethoxylates in the personal care and pharmaceutical industry is fuelling the market growth
The growing consumer awareness of personal care and cleanliness is propelling the global ethoxylate market. Ethoxylates are frequently found in hair care products including shampoos and conditioners because they help in foaming, take away oil, and give the skin a feeling of being exceptionally clean.
In addition, it is estimated that the market will be supported in the forecast period by the rising demand for ointments in the pharmaceutical industry. Ethoxylates are also employed in the textile sector for scouring, dyeing, and lubricating. Additionally, it is predicted that the market would increase in the forthcoming years as a result of the main manufacturers' growing investments and research & development activities.
The global ethoxylate market has witnessed strong growth due to the rising demand for low-rise detergents, which act as a non-ionic surfactants. Besides, the increased use of ethoxylates in personal care products like shampoos and face washes linked with the growing demand from the paints and coating industry will fuel the market during the forecast period.
Most of the market players involved in ethoxylate manufacturing are backward integrated and focused on sustainable sourcing of ethylene oxide, thereby decreasing the manufacturing cost as the major cost incurred in the production process is that of the raw material.
In addition, demand for ethylene oxide is higher among other industries, including automobile, agriculture, food, paints, and plastics, which may result in an uninterrupted supply of raw material, thereby proving to be a major market restraint.
The market exhibits the presence of strict regulations employed by authorities, such as the European Commission and the USA EPA. In addition, the restrictions imposed on the demand for ethoxylates are anticipated to hamper the market growth over the forecast period.
Demand for ethoxylates is also anticipated to be challenged by concerns regarding the toxicity of the products. The surfactants used in coatings, detergents, and cleaners are based on ethoxylates. Ethoxylate products such as alcohol ethoxylates present a threat to sediment organisms and sewage treatment plant organisms, thereby posing a threat to the environment.
In addition, products such as nonylphenol ethoxylates (NPEs) have been found to cause damage to human health and have consequently been banned by several governing agencies, such as the European Union and the government of Canada.
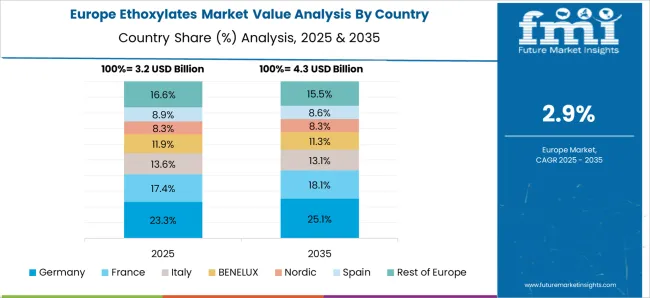
Europe accounted for the largest volume share of 34% in the market in 2020 owing to growing demand from the personal care, pharmaceuticals, and household and industrial cleaning industries. Improving the lifestyle of the people, coupled with heightened awareness regarding personal hygiene, has fueled the consumption of personal care products.
Augmented efforts and initiatives undertaken by the national governments as well as the European Commission in restoring the end-use markets for ethoxylates, including pharmaceuticals and agrochemicals, are anticipated to propel product demand over the forecast period. The aforementioned factors, coupled with the superior properties of the ethoxylates, are anticipated to strengthen regional market growth over the forecast period.
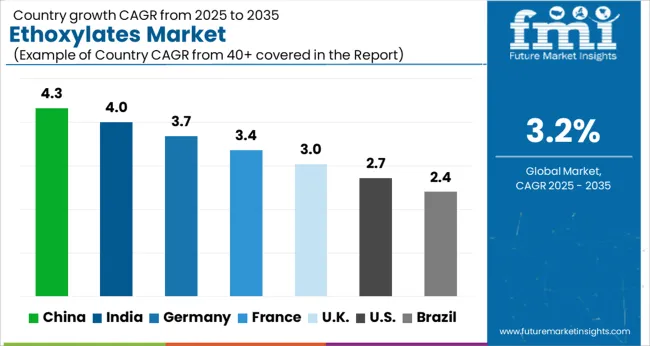
Germany accounts for a considerable share of the overall consumption in the Europe market. Consumption of alcohol ethoxylates is observed to be maximum due to the high demand for the product in industrial and institutional cleaning applications in the alcohol ethoxylates market. The presence of a well-established manufacturing industry also creates demand for industrial products, such as lubricants, which also perform as corrosion inhibitors and emulsifiers for chemical thickening.
In May 2025, the United Kingdom and Sweden governments signed an agreement to build up life sciences strategies that bolster early diagnostics and genomic pharmaceutical manufacturing in both countries. In Addition, the growing demand for fatty alcohol ethoxylates in the United Kingdom, Germany, Italy, and France is supporting the revenue growth of the fatty alcohol ethoxylates market.
The market in North America is expected to register a steady growth rate during the forecast period owing to the rising adoption of cleaning and personal care products across the region, especially in the USA and Canada. Increasing awareness of personal hygiene in the wake of Covid 19 is anticipated to continue to boost demand for cleaning and sanitizing products across countries in the region. In addition, rising demand for low foam and low rinse detergents is supporting the revenue growth of the market in this region.
Asia Pacific’s ethoxylates market is expected to record more than 4.45% CAGR from 2025 to 2035. Changing fashion trends in the region have created high demand for novel textile materials. This is likely to drive the consumption of products such as ethoxylates, which are used for lubricating, finishing, and dyeing fabrics. The increasing demand for ethoxylates in the Asia Pacific is also supported by the steady growth of the agricultural industry in the region. The ethoxylates market from the agrochemical application segment is also showing lucrative prospects. Farmers are increasingly using agrochemicals to increase yield, maintain soil health, and increase land productivity, resulting in increased use of ethoxylates in the agriculture sector. These factors are fueling up the production of organic compounds such as ethoxylates.
The Asia Pacific is the second biggest consumer of ethoxylates after Europe. The market growth in the region can be attributed to the high consumption of ethoxylates due to the rapidly flourishing pharmaceutical, personal care, and cleaning industries in emerging economies, including China, India, Japan, and South Korea. Moreover, the region is one of the largest producers as well as exporters of palm oil with Indonesia and Malaysia constituting around 60% of total world exports. Palm oil is one of the major raw materials used for developing fatty alcohols and amines, which are primary raw materials for obtaining ethoxylates. An uninterrupted supply of materials, coupled with increasing demand for household cleaners, is anticipated to drive product consumption in the region over the forecast period.
The household and personal care application segment accounted for the largest revenue share of 32.2% in 2025 and is expected to sustain its dominance over the forecast period.
The growth in this segment is attributed to its extensive use in the formulation of various household cleanings products, such as laundry detergents in liquid and powder forms, dishwashing gels and detergents, fabric conditioners, glass cleaners, carpet cleaners, oven cleaners, air fresheners, and hard floor and surface cleaners.
The alcohol ethoxylates segment of the ethoxylates market is projected to be worth USD 18.2 Billion by 2035. Alcohol ethoxylates are the most extensively used type of non-ionic surfactant. Alcohol ethoxylates consist of an alkyl chain, which is combined with ethylene oxide.
These are surface active agents, substances that are used to change the surface tension of water to assist in applications such as cleansing, wetting surfaces, foaming, and emulsifying. Being non-ionic surfactants, alcohol ethoxylates can remove grease effectively, which makes them suitable to be used in laundry products, household cleaners, and hand and dishwashing liquids.
Alcohol ethoxylates have many other desirable properties such as moderate foaming ability, superior cleaning of fibers, and high tolerance to water hardness. The demand for alcohol ethoxylates is growing because of their extensive use in the manufacturing of domestic detergents, household and personal care products, and I&I cleaning products.
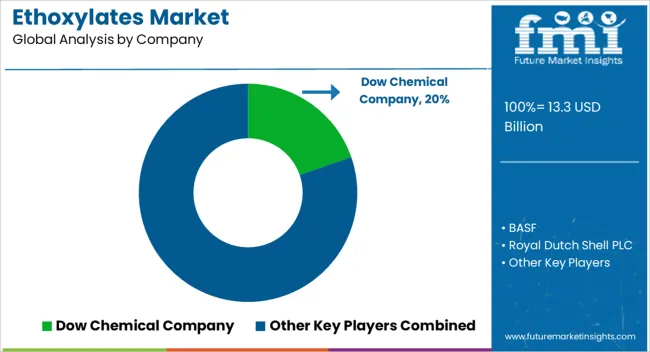
The global ethoxylates market is consolidated with few large and medium-sized players accounting for the majority of market revenue. Major players are deploying various strategies, entering into mergers and acquisitions, strategic agreements and contracts, developing testing, and introducing more effective ethoxylates solutions. some of the major companies included in the global ethoxylates market report are-
Dow chemical company, BASF, Royal Dutch Shell PLC, Petroliam Nasional Berhad, Ecogreen Oleochemicals, PT Polychem Indonesia Tbk, Stepan Company, Clariant, Sasol Limited, India Glycols Ltd, Ineos Group Ltd., Solvay, Oxiteno, Galaxy Surfactants, Nouryon, SABIC, Evonik, Mitsui Chemicals Inc., PCC Exol, Arkema Group.
| Report Attribute | Details |
|---|---|
| Market Value in 2025 | USD 13.3 billion |
| Market Value in 2035 | USD 18.2 billion |
| Growth Rate | CAGR of 3.2% from 2025 to 2035 |
| Base Year for Estimation | 2025 |
| Historical Data | 2020 to 2025 |
| Forecast Period | 2025 to 2035 |
| Quantitative Units | Revenue in USD Billion and CAGR from 2025 to 2035 |
| Report Coverage | Revenue Forecast, Volume Forecast, Company Ranking, Competitive Landscape, Growth Factors, Challenges, Trends, and Pricing Analysis |
| Segments Covered | Products, Application, Region |
| Regions Covered | North America; Latin America; Europe; Asia Pacific; Middle East and Africa(MEA) |
| Key Countries Profiled | USA, Canada, Brazil, Mexico, Germany, United Kingdom, France, Spain, Italy, Australia, New Zealand, China, Japan, South Korea, Indonesia, Singapore, Thailand, GCC Countries, South Africa, Israel |
| Key Companies Profiled | Dow Chemical Company; BASF; Royal Dutch Shell PLC; Petroliam Nasional Berhad; Ecogreen Oleochemicals; PT Polychem Indonesia Tbk; Stepan Company; Clariant; Sasol Limited; India Glycols Ltd; Ineos Group Ltd.; Solvay; Oxiteno; Galaxy Surfactants; Nouryon; SABIC; Evonik; Mitsui Chemicals Inc.; PCC Exol; Arkema Group |
| Customization | Available Upon Request |
The global ethoxylates market is estimated to be valued at USD 13.3 billion in 2025.
The market size for the ethoxylates market is projected to reach USD 18.2 billion by 2035.
The ethoxylates market is expected to grow at a 3.2% CAGR between 2025 and 2035.
The key product types in ethoxylates market are household and personal care, _laundry & dishwashing detergent, _industrial & institutional cleaning, _personal care, agrochemicals, _herbicides, _fungicides, _insecticides, oil and gas, _foam-control & wetting agents, _lubricants & emulsifiers, pharmaceuticals and other applications.
In terms of product, alcohol segment to command 42.1% share in the ethoxylates market in 2025.


Full Research Suite comprises of:
Market outlook & trends analysis
Interviews & case studies
Strategic recommendations
Vendor profiles & capabilities analysis
5-year forecasts
8 regions and 60+ country-level data splits
Market segment data splits
12 months of continuous data updates
DELIVERED AS:
PDF EXCEL ONLINE
Alcohol Ethoxylates Market Demand & Growth 2025-2035
Nonylphenol Ethoxylates Market Size and Share Forecast Outlook 2025 to 2035

Thank you!
You will receive an email from our Business Development Manager. Please be sure to check your SPAM/JUNK folder too.
Chat With
MaRIA