The Exonucleases Market is estimated to be valued at USD 174.1 million in 2025 and is projected to reach USD 218.5 million by 2035, registering a compound annual growth rate (CAGR) of 2.3% over the forecast period.
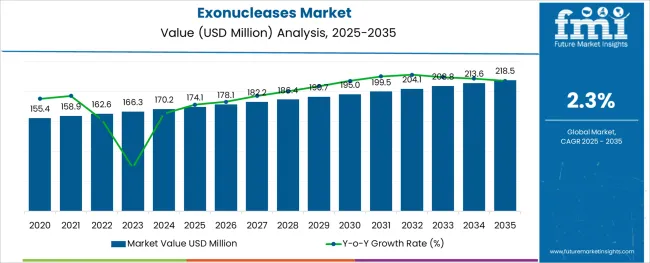
The exonucleases market is experiencing steady expansion, supported by advancements in genomic sequencing, growing investment in molecular diagnostics, and widespread adoption of enzymatic workflows in life sciences. Exonucleases play a vital role in DNA and RNA processing, enabling critical functions such as sequence trimming, primer removal, and genetic fidelity analysis.
Demand has accelerated with the global push toward precision medicine and targeted therapies, where high-quality sequence data is foundational. Technological innovation in enzyme engineering has improved specificity and stability, allowing broader use in automated platforms and high-throughput labs.
Additionally, academic institutions and private sector biotech firms are increasingly incorporating exonucleases into workflows for sequencing, gene editing, and synthetic biology applications. Regulatory backing for molecular testing and the rapid growth of personalized healthcare are expected to open new avenues for enzyme utility and product development.
The market is segmented by Application and End User and region. By Application, the market is divided into Sequencing, Cloning, Polymerase Chain Reaction (PCR), Epigenetics, Restriction Digestion, and Restriction Fragment Length Polymorphism (RFLP). In terms of End User, the market is classified into Biotechnological Companies, Pharmaceutical Companies, Contract Research Organizations, and Academic Research Institutes.
Regionally, the market is classified into North America, Latin America, Western Europe, Eastern Europe, Balkan & Baltic Countries, Russia & Belarus, Central Asia, East Asia, South Asia & Pacific, and the Middle East & Africa.
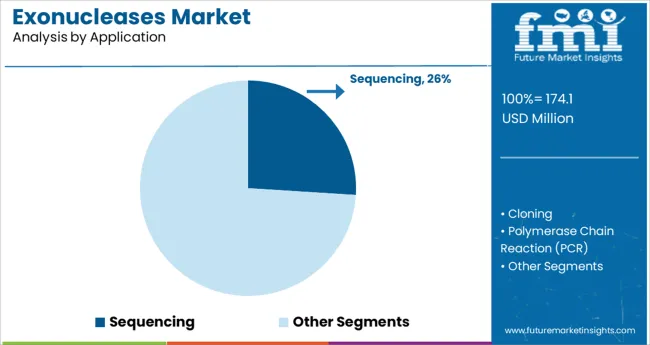
Sequencing is projected to contribute 26.0% of the total revenue share in the exonucleases market in 2025, positioning it as a leading application area. This growth is being fueled by the increased use of exonucleases in next-generation sequencing (NGS) workflows for DNA and RNA library preparation. Their role in trimming nucleotides and removing residual primers enhances read accuracy and reduces error rates, which is critical in clinical diagnostics and large-scale population studies.
Adoption has also been strengthened by the enzyme’s compatibility with automation platforms, allowing high-throughput processing with minimal reagent waste.
As the cost of sequencing continues to decline and global initiatives in genomics expand, the reliance on exonucleases in this segment is expected to grow further, reinforcing its leading position in analytical and diagnostic pipelines.
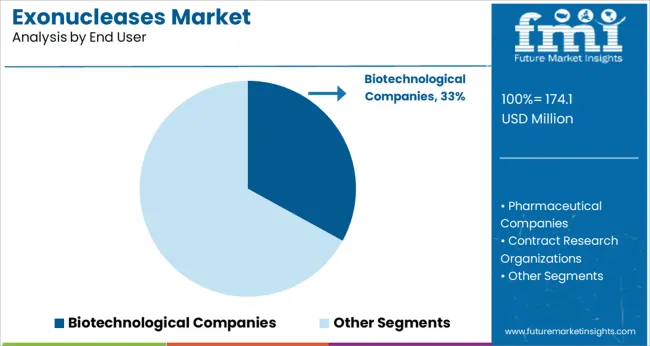
Biotechnological companies are expected to account for 33.0% of the exonucleases market revenue in 2025, making them the largest end-user segment. Their dominance is driven by high demand for reliable enzymatic tools in areas such as gene editing, synthetic biology, and nucleic acid therapeutics development.
These companies depend on exonucleases for precision nucleic acid manipulation, sequence refinement, and assay development across both R&D and commercial production pipelines. The scalability, specificity, and batch-to-batch consistency of commercial exonuclease formulations have reinforced adoption in product development environments.
Additionally, increased investment in biopharma innovation and the commercialization of advanced genomic platforms have positioned biotech firms as key drivers of enzymatic technology demand. With continued pipeline expansion and a focus on molecular precision, biotechnological companies are set to remain the primary consumers in this evolving market.
Rising exonucleases applications such as oligonucleotide post PCR and removal of chromosomal DNA in plasmid preparations drive the market growth. Due to controlling genetic quality, homologous combinations and repairing DNA are likely to increase the exonucleases market share during the forecast period.
Introducing new technology and development will likely increase the overall exonucleases market globally. Other factors, such as the increased use of restriction enzymes in various Research and Development activities in the molecular biology procedure and techniques, also drive the exonucleases market.
Sectors such as biotechnology, pharmaceuticals, contract research organization, and academic research institutes are the prominent drivers in the market. These sectors are flourishing the market growth by adopting several innovations during the forecast period.
The High costs involved in the development of exonucleases production are likely to hinder the growth of the exonucleases market during the forecast period.
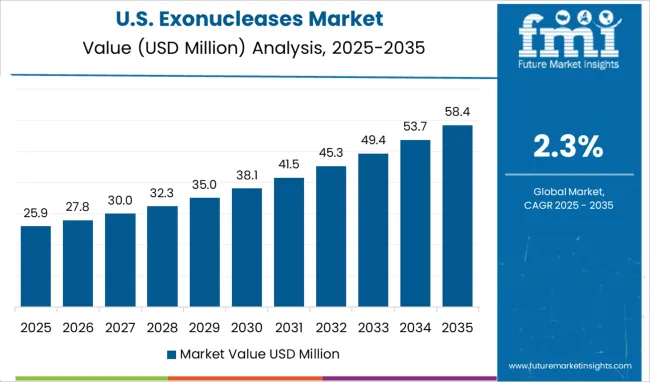
North America dominates the exonucleases market by securing 47.2% of the share during the forecast period. In addition, the presence of a huge well-established molecular biology industry in terms of revenue rapidly boosted the market size in recent years.
The immense pace of research and development activities due to the large presence of biotechnology and pharmaceuticals is increasing the global exonucleases market size. Moreover, favorable government policies aimed at developing these industries flourished in the market during the forecast period.
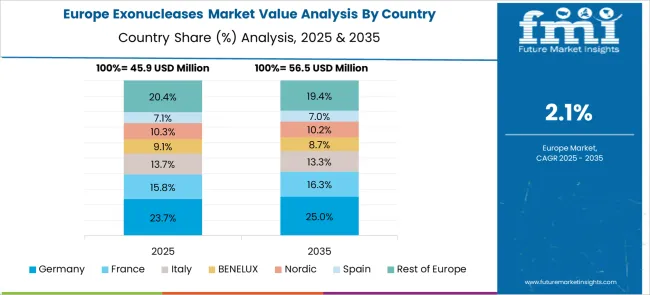
The Europe region placed second position in the exonucleases market by acquiring 32.5% of the share during the forecast period. Rising new vendors and rising extensive products are propelling the demand for exonucleases in recent years. Although there is a significant increase in genomic organization, the operational mechanism of exonucleases remains an active area of research.
Moreover, new techniques such as DNA sequencing and gene expression rapidly rise the region's market. All these factors are accelerating the exonucleases market growth during the forecast period.
All the applications include sequencing, cloning, PCR, restriction digestion, and RFLP. The PCR segment dominates the exonucleases market during the forecast period. In addition, the segment held the largest share, which helps in the diagnosis of hereditary diseases, detect infectious diseases, and identify fingerprints. PCR is used to synthesize new strands in DNA complementary are likely to increase the adoption of PCR applications in recent years.
Start-ups in the exonucleases market industry are now more engaged with launching strategies like targeted marketing, CSR programs, etc., to increase their global prominence. The fact that these businesses are now aiming to handle a certain business-related activity in a nation that offers advantageous legislation is a discernible trend being noted across the board.
This enables start-ups to save expenses while retaining industry experts for each crucial stage of their respective organizations. By cutting trade taxes and duties, governments in developing nations like India, China, Taiwan, and Indonesia, among others, are introducing measures to entice international investors to the corresponding industrial sectors and create more jobs.
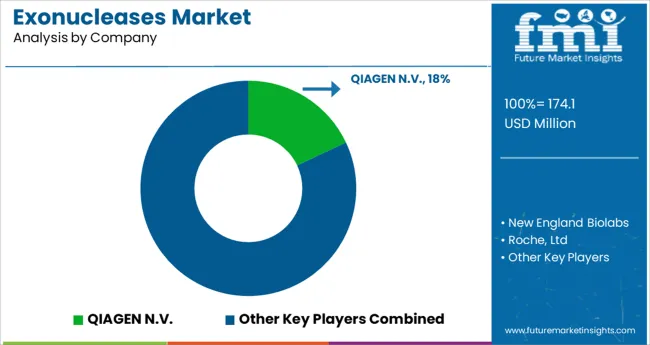
To increase their separate consumer bases, key players in the global exonucleases market are now concentrating more on forming successful joint ventures, acquisitions, and/or collaborations. By being able to serve their assigned target bases both domestically and abroad, companies stand to increase them.
Over the course of the forecast period, it is predicted that this factor, together with promising developments in developing countries from the Asia-Pacific region, including India, China, Taiwan, Indonesia, etc., would greatly increase the commercial opportunities for key players in the global exonucleases market.
Recent Developments in the Exonucleases Market:
| Report Attribute | Details |
|---|---|
| Growth Rate | CAGR of 2.3% from 2025 to 2035 |
| Base Year for Estimation | 2024 |
| Historical Data | 2020 to 2024 |
| Forecast Period | 2025 to 2035 |
| Quantitative Units | Revenue in million and CAGR from 2025 to 2035 |
| Report Coverage | Revenue Forecast, Volume Forecast, Company Ranking, Competitive Landscape, Growth Factors, Trends, and Pricing Analysis |
| Segments Covered | Application, End User, Region |
| Regions Covered | North America; Latin America; Europe; East Asia; South Asia; Oceania; Middle East and Africa |
| Key Countries Profiled | USA, Canada, Brazil, Argentina, Germany, UK, France, Spain, Italy, Nordics, BENELUX, Australia & New Zealand, China, India, ASIAN, GCC Countries, South Africa |
| Key Companies Profiled | QIAGEN N.V.; New England Biolabs; Roche, Ltd; Thermo Fisher Scientific, Inc; Takara Bio, Inc; Agilent Technologies, Inc; Affymetrix, Inc; Illumina, Inc |
| Customization | Available Upon Request |
The global exonucleases market is estimated to be valued at USD 174.1 million in 2025.
It is projected to reach USD 218.5 million by 2035.
The market is expected to grow at a 2.3% CAGR between 2025 and 2035.
The key product types are sequencing, cloning, polymerase chain reaction (pcr), epigenetics, restriction digestion and restriction fragment length polymorphism (rflp).
biotechnological companies segment is expected to dominate with a 33.0% industry share in 2025.


Our Research Products

The "Full Research Suite" delivers actionable market intel, deep dives on markets or technologies, so clients act faster, cut risk, and unlock growth.

The Leaderboard benchmarks and ranks top vendors, classifying them as Established Leaders, Leading Challengers, or Disruptors & Challengers.

Locates where complements amplify value and substitutes erode it, forecasting net impact by horizon

We deliver granular, decision-grade intel: market sizing, 5-year forecasts, pricing, adoption, usage, revenue, and operational KPIs—plus competitor tracking, regulation, and value chains—across 60 countries broadly.

Spot the shifts before they hit your P&L. We track inflection points, adoption curves, pricing moves, and ecosystem plays to show where demand is heading, why it is changing, and what to do next across high-growth markets and disruptive tech

Real-time reads of user behavior. We track shifting priorities, perceptions of today’s and next-gen services, and provider experience, then pace how fast tech moves from trial to adoption, blending buyer, consumer, and channel inputs with social signals (#WhySwitch, #UX).

Partner with our analyst team to build a custom report designed around your business priorities. From analysing market trends to assessing competitors or crafting bespoke datasets, we tailor insights to your needs.
Supplier Intelligence
Discovery & Profiling
Capacity & Footprint
Performance & Risk
Compliance & Governance
Commercial Readiness
Who Supplies Whom
Scorecards & Shortlists
Playbooks & Docs
Category Intelligence
Definition & Scope
Demand & Use Cases
Cost Drivers
Market Structure
Supply Chain Map
Trade & Policy
Operating Norms
Deliverables
Buyer Intelligence
Account Basics
Spend & Scope
Procurement Model
Vendor Requirements
Terms & Policies
Entry Strategy
Pain Points & Triggers
Outputs
Pricing Analysis
Benchmarks
Trends
Should-Cost
Indexation
Landed Cost
Commercial Terms
Deliverables
Brand Analysis
Positioning & Value Prop
Share & Presence
Customer Evidence
Go-to-Market
Digital & Reputation
Compliance & Trust
KPIs & Gaps
Outputs
Full Research Suite comprises of:
Market outlook & trends analysis
Interviews & case studies
Strategic recommendations
Vendor profiles & capabilities analysis
5-year forecasts
8 regions and 60+ country-level data splits
Market segment data splits
12 months of continuous data updates
DELIVERED AS:
PDF EXCEL ONLINE

Thank you!
You will receive an email from our Business Development Manager. Please be sure to check your SPAM/JUNK folder too.
Chat With
MaRIA