Galactose Market Outlook and Forecast 2025 to 2035

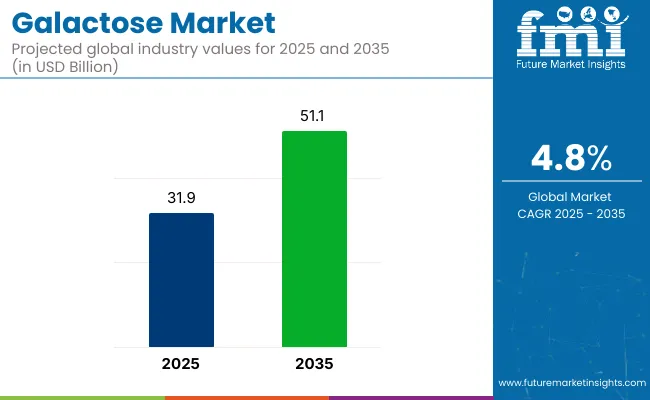
The global galactose market is valued at USD 31.9 billion in 2025 and is slated to reach USD 51.1 billion by 2035 with a robust CAGR of 4.8%. This growth is being driven by increasing adoption of functional food ingredients, rising demand for lactose-free formulations, and expanding use in biotechnology and pharmaceutical applications.
Quick Stats of Galactose Market

  • Market Value (2025): USD 31.9 billion
  • Forecast Value (2035): USD 51.1 billion
  • Forecast CAGR: 4.8%
  • Product Leader in 2025: D-Galactose (72.0% market share)
  • Top Source Segment in 2025: Plant-Derived Sugar (68.0% market share)
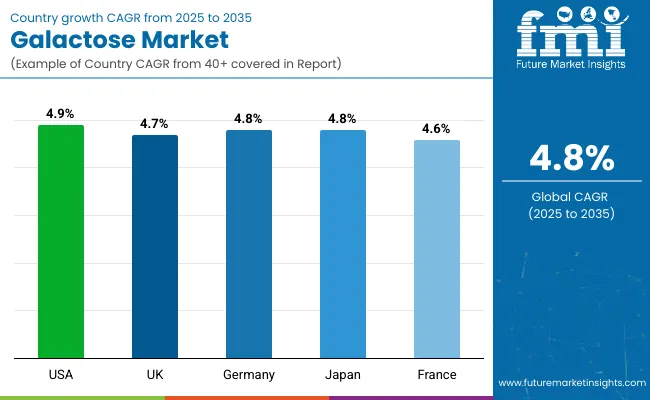
  • Key Growth Country: USA(fastest-growing market with 4.9% CAGR)

Galactose Market

Attribute Value
Market Size in 2025 USD 31.9 billion
Market Size in 2035 USD 51.1 Billion
CAGR (2025 to 2035) 4.8%

Additionally, heightened interest in clean-label and plant-based dietary preferences is expected to support the ongoing penetration of galactose across both developed and emerging markets.

The market is being shaped by innovations in enzyme processing, integration of AI for cost control, and demand for vegan-friendly, non-dairy alternatives. Companies are focusing on hybrid solutions combining galactose with prebiotics, skincare formulations, and medical nutrition. Rising health consciousness and expanding clinical use cases are forecasted to provide long-term stability and opportunity in this evolving market.

Within the galactose market, the plant-derived sugar segment is expected to register the highest growth in the source category, while accounting for 68.0% of the market share in 2025. In the product type segment, D-galactose is projected to grow at the fastest rate, capturing a dominant 72.0% share of the segment.

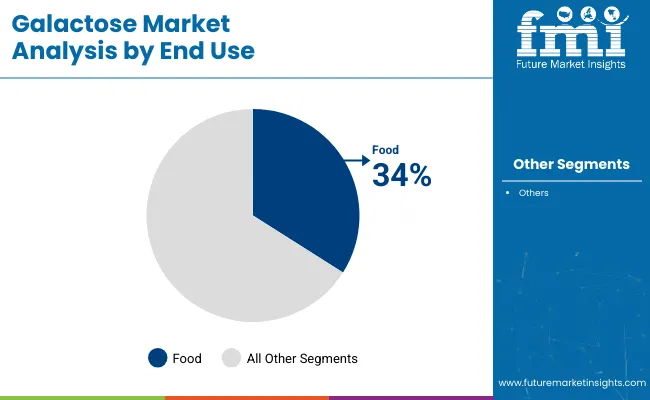
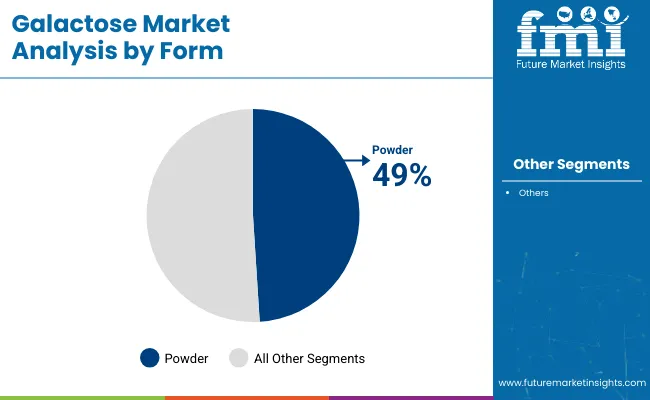
Among the various forms, powdered galactose is forecasted to hold a 49.0% market share in 2025, due to its superior shelf life and formulation compatibility. In terms of end use, the pharmaceutical segment is anticipated to expand most rapidly, while the food segment is expected to lead the category with a 34.0% market share. On a country level, the USA is projected to be the fastest-growing market, with a CAGR of 4.9% from 2025 to 2035, supported by enzyme-based innovations and rising demand for functional sugar alternatives.

Ongoing research and development efforts are being intensified to enhance the therapeutic potential of galactose, particularly in treating metabolic disorders such as galactosemia and neurodevelopmental applications. Collaborations between biotechnology firms and academic institutions are being strengthened to create advanced formulations with higher bioavailability and stability.

Analyzing Galactose Market by Top Investment Segments

The market is segmented into source, product type, form, end use, and region. By source, the market is divided into plant-derived sugar and synthetic sugar. Based on product type, the market is categorized into D-galactose and L-galactose.

In terms of form, the market is segmented into powder, liquid, and crystal. In terms of end use, the market is segmented into food (bakery goods, sweet spreads, confectionery, dairy products, and canned food), beverages (carbonated drinks, fruit drinks and juices, powdered drinks and mixers, and alcoholic beverages), pharmaceuticals, personal care, biofuel industry, and animal feed industry. Regionally, the market is classified into North America, Latin America, Western Europe, Eastern Europe, East Asia, South Asia Pacific, and Middle East and Africa.
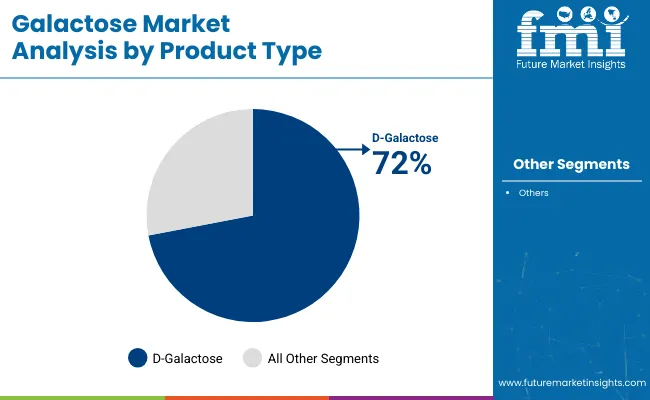
D-Galactose to Lead the Product Type Segment with 72% Market Share

D-galactose is projected to lead the product type segment, accounting for 72% of the global market share by 2025. This monosaccharide has been recognized as a critical ingredient in pharmaceutical, biotechnological, and functional food applications due to its structural compatibility and biological functions.
  • D-galactose has been widely utilized in glycoprotein synthesis and cell metabolism research.
  • Its importance in vaccine production and therapeutic protein development has elevated its market relevance.
  • Extensive application in skincare and neuroprotective formulations has been observed.
  • Purity optimization through AI-driven fermentation methods has significantly enhanced its commercial value.

Galactose Market Analysis By Product Type

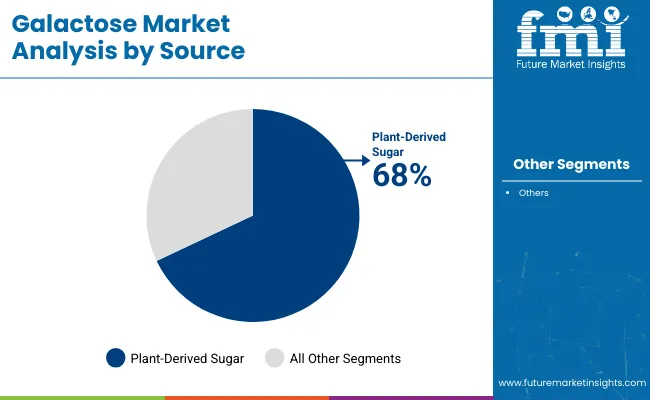
Plant-Derived Sugar to Lead the Source Segment with 68% Market Share

The plant-derived sugar segment is expected to lead the source category, securing 68% of the global market share by 2025. Known for its clean-label positioning and natural origin, this segment has been favored for food, nutraceutical, and infant formula applications.
  • Plant-derived sugar has been sourced from pectins and hemicelluloses in fruits and vegetables.
  • Its alignment with vegan, organic, and non-GMO product standards has boosted adoption.
  • Its role in prebiotic and synbiotic formulations has enhanced digestive health applications.
  • Eco-friendly sourcing and sustainable extraction processes have improved brand value for suppliers.

Galactose Market Analysis By Source

Food Segment to Lead the End Use Category with 34% Market Share

The food segment is anticipated to lead the end-use category, capturing 34% of the global market share in 2025. Consistent demand for low-lactose and functional sugar alternatives in processed and health-focused foods has been driving this trend.
  • Galactose has been integrated into dairy-free, bakery, and confectionery products for improved gut tolerance.
  • Consumer preference for clean sugar alternatives has supported its inclusion in dietary food lines.
  • Rising use in infant nutrition and medical food categories has elevated demand stability.
  • Growing interest in sugar reduction without taste compromise has reinforced galactose adoption.

Galactose Market Analysis By End Use

Powder Form to Lead the Form Segment with 49% Market Share

The powder segment is expected to dominate the form category, capturing 49% of the global market share by 2025. Its widespread use in pharmaceuticals, dietary supplements, and functional food products has been driven by its superior stability, ease of handling, and long shelf life.

  • Powdered galactose has been preferred due to its efficient blending and precise dosage control in formulations.
  • Stability during transportation and storage has enhanced its suitability for global distribution.
  • Compatibility with encapsulation and dry-mix production formats has boosted its usage in nutraceuticals.
  • Lower moisture content has improved its performance in lactose-free and sugar-replacement applications.

Galactose Market Analysis By Form

Top Galactose Market Dynamics

The galactose market is witnessing consistent expansion, fueled by rising demand for lactose-free nutritional ingredients, advancements in fermentation-based synthesis, and growing adoption across pharmaceutical, functional food, and biotechnology sectors.

Recent Trends in the Galactose Market

  • The integration of AI-powered purification technologies has been accelerated to enhance galactose yield and bioavailability.
  • Hybrid formulations combining D-galactose with prebiotics and synbiotics have been increasingly developed.
  • Clean-label and plant-derived galactose ingredients have been prioritized by food and beverage manufacturers.
  • Pharmaceutical-grade galactose production has been scaled for metabolic and neurodevelopmental treatments.
  • Increased investment in research targeting galactosemia and enzyme-deficiency disorders has been recorded.

Challenges in the Galactose Market

  • High production costs and limited raw material accessibility have been reported, especially for pharmaceutical-grade purity.
  • Low consumer awareness compared to other functional sugars such as glucose or lactose has continued to restrict broader adoption.
  • Supply chain disruptions and inconsistent quality standards in emerging regions have impacted manufacturing consistency.
  • Stringent regulatory compliance in the EU and North America has posed operational complexities for small-scale producers.
  • Dependence on high-end enzyme technology has increased entry barriers for new players.

Analyzing Top Countries Distributing and Supplying Galactose

Galactose Market Country Wise Analysis

USA Galactose Market Analysis

The USA galactose market is expected to grow at a CAGR of 4.9% from 2025 to 2035. Growth is being supported by high demand for lactose-free and functional sugar products in pharmaceuticals and dietary supplements. Advanced enzyme synthesis technologies and expanded clinical research on galactose's role in cognitive health have contributed to robust market traction.

UK Galactose Market Analysis

The UK galactose market is projected to expand at a CAGR of 4.7% during the forecast period. Market growth is being fueled by consumer preference for lactose-free foods, regulatory incentives for plant-based sugar alternatives, and research investments in galactose-rich medicinal compounds.

Galactose Demand Analysis in Germany

Germany’s galactose market is forecasted to grow at a CAGR of 4.8% from 2025 to 2035. As a biotechnology leader within the EU, Germany has prioritized galactose for use in pharmaceuticals, synbiotics, and dietary innovations. Industrial-grade D-galactose is produced for advanced medical applications.

Japan Galactose Market Analysis

Japan’s galactose market is expected to expand at a CAGR of 4.8% through 2035. High prevalence of lactose intolerance and the country's leadership in functional food innovation are driving galactose consumption. Plant-derived and enzymatically synthesized galactose solutions are favored in both health and cosmetic sectors.

France Galactose Market Analysis

France’s galactose market is projected to grow at a CAGR of 4.6% from 2025 to 2035, supported by increasing demand for functional sugars in medical nutrition and personal care. The country’s leadership in pharmaceutical-grade carbohydrate innovation and regulatory emphasis on clean-label products are driving the expansion of galactose applications.
Leading Galactose Suppliers

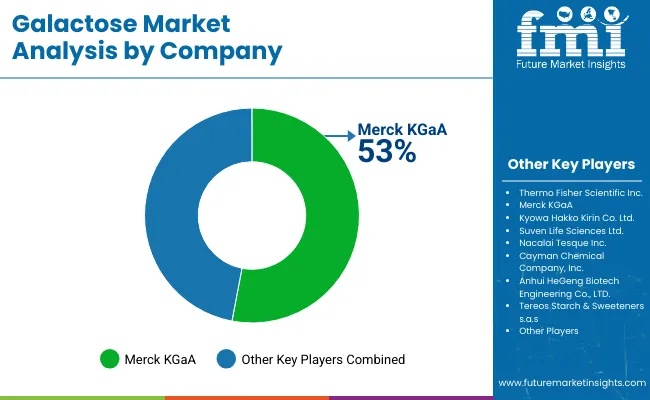
The galactose market is moderately consolidated, with several global leaders such as Merck KGaA, Thermo Fisher Scientific Inc., DuPont de Nemours, Inc. (IFF), and Kyowa Hakko Bio Co., Ltd.accounting for significant revenue shares. These companies are competing through innovations in enzymatic synthesis, AI-driven purification, and sustainable production methods. Strategic partnerships and acquisitions are being pursued to expand product portfolios and reach global audiences.

Company strategies have been centered on enhancing production efficiency, ensuring high-purity outputs, and meeting the growing demand for plant-based and lactose-free products. Investments in research and development have been made to explore novel applications of galactose in pharmaceuticals, nutraceuticals, and functional foods. Additionally, collaborations with biotech firms and dietary supplement brands have been established to broaden application scope.

Recent Galactose Industry News:

  • In February 2025, Thermo Fisher Scientific Inc. unveiled to acquire Solventum’s purification business to boost its position.
  • In September 2024, Cargill announced the acquisition of USA feed mills to boost its production and distribution capabilities.

Report Scope Table - Galactose Market

Report Attributes Details
Current Total Market Size (2025) USD 31.9 billion
Projected Market Size (2035) USD 51.1 billion
CAGR (2025 to 2035) 4.8%
Base Year for Estimation 2024
Historical Period 2020 to 2024
Projections Period 2025 to 2035
Quantitative Units USD billion for dollar sales
Sources Analyzed (Segment 1) Plant Derived Sugar, Synthetic Sugar
Product Types Analyzed (Segment 2) D-Galactose, L-Galactose
Forms Analyzed (Segment 3) Powder, Liquid, Crystal
End-uses Analyzed (Segment 4) Food (Bakery Goods, Sweet Spreads, Confectionery, Dairy Products, Canned Food), Beverage (Carbonated Drinks, Fruit Drink and Juice, Powdered Drinks and Mixers, Alcoholic Beverages), Pharmaceuticals, Personal Care, Biofuel Industry, Animal Feed Industry
Regions Covered North America, Latin America, Western Europe, Eastern Europe, East Asia, South Asia Pacific, Middle East and Africa
Countries Covered United States, Canada, Mexico, Brazil, Argentina, Germany, France, United Kingdom, Italy, Spain, Netherlands, China, India, Japan, South Korea, ANZ, GCC Countries, South Africa
Key Players influencing the Galactose Market Thermo Fisher Scientific Inc., Merck KGaA, Kyowa Hakko Kirin Co., Ltd., Suven Life Sciences Ltd., Nacalai Tesque Inc., Cayman Chemical Company, Inc., Anhui HeGeng Biotech Engineering Co., LTD., Tereos Starch & Sweeteners s.a.s, Cambridge Isotope Laboratories, Inc., Zhejiang Yixin Pharmaceutical Co., Ltd.
Additional Attributes dollar sales, CAGR trends, source-based demand, product type distribution, form-based preferences, end-use industry share, competitor dollar sales & market share, regional growth patterns

Key Segmentation

By Source:

  • Plant Derived Sugar
  • Synthetic Sugar

By Product Type:

  • D-Galactose
  • L-Galactose

By Form:

  • Powder
  • Liquid
  • Crystal

By End Use:

  • Food
    • Bakery Goods
    • Sweet Spreads
    • Confectionary
    • Dairy Products
    • Canned Food
  • Beverage
    • Carbonated Drinks
    • Fruit Drink and Juice
    • Powdered Drinks and Mixers
    • Alcoholic Beverages
  • Pharmaceuticals
  • Personal Care
  • Biofuel Industry
  • Animal Feed Industry

By Region:

  • North America
  • Latin America
  • Western Europe
  • Eastern Europe
  • East Asia
  • South Asia Pacific
  • Middle East and Africa

Table of Content

  1. Executive Summary
    • Global Market Outlook
    • Demand-side Trends
    • Supply-side Trends
    • Technology Roadmap Analysis
    • Analysis and Recommendations
  2. Market Overview
    • Market Coverage / Taxonomy
    • Market Definition / Scope / Limitations
  3. Market Background
    • Market Dynamics
      • Drivers
      • Restraints
      • Opportunity
      • Trends
    • Scenario Forecast
      • Demand in Optimistic Scenario
      • Demand in Likely Scenario
      • Demand in Conservative Scenario
    • Opportunity Map Analysis
    • Product Life Cycle Analysis
    • Supply Chain Analysis
      • Supply Side Participants and their Roles
        • Producers
        • Mid-Level Participants (Traders/ Agents/ Brokers)
        • Wholesalers and Distributors
      • Value Added and Value Created at Node in the Supply Chain
      • List of Raw Material Suppliers
      • List of Existing and Potential Buyer’s
    • Investment Feasibility Matrix
    • Value Chain Analysis
      • Profit Margin Analysis
      • Wholesalers and Distributors
      • Retailers
    • PESTLE and Porter’s Analysis
    • Regulatory Landscape
      • By Key Regions
      • By Key Countries
    • Regional Parent Market Outlook
    • Production and Consumption Statistics
    • Import and Export Statistics
  4. Global Market Analysis 2020 to 2024 and Forecast, 2025 to 2035
    • Historical Market Size Value (USD Billion) & Volume (Metric Ton) Analysis, 2020 to 2024
    • Current and Future Market Size Value (USD Billion) & Volume (Metric Ton) Projections, 2025 to 2035
      • Y-o-Y Growth Trend Analysis
      • Absolute $ Opportunity Analysis
  5. Global Market Pricing Analysis 2020 to 2024 and Forecast 2025 to 2035
  6. Global Market Analysis 2020 to 2024 and Forecast 2025 to 2035, By Source
    • Introduction / Key Findings
    • Historical Market Size Value (USD Billion) & Volume (Metric Ton) Analysis By Source, 2020 to 2024
    • Current and Future Market Size Value (USD Billion) & Volume (Metric Ton) Analysis and Forecast By Source, 2025 to 2035
      • Plant Derived Sugar
      • Synthetic Sugar
    • Y-o-Y Growth Trend Analysis By Source, 2020 to 2024
    • Absolute $ Opportunity Analysis By Source, 2025 to 2035
  7. Global Market Analysis 2020 to 2024 and Forecast 2025 to 2035, By Product Type
    • Introduction / Key Findings
    • Historical Market Size Value (USD Billion) & Volume (Metric Ton) Analysis By Product Type, 2020 to 2024
    • Current and Future Market Size Value (USD Billion) & Volume (Metric Ton) Analysis and Forecast By Product Type, 2025 to 2035
      • D-Galactose
      • L-Galactose
    • Y-o-Y Growth Trend Analysis By Product Type, 2020 to 2024
    • Absolute $ Opportunity Analysis By Product Type, 2025 to 2035
  8. Global Market Analysis 2020 to 2024 and Forecast 2025 to 2035, By Form
    • Introduction / Key Findings
    • Historical Market Size Value (USD Billion) & Volume (Metric Ton) Analysis By Form, 2020 to 2024
    • Current and Future Market Size Value (USD Billion) & Volume (Metric Ton) Analysis and Forecast By Form, 2025 to 2035
      • Powder
      • Liquid
      • Crystal
    • Y-o-Y Growth Trend Analysis By Form, 2020 to 2024
    • Absolute $ Opportunity Analysis By Form, 2025 to 2035
  9. Global Market Analysis 2020 to 2024 and Forecast 2025 to 2035, By End Use
    • Introduction / Key Findings
    • Historical Market Size Value (USD Billion) & Volume (Metric Ton) Analysis By End Use, 2020 to 2024
    • Current and Future Market Size Value (USD Billion) & Volume (Metric Ton) Analysis and Forecast By End Use, 2025 to 2035
      • Food
        • Bakery Goods
        • Sweet Spreads
        • Confectionary
        • Dairy Products
        • Canned Food
      • Beverage
        • Carbonated Drinks
        • Fruit Drink and Juice
        • Powdered Drinks and Mixers
        • Alcoholic Beverages
      • Pharmaceuticals
      • Personal Care
      • Biofuel Industry
      • Animal Feed Industry
    • Y-o-Y Growth Trend Analysis By End Use, 2020 to 2024
    • Absolute $ Opportunity Analysis By End Use, 2025 to 2035
  10. Global Market Analysis 2020 to 2024 and Forecast 2025 to 2035, By Region
    • Introduction
    • Historical Market Size Value (USD Billion) & Volume (Metric Ton) Analysis By Region, 2020 to 2024
    • Current Market Size Value (USD Billion) & Volume (Metric Ton) Analysis and Forecast By Region, 2025 to 2035
      • North America
      • Latin America
      • Western Europe
      • Eastern Europe
      • East Asia
      • South Asia & Pacific
      • Middle East and Africa
    • Market Attractiveness Analysis By Region
  11. North America Market Analysis 2020 to 2024 and Forecast 2025 to 2035, By Country
    • Historical Market Size Value (USD Billion) & Volume (Metric Ton) Trend Analysis By Market Taxonomy, 2020 to 2024
    • Market Size Value (USD Billion) & Volume (Metric Ton) Forecast By Market Taxonomy, 2025 to 2035
      • By Country
        • USA
        • Canada
        • Mexico
      • By Source
      • By Product Type
      • By Form
      • By End Use
    • Market Attractiveness Analysis
      • By Country
      • By Source
      • By Product Type
      • By Form
      • By End Use
    • Key Takeaways
  12. Latin America Market Analysis 2020 to 2024 and Forecast 2025 to 2035, By Country
    • Historical Market Size Value (USD Billion) & Volume (Metric Ton) Trend Analysis By Market Taxonomy, 2020 to 2024
    • Market Size Value (USD Billion) & Volume (Metric Ton) Forecast By Market Taxonomy, 2025 to 2035
      • By Country
        • Brazil
        • Argentina
        • Rest of LATAM
      • By Source
      • By Product Type
      • By Form
      • By End Use
    • Market Attractiveness Analysis
      • By Country
      • By Source
      • By Product Type
      • By Form
      • By End Use
    • Key Takeaways
  13. Western Europe Market Analysis 2020 to 2024 and Forecast 2025 to 2035, By Country
    • Historical Market Size Value (USD Billion) & Volume (Metric Ton) Trend Analysis By Market Taxonomy, 2020 to 2024
    • Market Size Value (USD Billion) & Volume (Metric Ton) Forecast By Market Taxonomy, 2025 to 2035
      • By Country
        • Germany
        • Italy
        • France
        • UK
        • Spain
        • BENELUX
        • Nordic
        • Rest of W.Europe
      • By Source
      • By Product Type
      • By Form
      • By End Use
    • Market Attractiveness Analysis
      • By Country
      • By Source
      • By Product Type
      • By Form
      • By End Use
    • Key Takeaways
  14. Eastern Europe Market Analysis 2020 to 2024 and Forecast 2025 to 2035, By Country
    • Historical Market Size Value (USD Billion) & Volume (Metric Ton) Trend Analysis By Market Taxonomy, 2020 to 2024
    • Market Size Value (USD Billion) & Volume (Metric Ton) Forecast By Market Taxonomy, 2025 to 2035
      • By Country
        • Russia
        • Hungary
        • Poland
        • Balkan & Baltics
        • Rest of E. Europe
      • By Source
      • By Product Type
      • By Form
      • By End Use
    • Market Attractiveness Analysis
      • By Country
      • By Source
      • By Product Type
      • By Form
      • By End Use
    • Key Takeaways
  15. East Asia Market Analysis 2020 to 2024 and Forecast 2025 to 2035, By Country
    • Historical Market Size Value (USD Billion) & Volume (Metric Ton) Trend Analysis By Market Taxonomy, 2020 to 2024
    • Market Size Value (USD Billion) & Volume (Metric Ton) Forecast By Market Taxonomy, 2025 to 2035
      • By Country
        • China
        • Japan
        • South Korea
      • By Source
      • By Product Type
      • By Form
      • By End Use
    • Market Attractiveness Analysis
      • By Country
      • By Source
      • By Product Type
      • By Form
      • By End Use
    • Key Takeaways
  16. South Asia & Pacific Market Analysis 2020 to 2024 and Forecast 2025 to 2035, By Country
    • Historical Market Size Value (USD Billion) & Volume (Metric Ton) Trend Analysis By Market Taxonomy, 2020 to 2024
    • Market Size Value (USD Billion) & Volume (Metric Ton) Forecast By Market Taxonomy, 2025 to 2035
      • By Country
        • India
        • Australia & New Zealand
        • ASEAN
        • Rest of SAP
      • By Source
      • By Product Type
      • By Form
      • By End Use
    • Market Attractiveness Analysis
      • By Country
      • By Source
      • By Product Type
      • By Form
      • By End Use
    • Key Takeaways
  17. Middle East and Africa Market Analysis 2020 to 2024 and Forecast 2025 to 2035, By Country
    • Historical Market Size Value (USD Billion) & Volume (Metric Ton) Trend Analysis By Market Taxonomy, 2020 to 2024
    • Market Size Value (USD Billion) & Volume (Metric Ton) Forecast By Market Taxonomy, 2025 to 2035
      • By Country
        • GCC Countries
        • Northern Africa
        • South Africa
        • Turkiye
        • Rest of MEA
      • By Source
      • By Product Type
      • By Form
      • By End Use
    • Market Attractiveness Analysis
      • By Country
      • By Source
      • By Product Type
      • By Form
      • By End Use
    • Key Takeaways
  18. Key Countries Market Analysis
    • USA
      • Pricing Analysis
      • Market Share Analysis, 2024
        • By Source
        • By Product Type
        • By Form
        • By End Use
    • Canada
      • Pricing Analysis
      • Market Share Analysis, 2024
        • By Source
        • By Product Type
        • By Form
        • By End Use
    • Brazil
      • Pricing Analysis
      • Market Share Analysis, 2024
        • By Source
        • By Product Type
        • By Form
        • By End Use
    • Mexico
      • Pricing Analysis
      • Market Share Analysis, 2024
        • By Source
        • By Product Type
        • By Form
        • By End Use
    • Argentina
      • Pricing Analysis
      • Market Share Analysis, 2024
        • By Source
        • By Product Type
        • By Form
        • By End Use
  19. Market Structure Analysis
    • Competition Dashboard
    • Competition Benchmarking
    • Market Share Analysis of Top Players
      • By Regional
      • By Source
      • By Product Type
      • By Form
      • By End Use
  20. Competition Analysis
    • Competition Deep Dive
      • Thermo Fisher Scientific Inc.
        • Overview
        • Product Portfolio
        • Profitability by Market Segments (Product/Age /Sales Channel/Region)
        • Sales Footprint
        • Strategy Overview
          • Marketing Strategy
          • Product Strategy
          • Channel Strategy
      • Merck KGaA
        • Overview
        • Product Portfolio
        • Profitability by Market Segments (Product/Age /Sales Channel/Region)
        • Sales Footprint
        • Strategy Overview
          • Marketing Strategy
          • Product Strategy
          • Channel Strategy
      • Kyowa Hakko Kirin Co., Ltd.
        • Overview
        • Product Portfolio
        • Profitability by Market Segments (Product/Age /Sales Channel/Region)
        • Sales Footprint
        • Strategy Overview
          • Marketing Strategy
          • Product Strategy
          • Channel Strategy
      • Suven Life Sciences Ltd.
        • Overview
        • Product Portfolio
        • Profitability by Market Segments (Product/Age /Sales Channel/Region)
        • Sales Footprint
        • Strategy Overview
          • Marketing Strategy
          • Product Strategy
          • Channel Strategy
      • Nacalai Tesque Inc
        • Overview
        • Product Portfolio
        • Profitability by Market Segments (Product/Age /Sales Channel/Region)
        • Sales Footprint
        • Strategy Overview
          • Marketing Strategy
          • Product Strategy
          • Channel Strategy
      • Cayman Chemical Company, Inc.
        • Overview
        • Product Portfolio
        • Profitability by Market Segments (Product/Age /Sales Channel/Region)
        • Sales Footprint
        • Strategy Overview
          • Marketing Strategy
          • Product Strategy
          • Channel Strategy
      • Anhui HeGeng Biotech Engineering Co., LTD.
        • Overview
        • Product Portfolio
        • Profitability by Market Segments (Product/Age /Sales Channel/Region)
        • Sales Footprint
        • Strategy Overview
          • Marketing Strategy
          • Product Strategy
          • Channel Strategy
      • Tereos Starch & Sweeteners s.a.s
        • Overview
        • Product Portfolio
        • Profitability by Market Segments (Product/Age /Sales Channel/Region)
        • Sales Footprint
        • Strategy Overview
          • Marketing Strategy
          • Product Strategy
          • Channel Strategy
      • Cambridge Isotope Laboratories, Inc.
        • Overview
        • Product Portfolio
        • Profitability by Market Segments (Product/Age /Sales Channel/Region)
        • Sales Footprint
        • Strategy Overview
          • Marketing Strategy
          • Product Strategy
          • Channel Strategy
      • Zhejiang Yixin Pharmaceutical Co., Ltd.
        • Overview
        • Product Portfolio
        • Profitability by Market Segments (Product/Age /Sales Channel/Region)
        • Sales Footprint
        • Strategy Overview
          • Marketing Strategy
          • Product Strategy
          • Channel Strategy
  21. Assumptions & Acronyms Used
  22. Research Methodology

List of Tables

  • Table 1: Global Market Value (USD Billion) Forecast by Region, 2020-2035
  • Table 2: Global Market Volume (Metric Ton) Forecast by Region, 2020-2035
  • Table 3: Global Market Value (USD Billion) Forecast by Source, 2020-2035
  • Table 4: Global Market Volume (Metric Ton) Forecast by Source, 2020-2035
  • Table 5: Global Market Value (USD Billion) Forecast by Product Type, 2020-2035
  • Table 6: Global Market Volume (Metric Ton) Forecast by Product Type, 2020-2035
  • Table 7: Global Market Value (USD Billion) Forecast by Form, 2020-2035
  • Table 8: Global Market Volume (Metric Ton) Forecast by Form, 2020-2035
  • Table 9: Global Market Value (USD Billion) Forecast by End Use, 2020-2035
  • Table 10: Global Market Volume (Metric Ton) Forecast by End Use, 2020-2035
  • Table 11: North America Market Value (USD Billion) Forecast by Country, 2020-2035
  • Table 12: North America Market Volume (Metric Ton) Forecast by Country, 2020-2035
  • Table 13: North America Market Value (USD Billion) Forecast by Source, 2020-2035
  • Table 14: North America Market Volume (Metric Ton) Forecast by Source, 2020-2035
  • Table 15: North America Market Value (USD Billion) Forecast by Product Type, 2020-2035
  • Table 16: North America Market Volume (Metric Ton) Forecast by Product Type, 2020-2035
  • Table 17: North America Market Value (USD Billion) Forecast by Form, 2020-2035
  • Table 18: North America Market Volume (Metric Ton) Forecast by Form, 2020-2035
  • Table 19: North America Market Value (USD Billion) Forecast by End Use, 2020-2035
  • Table 20: North America Market Volume (Metric Ton) Forecast by End Use, 2020-2035
  • Table 21: Latin America Market Value (USD Billion) Forecast by Country, 2020-2035
  • Table 22: Latin America Market Volume (Metric Ton) Forecast by Country, 2020-2035
  • Table 23: Latin America Market Value (USD Billion) Forecast by Source, 2020-2035
  • Table 24: Latin America Market Volume (Metric Ton) Forecast by Source, 2020-2035
  • Table 25: Latin America Market Value (USD Billion) Forecast by Product Type, 2020-2035
  • Table 26: Latin America Market Volume (Metric Ton) Forecast by Product Type, 2020-2035
  • Table 27: Latin America Market Value (USD Billion) Forecast by Form, 2020-2035
  • Table 28: Latin America Market Volume (Metric Ton) Forecast by Form, 2020-2035
  • Table 29: Latin America Market Value (USD Billion) Forecast by End Use, 2020-2035
  • Table 30: Latin America Market Volume (Metric Ton) Forecast by End Use, 2020-2035
  • Table 31: Western Europe Market Value (USD Billion) Forecast by Country, 2020-2035
  • Table 32: Western Europe Market Volume (Metric Ton) Forecast by Country, 2020-2035
  • Table 33: Western Europe Market Value (USD Billion) Forecast by Source, 2020-2035
  • Table 34: Western Europe Market Volume (Metric Ton) Forecast by Source, 2020-2035
  • Table 35: Western Europe Market Value (USD Billion) Forecast by Product Type, 2020-2035
  • Table 36: Western Europe Market Volume (Metric Ton) Forecast by Product Type, 2020-2035
  • Table 37: Western Europe Market Value (USD Billion) Forecast by Form, 2020-2035
  • Table 38: Western Europe Market Volume (Metric Ton) Forecast by Form, 2020-2035
  • Table 39: Western Europe Market Value (USD Billion) Forecast by End Use, 2020-2035
  • Table 40: Western Europe Market Volume (Metric Ton) Forecast by End Use, 2020-2035
  • Table 41: Eastern Europe Market Value (USD Billion) Forecast by Country, 2020-2035
  • Table 42: Eastern Europe Market Volume (Metric Ton) Forecast by Country, 2020-2035
  • Table 43: Eastern Europe Market Value (USD Billion) Forecast by Source, 2020-2035
  • Table 44: Eastern Europe Market Volume (Metric Ton) Forecast by Source, 2020-2035
  • Table 45: Eastern Europe Market Value (USD Billion) Forecast by Product Type, 2020-2035
  • Table 46: Eastern Europe Market Volume (Metric Ton) Forecast by Product Type, 2020-2035
  • Table 47: Eastern Europe Market Value (USD Billion) Forecast by Form, 2020-2035
  • Table 48: Eastern Europe Market Volume (Metric Ton) Forecast by Form, 2020-2035
  • Table 49: Eastern Europe Market Value (USD Billion) Forecast by End Use, 2020-2035
  • Table 50: Eastern Europe Market Volume (Metric Ton) Forecast by End Use, 2020-2035
  • Table 51: East Asia Market Value (USD Billion) Forecast by Country, 2020-2035
  • Table 52: East Asia Market Volume (Metric Ton) Forecast by Country, 2020-2035
  • Table 53: East Asia Market Value (USD Billion) Forecast by Source, 2020-2035
  • Table 54: East Asia Market Volume (Metric Ton) Forecast by Source, 2020-2035
  • Table 55: East Asia Market Value (USD Billion) Forecast by Product Type, 2020-2035
  • Table 56: East Asia Market Volume (Metric Ton) Forecast by Product Type, 2020-2035
  • Table 57: East Asia Market Value (USD Billion) Forecast by Form, 2020-2035
  • Table 58: East Asia Market Volume (Metric Ton) Forecast by Form, 2020-2035
  • Table 59: East Asia Market Value (USD Billion) Forecast by End Use, 2020-2035
  • Table 60: East Asia Market Volume (Metric Ton) Forecast by End Use, 2020-2035
  • Table 61: South Asia & Pacific Market Value (USD Billion) Forecast by Country, 2020-2035
  • Table 62: South Asia & Pacific Market Volume (Metric Ton) Forecast by Country, 2020-2035
  • Table 63: South Asia & Pacific Market Value (USD Billion) Forecast by Source, 2020-2035
  • Table 64: South Asia & Pacific Market Volume (Metric Ton) Forecast by Source, 2020-2035
  • Table 65: South Asia & Pacific Market Value (USD Billion) Forecast by Product Type, 2020-2035
  • Table 66: South Asia & Pacific Market Volume (Metric Ton) Forecast by Product Type, 2020-2035
  • Table 67: South Asia & Pacific Market Value (USD Billion) Forecast by Form, 2020-2035
  • Table 68: South Asia & Pacific Market Volume (Metric Ton) Forecast by Form, 2020-2035
  • Table 69: South Asia & Pacific Market Value (USD Billion) Forecast by End Use, 2020-2035
  • Table 70: South Asia & Pacific Market Volume (Metric Ton) Forecast by End Use, 2020-2035
  • Table 71: Middle East and Africa Market Value (USD Billion) Forecast by Country, 2020-2035
  • Table 72: Middle East and Africa Market Volume (Metric Ton) Forecast by Country, 2020-2035
  • Table 73: Middle East and Africa Market Value (USD Billion) Forecast by Source, 2020-2035
  • Table 74: Middle East and Africa Market Volume (Metric Ton) Forecast by Source, 2020-2035
  • Table 75: Middle East and Africa Market Value (USD Billion) Forecast by Product Type, 2020-2035
  • Table 76: Middle East and Africa Market Volume (Metric Ton) Forecast by Product Type, 2020-2035
  • Table 77: Middle East and Africa Market Value (USD Billion) Forecast by Form, 2020-2035
  • Table 78: Middle East and Africa Market Volume (Metric Ton) Forecast by Form, 2020-2035
  • Table 79: Middle East and Africa Market Value (USD Billion) Forecast by End Use, 2020-2035
  • Table 80: Middle East and Africa Market Volume (Metric Ton) Forecast by End Use, 2020-2035

List of Figures

  • Figure 1: Global Market Volume (Metric Ton) Forecast 2020-2035
  • Figure 2: Global Market Pricing Analysis
  • Figure 3: Global Market Value (USD Billion) Forecast 2020-2035
  • Figure 4: Global Market Value Share and BPS Analysis by Source, 2025 and 2035
  • Figure 5: Global Market Y-o-Y Growth Comparison by Source, 2025-2035
  • Figure 6: Global Market Attractiveness Analysis by Source
  • Figure 7: Global Market Value Share and BPS Analysis by Product Type, 2025 and 2035
  • Figure 8: Global Market Y-o-Y Growth Comparison by Product Type, 2025-2035
  • Figure 9: Global Market Attractiveness Analysis by Product Type
  • Figure 10: Global Market Value Share and BPS Analysis by Form, 2025 and 2035
  • Figure 11: Global Market Y-o-Y Growth Comparison by Form, 2025-2035
  • Figure 12: Global Market Attractiveness Analysis by Form
  • Figure 13: Global Market Value Share and BPS Analysis by End Use, 2025 and 2035
  • Figure 14: Global Market Y-o-Y Growth Comparison by End Use, 2025-2035
  • Figure 15: Global Market Attractiveness Analysis by End Use
  • Figure 16: Global Market Value (USD Billion) Share and BPS Analysis by Region, 2025 and 2035
  • Figure 17: Global Market Y-o-Y Growth Comparison by Region, 2025-2035
  • Figure 18: Global Market Attractiveness Analysis by Region
  • Figure 19: North America Market Incremental USD Opportunity, 2025-2035
  • Figure 20: Latin America Market Incremental USD Opportunity, 2025-2035
  • Figure 21: Western Europe Market Incremental USD Opportunity, 2025-2035
  • Figure 22: Eastern Europe Market Incremental USD Opportunity, 2025-2035
  • Figure 23: East Asia Market Incremental USD Opportunity, 2025-2035
  • Figure 24: South Asia & Pacific Market Incremental USD Opportunity, 2025-2035
  • Figure 25: Middle East and Africa Market Incremental USD Opportunity, 2025-2035
  • Figure 26: North America Market Value Share and BPS Analysis by Country, 2025 and 2035
  • Figure 27: North America Market Value Share and BPS Analysis by Source, 2025 and 2035
  • Figure 28: North America Market Y-o-Y Growth Comparison by Source, 2025-2035
  • Figure 29: North America Market Attractiveness Analysis by Source
  • Figure 30: North America Market Value Share and BPS Analysis by Product Type, 2025 and 2035
  • Figure 31: North America Market Y-o-Y Growth Comparison by Product Type, 2025-2035
  • Figure 32: North America Market Attractiveness Analysis by Product Type
  • Figure 33: North America Market Value Share and BPS Analysis by Form, 2025 and 2035
  • Figure 34: North America Market Y-o-Y Growth Comparison by Form, 2025-2035
  • Figure 35: North America Market Attractiveness Analysis by Form
  • Figure 36: North America Market Value Share and BPS Analysis by End Use, 2025 and 2035
  • Figure 37: North America Market Y-o-Y Growth Comparison by End Use, 2025-2035
  • Figure 38: North America Market Attractiveness Analysis by End Use
  • Figure 39: Latin America Market Value Share and BPS Analysis by Country, 2025 and 2035
  • Figure 40: Latin America Market Value Share and BPS Analysis by Source, 2025 and 2035
  • Figure 41: Latin America Market Y-o-Y Growth Comparison by Source, 2025-2035
  • Figure 42: Latin America Market Attractiveness Analysis by Source
  • Figure 43: Latin America Market Value Share and BPS Analysis by Product Type, 2025 and 2035
  • Figure 44: Latin America Market Y-o-Y Growth Comparison by Product Type, 2025-2035
  • Figure 45: Latin America Market Attractiveness Analysis by Product Type
  • Figure 46: Latin America Market Value Share and BPS Analysis by Form, 2025 and 2035
  • Figure 47: Latin America Market Y-o-Y Growth Comparison by Form, 2025-2035
  • Figure 48: Latin America Market Attractiveness Analysis by Form
  • Figure 49: Latin America Market Value Share and BPS Analysis by End Use, 2025 and 2035
  • Figure 50: Latin America Market Y-o-Y Growth Comparison by End Use, 2025-2035
  • Figure 51: Latin America Market Attractiveness Analysis by End Use
  • Figure 52: Western Europe Market Value Share and BPS Analysis by Country, 2025 and 2035
  • Figure 53: Western Europe Market Value Share and BPS Analysis by Source, 2025 and 2035
  • Figure 54: Western Europe Market Y-o-Y Growth Comparison by Source, 2025-2035
  • Figure 55: Western Europe Market Attractiveness Analysis by Source
  • Figure 56: Western Europe Market Value Share and BPS Analysis by Product Type, 2025 and 2035
  • Figure 57: Western Europe Market Y-o-Y Growth Comparison by Product Type, 2025-2035
  • Figure 58: Western Europe Market Attractiveness Analysis by Product Type
  • Figure 59: Western Europe Market Value Share and BPS Analysis by Form, 2025 and 2035
  • Figure 60: Western Europe Market Y-o-Y Growth Comparison by Form, 2025-2035
  • Figure 61: Western Europe Market Attractiveness Analysis by Form
  • Figure 62: Western Europe Market Value Share and BPS Analysis by End Use, 2025 and 2035
  • Figure 63: Western Europe Market Y-o-Y Growth Comparison by End Use, 2025-2035
  • Figure 64: Western Europe Market Attractiveness Analysis by End Use
  • Figure 65: Eastern Europe Market Value Share and BPS Analysis by Country, 2025 and 2035
  • Figure 66: Eastern Europe Market Value Share and BPS Analysis by Source, 2025 and 2035
  • Figure 67: Eastern Europe Market Y-o-Y Growth Comparison by Source, 2025-2035
  • Figure 68: Eastern Europe Market Attractiveness Analysis by Source
  • Figure 69: Eastern Europe Market Value Share and BPS Analysis by Product Type, 2025 and 2035
  • Figure 70: Eastern Europe Market Y-o-Y Growth Comparison by Product Type, 2025-2035
  • Figure 71: Eastern Europe Market Attractiveness Analysis by Product Type
  • Figure 72: Eastern Europe Market Value Share and BPS Analysis by Form, 2025 and 2035
  • Figure 73: Eastern Europe Market Y-o-Y Growth Comparison by Form, 2025-2035
  • Figure 74: Eastern Europe Market Attractiveness Analysis by Form
  • Figure 75: Eastern Europe Market Value Share and BPS Analysis by End Use, 2025 and 2035
  • Figure 76: Eastern Europe Market Y-o-Y Growth Comparison by End Use, 2025-2035
  • Figure 77: Eastern Europe Market Attractiveness Analysis by End Use
  • Figure 78: East Asia Market Value Share and BPS Analysis by Country, 2025 and 2035
  • Figure 79: East Asia Market Value Share and BPS Analysis by Source, 2025 and 2035
  • Figure 80: East Asia Market Y-o-Y Growth Comparison by Source, 2025-2035
  • Figure 81: East Asia Market Attractiveness Analysis by Source
  • Figure 82: East Asia Market Value Share and BPS Analysis by Product Type, 2025 and 2035
  • Figure 83: East Asia Market Y-o-Y Growth Comparison by Product Type, 2025-2035
  • Figure 84: East Asia Market Attractiveness Analysis by Product Type
  • Figure 85: East Asia Market Value Share and BPS Analysis by Form, 2025 and 2035
  • Figure 86: East Asia Market Y-o-Y Growth Comparison by Form, 2025-2035
  • Figure 87: East Asia Market Attractiveness Analysis by Form
  • Figure 88: East Asia Market Value Share and BPS Analysis by End Use, 2025 and 2035
  • Figure 89: East Asia Market Y-o-Y Growth Comparison by End Use, 2025-2035
  • Figure 90: East Asia Market Attractiveness Analysis by End Use
  • Figure 91: South Asia & Pacific Market Value Share and BPS Analysis by Country, 2025 and 2035
  • Figure 92: South Asia & Pacific Market Value Share and BPS Analysis by Source, 2025 and 2035
  • Figure 93: South Asia & Pacific Market Y-o-Y Growth Comparison by Source, 2025-2035
  • Figure 94: South Asia & Pacific Market Attractiveness Analysis by Source
  • Figure 95: South Asia & Pacific Market Value Share and BPS Analysis by Product Type, 2025 and 2035
  • Figure 96: South Asia & Pacific Market Y-o-Y Growth Comparison by Product Type, 2025-2035
  • Figure 97: South Asia & Pacific Market Attractiveness Analysis by Product Type
  • Figure 98: South Asia & Pacific Market Value Share and BPS Analysis by Form, 2025 and 2035
  • Figure 99: South Asia & Pacific Market Y-o-Y Growth Comparison by Form, 2025-2035
  • Figure 100: South Asia & Pacific Market Attractiveness Analysis by Form
  • Figure 101: South Asia & Pacific Market Value Share and BPS Analysis by End Use, 2025 and 2035
  • Figure 102: South Asia & Pacific Market Y-o-Y Growth Comparison by End Use, 2025-2035
  • Figure 103: South Asia & Pacific Market Attractiveness Analysis by End Use
  • Figure 104: Middle East and Africa Market Value Share and BPS Analysis by Country, 2025 and 2035
  • Figure 105: Middle East and Africa Market Value Share and BPS Analysis by Source, 2025 and 2035
  • Figure 106: Middle East and Africa Market Y-o-Y Growth Comparison by Source, 2025-2035
  • Figure 107: Middle East and Africa Market Attractiveness Analysis by Source
  • Figure 108: Middle East and Africa Market Value Share and BPS Analysis by Product Type, 2025 and 2035
  • Figure 109: Middle East and Africa Market Y-o-Y Growth Comparison by Product Type, 2025-2035
  • Figure 110: Middle East and Africa Market Attractiveness Analysis by Product Type
  • Figure 111: Middle East and Africa Market Value Share and BPS Analysis by Form, 2025 and 2035
  • Figure 112: Middle East and Africa Market Y-o-Y Growth Comparison by Form, 2025-2035
  • Figure 113: Middle East and Africa Market Attractiveness Analysis by Form
  • Figure 114: Middle East and Africa Market Value Share and BPS Analysis by End Use, 2025 and 2035
  • Figure 115: Middle East and Africa Market Y-o-Y Growth Comparison by End Use, 2025-2035
  • Figure 116: Middle East and Africa Market Attractiveness Analysis by End Use
  • Figure 117: Global Market - Tier Structure Analysis
  • Figure 118: Global Market - Company Share Analysis

Frequently Asked Questions

What is the projected size of the galactose market by 2035?

The market is expected to reach USD 51.1 billion by 2035.

What is the expected growth rate of the galactose market from 2025 to 2035?

The global market is projected to grow at a CAGR of 4.8% during this period.

Which product type holds the highest share in the galactose market in 2025?

D-Galactose is expected to lead with a 72% market share in 2025.

What is the projected share of plant-derived sugar in the source segment of the galactose market by 2025?

Plant-derived sugar is expected to hold a 68% share of the market in 2025.

Which country is projected to grow fastest in the galactose market?

The USA is anticipated to be the fastest-growing market with a CAGR of 4.9% through 2035.

Future Market Insights

Galactose Market