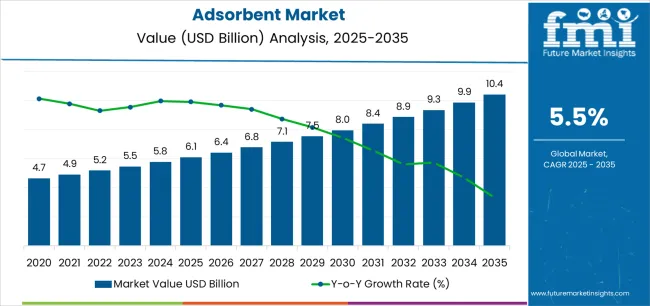
The Adsorbent Market is estimated to be valued at USD 6.1 billion in 2025 and is projected to reach USD 10.4 billion by 2035, registering a compound annual growth rate (CAGR) of 5.5% over the forecast period.
The Adsorbent market is experiencing strong growth driven by the increasing demand for efficient separation, purification, and recovery processes across industrial sectors. The future outlook is shaped by ongoing advancements in adsorbent materials and technologies that enhance selectivity, adsorption capacity, and operational efficiency. Rising consumption in petroleum and petrochemical industries, coupled with stringent environmental regulations for emission control and effluent treatment, is significantly supporting market expansion.
Additionally, the growing focus on sustainable industrial processes, energy efficiency, and the adoption of innovative catalysts and adsorption technologies is creating new growth avenues. The need for high-purity products in chemical manufacturing and refining operations is further fueling the deployment of advanced adsorbents.
Increasing investments in downstream processing and the transition toward more complex industrial applications are expected to drive the adoption of versatile adsorbent materials With rising industrialization in emerging economies and the expansion of refining and petrochemical operations, the adsorbent market is projected to sustain its growth trajectory over the coming years.

| Metric | Value |
|---|---|
| Adsorbent Market Estimated Value in (2025 E) | USD 6.1 billion |
| Adsorbent Market Forecast Value in (2035 F) | USD 10.4 billion |
| Forecast CAGR (2025 to 2035) | 5.5% |
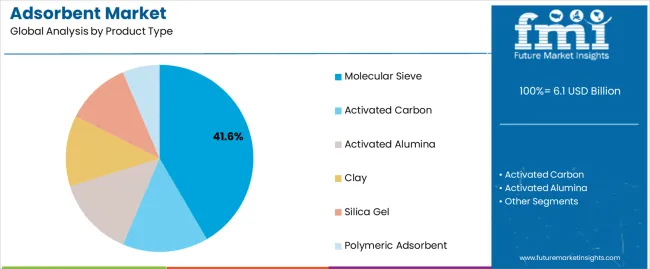
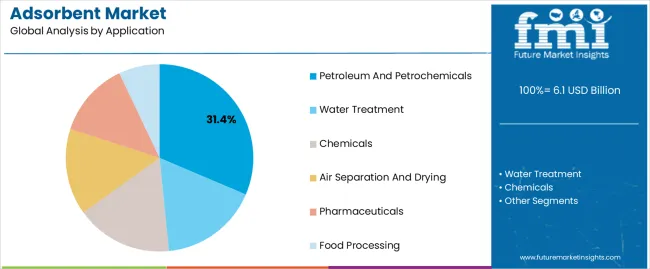
The market is segmented by Product Type and Application and region. By Product Type, the market is divided into Molecular Sieve, Activated Carbon, Activated Alumina, Clay, Silica Gel, and Polymeric Adsorbent. In terms of Application, the market is classified into Petroleum And Petrochemicals, Water Treatment, Chemicals, Air Separation And Drying, Pharmaceuticals, and Food Processing. Regionally, the market is classified into North America, Latin America, Western Europe, Eastern Europe, Balkan & Baltic Countries, Russia & Belarus, Central Asia, East Asia, South Asia & Pacific, and the Middle East & Africa.

The molecular sieve product type is projected to hold 41.60% of the adsorbent market revenue share in 2025, making it the leading product type. This dominance is attributed to its high efficiency in separating gases and liquids with precision, providing excellent selectivity and adsorption capacity.
Molecular sieves are widely employed in industrial applications requiring dehydration, purification, and gas separation due to their crystalline structure and ability to maintain performance under high temperatures and pressures. The segment growth is further supported by technological advancements that have improved the durability, regenerability, and adsorption performance of molecular sieves.
Rising demand for energy-efficient and environmentally friendly separation processes has strengthened their adoption in petrochemical, chemical, and natural gas industries Additionally, the versatility and reliability of molecular sieves in both continuous and batch processes have reinforced their preference among industrial operators, making them the dominant product type in the adsorbent market.

The petroleum and petrochemicals application segment is expected to account for 31.40% of the adsorbent market revenue share in 2025, establishing it as the leading application segment. Growth in this segment has been driven by the increasing need for purification, separation, and dehydration of hydrocarbons in refining and petrochemical processes. Adsorbents are critical in removing impurities, water, and unwanted components to improve product quality and comply with industry standards.
The segment has benefited from rising petroleum refining capacities and expansion of petrochemical facilities globally. The adoption of advanced adsorbent materials has enabled improved efficiency, lower operational costs, and enhanced sustainability in these processes.
Furthermore, stringent environmental regulations and increasing demand for high-quality petrochemical products have accelerated the use of adsorbents in this sector The combination of technological advancement and growing industrial demand continues to support the dominance of the petroleum and petrochemicals application segment in the adsorbent market.
The annual growth rates of the global adsorbent industry from 2025 to 2035 are illustrated in the table below. Starting with the base year 2025 and going up to the present year 2025, the report examines how the growth trajectory changes from the first half of the year, i.e.
January through June (H1) to the second half consisting of July through December (H2). This gives stakeholders a comprehensive picture of the industry’s performance over time and insights into potential future developments.
The figures provided show the growth of the market for each half-year between 2025 and 2025. It was projected to increase at a CAGR of 5.5% in the first half (H1) of 2025. However, in the second half (H2), there is a noticeable increase in the growth rate at 6.1%.
| Particulars | Value CAGR |
|---|---|
| H1 | 5.5% (2025 to 2035) |
| H2 | 6.1% (2025 to 2035) |
| H1 | 5.4% (2025 to 2035) |
| H2 | 6.2% (2025 to 2035) |
Moving into the subsequent period, from H1 2025 to H2 2025, the CAGR is projected to slightly decrease to 5.4% in the first half and relatively increase to 6.2% in the second half. In the first half (H1), the market saw a decline of 10 BPS while in the second half (H2), there was a slight increase of 10 BPS.
Emphasis on Recyclability and Reusability to Help Create a Circular Economy
The growing focus on recyclability and reusability to implement principles of the circular economy is pushing worldwide sustainability efforts. Resource conservancy is receiving more emphasis as waste reduction becomes a hot topic.
The development of absorptive materials, such as polymeric materials for improved recyclability and multiple use-cycling is gaining momentum. This trend demonstrates the ongoing dedication to reduce environmental impact. It also encourages circular or cradle-to-cradle absorptive material regeneration, which allows for improved sustainability of operations at low resource consumption.
Strict regulatory rules for the environment and a rising emphasis on corporate sustainability are further fueling the industry. Both governments and businesses understand that there is a need to adopt more green solutions.
Hence, companies are developing novel solutions that can support a circular economy framework and match regulations as well as corporate sustainability standards. They are anticipated to offer strategic alignment with regulatory demands of operating sustainably.
Pharmaceutical Industry Propels Use in Drug Manufacturing Processes
Continuous growth of the pharmaceutical industry is one of the key factors supporting adsorbent usage for drug manufacturing processes. These are widely used in pharmaceuticals for the purification and separation of different components during drug production.
They also help isolate and purify target compounds in processes, such as chromatography. This is especially important for the pharmaceutical industry where high quality and purity of drugs must be maintained to meet compliance regulations. A typical application is the purification of antibiotics and several other pharmaceutical products by using activated carbon as an absorptive material.
The booming pharmaceutical industry worldwide is looking for the efficacy and multi-functionality of absorbents. With rising research work related to healthcare, beneficial solutions are likely to remain popular through 2035 for drug manufacturing purposes.
Demand to Skyrocket among Petrochemical and Chemical Manufacturers
Increasing industrialization across the globe is augmenting the requirement for absorptive materials. These are set to be employed in several applications across industries like petroleum, petrochemicals, and chemicals.
They are projected to be used in the petroleum industry for refining purposes to purify products and comply with critical quality requirements. These substances are also essential in the petrochemical and chemical industries where they allow separation processes to take place.
It further enables the production of high-quality substances. Growing industrial activities, underpinned by the increasing world economy, are directly propelling demand for adsorbents across verticals transforming them into an integral part of operations to improve product quality.
The substances help mitigate challenges ranging from air separation and drying to pharmaceuticals and food processing. Consumers are seeking these substances to ensure compliance with necessary regulatory standards and maintain operational excellence. This acknowledgment obliges the superior demand for these materials as irreplaceable agents of a vast range with diverse utilities ultimately leading to their placement amongst necessary resources on earth.
Concerns of Worker Safety Amid High Risk of Respiratory Issues May Limit Demand
One of the key restraints in the industry includes health-related risks associated with the production of the substances. Individuals who manufacture and handle absorptive materials like activated carbon and silica gel are often exposed to a variety of hazards. These include respiratory problems as well as chemical sensitivities.
The risks in such applications are magnified further when specialized use cases, like pharmaceutical and food processing, necessitate that the droplets be made non-toxic.
The instances of poor safety practices demonstrated during adsorbent handling are a reminder that health and safety measures must be strict. For instance, the physical work in manufacturing may mean the inhalation of airborne particles. It can result in respiratory issues for some workers and can affect their well-being.
Concerns for the possible toxicity of absorptive materials in pharmaceuticals and food processing illustrate a growing demand to comply with health standards. If companies are unable to provide or maintain plans to combat these health-related challenges, growth could be hampered.
The global market witnessed a CAGR of 3.7% between 2020 and 2025. Total revenue reached about USD 5,470.1 million in 2025. During the forecast period, global sales are projected to fetch a CAGR of 5.8%.
The adsorbent market witnessed a sluggish demand trajectory during the historical period on account of the global spread of COVID-19. As the need for adsorbents grew, supply chain disruptions from the pandemic caused a reduction in production and logistics.
A slowdown was also witnessed in most of the key application industries, such as petroleum, chemicals, and manufacturing resulting in a decreased demand for absorptive materials. Growth was also constrained by the lockdown and the ban on industrial operations.
During this time of uncertainly and declining global economy, few projects, especially in the massive absorptive material consumption sectors, were delayed or even called off resulting in overall slow industry performance.
The global market is anticipated to revive and display a positive trajectory throughout the forecast period. As end-users recover from the pandemic and strict environmental regulations continue, high demand for clean production processes is predicted. This, coupled with increasing focus on sustainable methods, particularly in water treatment and air purification sectors, is poised to spur growth.
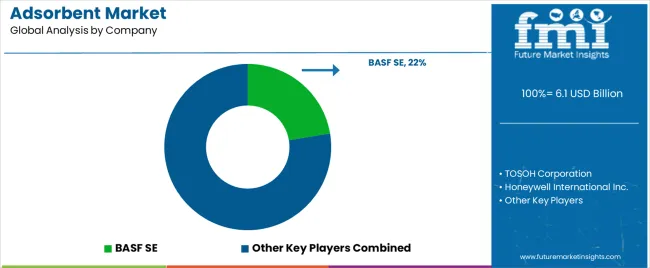
Tier 1 companies include industry leaders with annual revenues exceeding USD 300 million. These companies are currently capturing a significant share of 35% to 45% globally. These frontrunners are characterized by high production capacity and a wide product portfolio.
They are distinguished by extensive expertise in manufacturing and a broad geographical reach, underpinned by a robust consumer base. The firms provide a wide range of products and utilize the latest technology to meet regulatory standards. Prominent companies within Tier 1 include BASF SE, Honeywell International Inc., TOSOH Corporation, Arkema S.A, Clariant AG, and W.R. Grace & Co.
Tier 2 companies encompass mid-sized participants with revenues ranging from USD 50 to 300 million, holding a presence in specific regions and exerting prominent influence in local economies. These firms are distinguished by their robust presence overseas and in-depth market expertise.
They possess strong technology capabilities and adhere strictly to regulatory requirements. However, the firms may not wield cutting-edge technology or maintain an extensive global reach.
Noteworthy entities in Tier 2 include Ecovyst Inc., CPH Group, Spectrum Chemical, Albemarle Corporation, PQ Corp., Luoyang Jalon Micro-Nano New Materials Co., Ltd., KNT Group, and KMI Molecular Sieves Inc.
Tier 3 encompasses most of the small-scale enterprises operating within the regional sphere and catering to specialized needs with revenues below USD 50 million. These businesses are notably focused on meeting local demands and are hence categorized within the Tier 3 segment.
They are small-scale participants with limited geographical presence. In this context, Tier 3 is acknowledged as an informal sector, indicating a segment distinguished by a lack of extensive organization and formal structure in comparison to the structured one. Tier 3 includes Silkem d.o.o., Sorbead India, Zeotec Adsorbents Private Limited., Axens S.A, Zeochem AG, and Siddhartha Industries.
The section covers assessments of adsorbent sales across key countries. Countries from the Middle East and Africa are anticipated to exhibit promising double-digit growth over the forecast period. All the below-listed countries are collectively set to reflect a CAGR of around 8% through the forecast period, which is 1.2X of the global market.
| Countries | CAGR 2025 to 2035 |
|---|---|
| South Africa | 8.8% |
| Türkiye | 8.3% |
| Kingdom of Saudi Arabia | 7.8% |
| Poland | 7.5% |
| Brazil | 7.3% |
China's position as a leading producer of petrochemicals directly impacts demand for absorptive materials. The country has a massive refining capacity, requiring substances like activated alumina and molecular sieves to purify and process raw materials.
Unlike several other countries, China's petrochemical industry is vast and continues to broaden, bolstering a substantial need for absorptive materials to maintain high production quality and efficiency. This unique scale and growth make China a key country.
China's extensive use of coal-to-chemicals technology, a process where coal is converted into chemicals like methanol and olefins, is a significant growth-boosting factor. Adsorbents are essential in purifying gases and removing impurities during this conversion process. The industry is particularly prominent in China due to its abundant coal resources and energy strategy, setting it apart from other industries where coal usage is declining.
China is also a global leader in rare earth element (REE) production, and adsorbent materials play a key role in extracting and refining these elements. In REE processing, substances like activated carbon are used to remove impurities and extract valuable materials. China's dominance in the rare earth element sector drives a unique and consistent demand for specialized absorptive materials.
China’s chemical manufacturing sector, particularly specialty chemicals, is one of the most prominent in the world. Adsorbent materials are important for the production and purification processes of these chemicals. For instance, molecular sieves are used for separating and refining chemical compounds to ensure high purity. The sheer scale of chemical production in China, which far exceeds that of most other countries, augments a high consumption of absorptive materials, making it a key country.
In the forecast period, the United States is predicted to rise steadily at a CAGR of 4.5% and attain a total worth of USD 1,288 million by 2035. The country is considered a global leader in the fields of pharmaceuticals and biotechnology that heavily rely on adsorbents for purification and separation processes. Materials like polymeric adsorbents and molecular sieves are important in producing high-purity drugs and biopharmaceuticals, driving significant demand.
The United States also has one of the most developed water treatment infrastructures globally, requiring high-performance activated carbon and alumina for water purification and contaminant removal. The growing focus on clean water standards and environmental regulations continues to propel demand in water treatment applications.
The country’s government has been implementing stringent air quality regulations, which have LED to a high demand for adsorbent materials in air purification systems, particularly in industrial settings. Silica gel and activated carbon are essential in removing pollutants and ensuring compliance with environmental standards.
The United States is at the forefront of research and development in terms of adsorbent technologies, bolstering innovations in more efficient and specialized materials. This focus on innovation supports a competitive domestic market, which ensures the availability of cutting-edge products tailored to meet specific needs.
India is projected to surge at a CAGR of 6.8% from 2025 to 2035, with sales set to reach USD 832 million by 2035. The country’s booming petroleum and petrochemical sectors are key consumers of adsorbents.
India’s refining capacity is broadening. Hence, activated alumina and molecular sieves are gaining momentum as these are set to be used in processes like desulfurization and purification. This industry-specific demand distinguishes India as a key consumer.
Government programs like the “Jal Jeevan Mission” aim to provide clean drinking water to every household, augmenting demand for these substances in water treatment applications. Activated alumina, in particular, is used to remove contaminants, such as fluoride and arsenic from drinking water, making it important for these initiatives.
India is becoming a global hub for chemical manufacturing, with a focus on producing specialty chemicals. The substances are essential for purification and refining processes in the country. As chemical manufacturing continues to broaden, the need for high-quality adsorbents like molecular sieves and activated carbon will likely rise.
India’s growing commitment to environmental sustainability, pushed by strict regulations and international agreements, has LED to the rising use of adsorbents in pollution control. These are set to be used in applications, such as removing pollutants from industrial emissions and treating wastewater, to ensure compliance with environmental standards.
The section explains the growth trajectories of the leading segments. In terms of product type, molecular sieves will likely dominate and generate a value share of around 41.6% in 2025.
Based on application, the petroleum and petrochemical segment is projected to hold a share of 31.4% in 2025. The analysis would enable potential clients to make effective business decisions for investment purposes.
| Segment | Molecular Sieve (Product Type) |
|---|---|
| Value Share (2025) | 41.6% |
By product type, the molecular sieve segment is forecast to experience a decent CAGR of 5.9% from 2025 to 2035. These are extensively used in natural gas processing, particularly in the removal of water and impurities from gas streams.
For instance, in liquefied natural gas (LNG) plants, molecular sieves are significant for dehydrating gas to prevent pipeline blockages and ensure smooth operation. This specific application drives a key portion of the molecular sieve segment.
Molecular sieves are also essential in producing high-purity oxygen for medical use, especially in healthcare facilities and oxygen concentrators.
The COVID-19 pandemic underscored the importance of reliable oxygen supply, increasing the demand for molecular sieves in medical applications. This trend continues as healthcare systems worldwide broaden their capacity to prepare for future health crises, further fueling growth.
| Segment | Petroleum and Petrochemical (Application) |
|---|---|
| Value Share (2025) | 31.4% |
The petroleum and pharmaceutical industry, with a projected value share of 31.4% in 2025, is poised to significantly impact the global market. It relies heavily on adsorbents for critical purification and separation processes.
Substances like molecular sieves and activated alumina are essential in refining crude oil and producing high-quality petrochemical products.
For instance, in the desulfurization process, the substances help remove sulfur compounds from fuel, ensuring compliance with environmental regulations. The complexity and scale of these processes make the substances indispensable, boosting the segment’s dominance worldwide.
The ongoing expansion of refining capacity and petrochemical production, particularly in regions like Asia Pacific and the Middle East, also contributes significantly to the dominance of the segment.
As new refineries and petrochemical plants are established, demand for adsorbents increases. For instance, rising global petrochemical demand, boosted by plastic and chemical manufacturers, directly impacts the consumption of adsorbents in this industry.

The section provides comprehensive assessments and insights that highlight current opportunities and emerging trends for companies in developed and developing countries. It analyzes innovations in manufacturing and identifies the latest trends poised to push new applications in the industry.
A few key players in the adsorbent industry are actively enhancing their capabilities and resources to cater to the growing demand for the substance across diverse applications. Leading companies also leverage partnership and joint venture strategies to co-develop innovative products and extend their resource base.
Significant players are further introducing new products to address the rising demand for state-of-the-art solutions in several end-use industries. Broadening geographic footprint is another important strategy that is being embraced by reputed companies. Start-ups are likely to emerge in the market through 2035, thereby making it more competitive.
Industry Updates
Product types included in the study are activated alumina, activated carbon, molecular sieve, clay, silica gel, and polymeric adsorbent.
Petroleum and petrochemicals, chemicals, water treatment, air separation and drying, pharmaceuticals, and food processing are the main applications.
Regions considered in the report are North America, Latin America, Western Europe, Eastern Europe, East Asia, South Asia and Pacific, and the Middle East and Africa.
The global adsorbent market is estimated to be valued at USD 6.1 billion in 2025.
The market size for the adsorbent market is projected to reach USD 10.4 billion by 2035.
The adsorbent market is expected to grow at a 5.5% CAGR between 2025 and 2035.
The key product types in adsorbent market are molecular sieve, activated carbon, activated alumina, clay, silica gel and polymeric adsorbent.
In terms of application, petroleum and petrochemicals segment to command 31.4% share in the adsorbent market in 2025.


Our Research Products

The "Full Research Suite" delivers actionable market intel, deep dives on markets or technologies, so clients act faster, cut risk, and unlock growth.

The Leaderboard benchmarks and ranks top vendors, classifying them as Established Leaders, Leading Challengers, or Disruptors & Challengers.

Locates where complements amplify value and substitutes erode it, forecasting net impact by horizon

We deliver granular, decision-grade intel: market sizing, 5-year forecasts, pricing, adoption, usage, revenue, and operational KPIs—plus competitor tracking, regulation, and value chains—across 60 countries broadly.

Spot the shifts before they hit your P&L. We track inflection points, adoption curves, pricing moves, and ecosystem plays to show where demand is heading, why it is changing, and what to do next across high-growth markets and disruptive tech

Real-time reads of user behavior. We track shifting priorities, perceptions of today’s and next-gen services, and provider experience, then pace how fast tech moves from trial to adoption, blending buyer, consumer, and channel inputs with social signals (#WhySwitch, #UX).

Partner with our analyst team to build a custom report designed around your business priorities. From analysing market trends to assessing competitors or crafting bespoke datasets, we tailor insights to your needs.
Supplier Intelligence
Discovery & Profiling
Capacity & Footprint
Performance & Risk
Compliance & Governance
Commercial Readiness
Who Supplies Whom
Scorecards & Shortlists
Playbooks & Docs
Category Intelligence
Definition & Scope
Demand & Use Cases
Cost Drivers
Market Structure
Supply Chain Map
Trade & Policy
Operating Norms
Deliverables
Buyer Intelligence
Account Basics
Spend & Scope
Procurement Model
Vendor Requirements
Terms & Policies
Entry Strategy
Pain Points & Triggers
Outputs
Pricing Analysis
Benchmarks
Trends
Should-Cost
Indexation
Landed Cost
Commercial Terms
Deliverables
Brand Analysis
Positioning & Value Prop
Share & Presence
Customer Evidence
Go-to-Market
Digital & Reputation
Compliance & Trust
KPIs & Gaps
Outputs
Full Research Suite comprises of:
Market outlook & trends analysis
Interviews & case studies
Strategic recommendations
Vendor profiles & capabilities analysis
5-year forecasts
8 regions and 60+ country-level data splits
Market segment data splits
12 months of continuous data updates
DELIVERED AS:
PDF EXCEL ONLINE
Adsorbent Glass Mat (AGM) Battery Market Report – Demand, Trends & Industry Forecast 2025-2035
UK Adsorbent Glass Mat (AGM) Battery Market Trends – Growth, Demand & Innovations 2025-2035
USA AGM Battery Market Outlook – Demand, Innovations & Forecast 2025-2035
Japan AGM Battery Market Trends – Size, Share & Growth 2025-2035
ASEAN Adsorbent Glass Mat (AGM) Battery Market Insights – Size, Share & Innovations 2025-2035
Zeolite Adsorbents Market Size and Share Forecast Outlook 2025 to 2035
Germany Adsorbent Glass Mat Battery Market Trends – Size, Growth & Outlook 2025-2035
Mineral Adsorbent Market
Polymeric Adsorbents Market Size and Share Forecast Outlook 2025 to 2035
Synthetic Zeolite Y Adsorbent Market Size and Share Forecast Outlook 2025 to 2035

Thank you!
You will receive an email from our Business Development Manager. Please be sure to check your SPAM/JUNK folder too.
Chat With
MaRIA