Interactive Whiteboards Market
Interactive Whiteboards Market By Solution (Hardware, Software, Collaborative Tools), Type (Resistive, Capacitive, Electromagnetic), Size (Below 50 in, 50 in - 79 in, 79 in - 89 in), Application (Corporate, Educational), Operating System (Windows, macOS) & Region - Forecast to 2020-2030
Market Insights on Interactive Whiteboards covering sales outlook, demand forecast and up-to-date key trends
Interactive Whiteboards Market Outlook & Key Findings
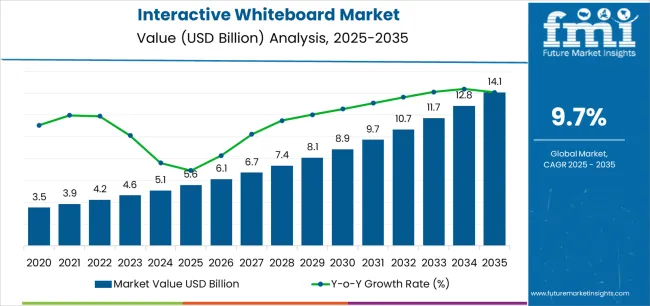
- The global market is estimated to record a market value worth more than US$ 400 Mn by the end of 2020 with increasing significance of e-learning and virtual learning environments
- Procurement of interactive whiteboards for educational use is the primary contributor to the growth of the global interactive whiteboards market
- Assembled interactive whiteboards with integrated software and collaborative tools for operational applications to drive adoption
- COVID-19 pandemic to boost adoption of interactive whiteboards nationwide lockdowns and social distancing measures disrupts schools and colleges
Don't pay for what you don't need
Customize your report by selecting specific countries or regions and save 30%!
Interactive Whiteboards See Rapid Downloads with Overnight Shift to Virtual Learning Environments
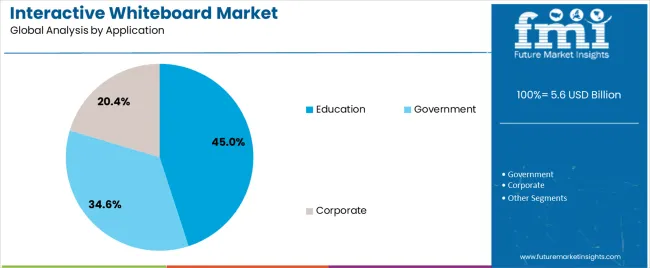
The education industry is the primary contributor to the growth of the global interactive whiteboards market. High demand for smart learning and smart classrooms is being observed on a global level as students, educational institutes, and teachers grapple to adapt to the ongoing COVID-19 pandemic.
Interactive whiteboards have the ability to mimic connected computers and laptops on large interactive screens, which enables students and teachers to access a large pool of data and information available on the Internet.
This attribute has made it an ideal e–learning and virtual learning tool, boosting is quick uptake in areas of remote learnings. End-users operating in educational institutes and organizations are making huge investments to procure interactive whiteboards in bulk, making them an integral part of institutional infrastructure.
Such installations are expected to enhance the attractiveness of institutes, mobilize learning, expand its reach, and in effect boost the market.
Demand for smart education in light of mounting student debt and issues arising out of it is projected to put this tool in the limelight. The pandemic has offered the market a perfect timing to prove its potential in tuition continuity at affordable costs.
High Selling Prices in Developing Economies of Europe and the Middle East and Africa (MEA)
The Average Selling Prices (ASPs) of interactive whiteboards products in the MEA region are observed to be the highest among all the regional markets. The interactive whiteboards market in Southeast Asia and Pacific region reported the lowest selling prices.
The weighted ASP for electromagnetic interactive whiteboards in MEA is around 1.4 times higher than for the same product in Southeast Asia and Pacific.
Meanwhile, the weighted ASP of infrared interactive whiteboards in Europe and MEA markets are 1.1 times the ASP in Southeast Asia and Pacific.
Market participants are catering to the high demand for interactive whiteboards and touch boards from the developing nations of Latin America and Europe, owing to the accelerated growth in the regional education sectors. Vendors are trying to harness this demand to enhance their revenue generation by strategically increasing selling prices.
Promoting Smart Learning Practices by National Governments Educates Masses
Government across the globe are motivating educational institutions to introduce smart classroom programs in order to improve learning outcomes and train their students with advanced technical skills. Flexibility of time and space in virtual classrooms has attracted a large number of institutes to this new age of learning.
Vendors and governments are incorporating collaborative efforts in their unique way to achieve this common goal. For instance, the Turkish government is embarking on a high investment education technology project under the banner of “FAITH”. This project is aimed at providing smart tablets and computer access to every student in grade 5 to grade 12 and equip every classroom with interactive whiteboards.
Easy operation to a stylus and touch has made these whiteboards ideal for corporate spaces as well. A mass shift to remote working that has pushed corporates to go virtual with conferences has also fueled the uptake of interactive whiteboards in recent times.
With features such as saving and printing, an interactive whiteboard cleverly replaces physical documentation or taking notes. Such attributes have ensured seamless integration of interactive whiteboards across many verticals that demand training.
COVID-19 Impacts Interactive Whiteboard Market Positively
Governments across the globe trying to ensure spread of COVID-19 legislated stringent nationwide lockdowns. Authorities are requesting citizens to incorporate social distancing measures, which caused a mayhem in the education industry, resulting in deferred admission, delayed exams, and no clarity about the next academic year.
With strict lockdowns in effect, citizens of these countries are staying indoors and avoiding high pubic throughput venues. Students and corporate employees are required to work from home and attend lectures and meeting online.
In such times, provision of video communication Platform-as-a-Service (PaaS) is enabling teachers, students and corporate employees to operate from home. Stalwarts such as Harvard and Yale to small NGOs running schools for free, each one is transitioning to a virtual classroom.
Thus, in the coming months as the world tries to cope with COVID-19, a large student community is expected take online classes, probably setting a precedent for new system of education.
Interactive whiteboards will be used in combination with other collaborative services. In the coming days, analysts anticipate that this transition will result in a debate about whether tuition fee structure of brick and mortar institutes is justified if education can occur over distances through smart devices. The real impact of COVID-19 on interactive whiteboards market will unfold in the near future as response to the pandemic changes with every new case.
Get the data you need at a Fraction of the cost
Personalize your report by choosing insights you need
and save 40%!
Emerging Technologies are Replacing Projector-based Interactive Whiteboards
Introduction of interactive displays and interactive portable projectors with more advanced features, including high resolution, better touch, and improved durability, than interactive whiteboards are challenging market growth.
These alternative technologies are marketed at almost the same price range and their dominance of is driven by the fact that end users prefer better touch and high resolution for quick responses.
Some of the key manufacturers and providers of these advanced interactive solutions include Mimio (MimioTeach Interactive System), Epson America Inc. (Epson BrightLink), BenQ (BenQ PointWrite interactive projectors), and Smart Technologies (Interactive Flat Panel displays).
Lack of Supporting Equipment and Infrastructure Restricting Market Growth
In countries of Africa and the Middle East, access to computers, tablets, and smartphones is still at a very nascent stage. Thus, lack of supporting equipment make it difficult for students to be acquainted with classrooms, let alone virtual ones. This has been significant area of challenge for the market.
The minimal exposure to education still remains through conventional classrooms that run operate on pen and paper for teaching and learning. In recent times, slight penetration of technology and educational aids have brought in computer and projector units, which remains a long way from interactive whiteboard system.
Thus, developing and underdeveloped economies, poor education standards, gender discrimination towards educating girl child, and war-stricken zones all pose a tough challenge to usage of interactive whiteboards.
Competitors Focus on Innovation Strategies to Stay Ahead
Well-established vendors operating in the global interactive whiteboards market are focusing on offering innovative software and collaborative tools for end users looking to upgrade their existing interactive whiteboard systems.
For instance, SMART Technologies Inc. launched SMART Notebook Maestro software, as a part of the SMART Notebook Software platform enables teachers to remotely control the content that their students can view.
This software can be run over any interactive screen with the help of an iPad device that is connected to the company’s interactive whiteboard system.
Other key players are launching interactive whiteboards systems have already integrated innovative connectivity features. For instance, Promethean World plc. launched upgraded new ActivBoard Touch interactive whiteboards that support up to six simultaneous touches.
This product was built with an intention to support group interactivity among students, which enables them to interact with each other on the basis of the content displayed on board and also share ideas and work on a project together.
Following are the key players operating in the global interactive whiteboards market –
- Xiamen Interactive Technology Co., Ltd
- SMART Technologies ULC
- PROMETHEAN LIMITED
- Boxlight
- Genee World Ltd
- I3 SOLUTIONS
- Ricoh
- Starboard Solution
- TRIUMPH BOARD a.s.
- Sharp Corporation
- Hitachi Interactive Solutions
- ELMO Company Limited
- BenQ
- Seiko Epson Corporation
- InFocus Corporation
Others Join Bandwagon as Interactive Whiteboards Add Value to Virtual Meetings
Though end-users operating in the education industry are the primary contributors to the growth of the global market, they are not the only ones procuring the interactive whiteboard solutions.
Other industries contributing to market growth include the corporate sector, healthcare, and military and defense, where they are used for training programs, seminars, and presentations.
In the corporate sector, interactive whiteboards are being used to conduct orientations, presentations, and boardroom meetings. Interactive whiteboard solutions have proven to enhance training practices and improve the overall learning experience of users.
In other supplication segments, the corporate sector is the most dominant segment, which is expected to account for more than 90% share of the whole “other application” segment, followed by the healthcare, military and defense industry with contribution worth around 2%–3%.
As more and more operations go remote, the demand for interactive whiteboards will soar. Its ability to add value to virtual meetings will solve the challenges of remote interactions, where explaining concepts remains a perpetual challenge.
Key Segments Covered
Solution
- Hardware
- Software
- Collaborative Tools
Type
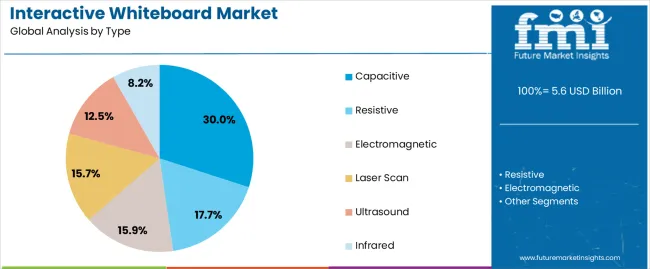
- Resistive
- Capacitive
- Electromagnetic
- Laser Scan
- Ultrasound
- Infrared
Size
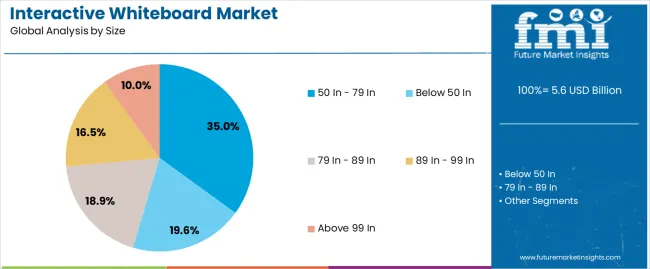
- Below 50 in
- 50 in – 79 in
- 79 in – 89 in
- 89 in – 99 in
- Above 99 in
Application
- Corporate
- Educational
- Others
Operating System
- Windows
- macOS
- Others
Region
- North America
- Latin America
- Europe
- East Asia
- Southeast Asia and Pacific
- Middle East and Africa
Frequently Asked Questions
What is the Growth Outlook for Interactive Whiteboard Market?
The interactive whiteboard market is likely to secure a CAGR of 7.5% through 2032.
By 2032, how much can the Interactive Whiteboard Market Grow?
The interactive whiteboard market size is estimated to cross US$ 4.10 Bn by 2032.
What is the Current Valuation of the Interactive Whiteboard Market?
The interactive whiteboard market is likely to record a value of US$ 1.99 Bn in 2022.
Which Region is likely to Lead the Interactive Whiteboard Market?
Asia Pacific is likely to lead the interactive whiteboard market.
Table of Content
1. Executive Summary 1.1. Global Market Outlook 1.2. Demand Side Trends 1.3. Supply Side Trends 1.4. Technology Roadmap 1.5. Analysis and Recommendations 2. Market Overview 2.1. Market Coverage / Taxonomy 2.2. Market Definition / Scope / Limitations 3. Key Market Trends 3.1. Key Trends Impacting the Market 3.2. Product Innovation / Development Trends 4. COVID-19 Impact Analysis 4.1. Impact of COVID-19 by End-user 4.1.1. Education 4.1.2. Corporate 4.1.3. Military and Defence 4.2. Impact of COVID-19 on Education ICT Procurement 4.3. Recovery Scenario 4.3.1. Short Term 4.3.2. Long Term 5. Global Interactive Whiteboard Market Demand (in Volume in Units) Analysis 2015-2019 and Forecast, 2020-2030 5.1. Historical Market Volume (in Units) Analysis, 2015-2019 5.2. Current and Future Market Volume (in Units) Projections, 2020-2030 5.2.1. Y-o-Y Growth Trend Analysis 5.2.2. Market Volume Share Analysis 6. Global Interactive Whiteboard Market Demand (in Value or Size in US$ Mn) Analysis 2015-2019 and Forecast, 2020-2030 6.1. Historical Market Value (in US$ Mn) Analysis, 2015-2019 6.2. Current and Future Market Value (in US$ Mn) Projections, 2020-2030 6.2.1. Y-o-Y Growth Trend Analysis 6.2.2. Absolute $ Opportunity Analysis 6.3. Pricing Analysis 7. Market Background 7.1. Macro-Economic Factors 7.2. Forecast Factors - Relevance & Impact 7.3. Value Chain 7.4. Market Dynamics 7.4.1. Drivers 7.4.2. Restraints 7.4.3. Opportunity Analysis 8. Global Interactive Whiteboard Market Analysis 2015-2019 and Forecast 2020-2030, by Solution 8.1. Historical Market Size (US$ Mn) and Market Volume (Mn Units) Analysis By Solution, 2015-2019 8.2. Current and Future Market Size (US$ Mn) and Market Volume (Mn Units) Analysis and Forecast By Solution, 2020-2030 8.2.1. Hardware 8.2.2. Software 8.2.3. Collaborative Tools 8.3. Market Attractiveness Analysis By Solution 9. Global Interactive Whiteboard Market Analysis 2015-2019 and Forecast 2020-2030, by Type 9.1. Historical Market Size (US$ Mn) and Market Volume (Mn Units) Analysis By Type, 2015-2019 9.2. Current and Future Market Size (US$ Mn) and Market Volume (Mn Units) Analysis and Forecast By Type, 2020-2030 9.2.1. Resistive 9.2.2. Capacitive 9.2.3. Electromagnetic 9.2.4. Laser Scan 9.2.5. Ultrasound 9.2.6. Infrared 9.3. Market Attractiveness Analysis By Type 10. Global Interactive Whiteboard Market Analysis 2015-2019 and Forecast 2020-2030, by Size 10.1. Historical Market Size (US$ Mn) and Market Volume (Mn Units) Analysis By Size, 2015-2019 10.2. Current and Future Market Size (US$ Mn) and Market Volume (Mn Units) Analysis and Forecast By Size, 2020-2030 10.2.1. Below 50 in 10.2.2. 50 in – 79 in 10.2.3. 79 in – 89 in 10.2.4. 89 in – 99 in 10.2.5. Above 99 in 10.3. Market Attractiveness Analysis By Size 11. Global Interactive Whiteboard Market Analysis 2015-2019 and Forecast 2020-2030, by Application 11.1. Historical Market Size (US$ Mn) and Market Volume (Mn Units) Analysis By Application, 2015-2019 11.2. Current and Future Market Size (US$ Mn) and Market Volume (Mn Units) Analysis and Forecast By Application, 2020-2030 11.2.1. Corporate 11.2.2. Educational 11.2.3. Others 11.3. Market Attractiveness Analysis By Application 12. Global Interactive Whiteboard Market Analysis 2015-2019 and Forecast 2020-2030, by Operating System 12.1. Historical Market Size (US$ Mn) and Market Volume (Mn Units) Analysis By Operating System, 2015-2019 12.2. Current and Future Market Size (US$ Mn) and Market Volume (Mn Units) Analysis and Forecast By Operating System, 2020-2030 12.2.1. Windows 12.2.2. macOS 12.2.3. Others 12.3. Market Attractiveness Analysis By Operating System 13. Global Interactive Whiteboard Market Analysis 2015-2019 and Forecast 2020-2030, by Region 13.1. Historical Market Size (US$ Mn) and Market Volume (Mn Units) Analysis By Region, 2015-2019 13.2. Current Market Size (US$ Mn) and Market Volume (Mn Units) Analysis and Forecast By Region, 2020-2030 13.2.1. North America 13.2.2. Latin America 13.2.3. Europe 13.2.4. Southeast Asia and Pacific 13.2.5. East Asia 13.2.6. Middle East and Africa 13.3. Market Attractiveness Analysis By Region 14. North America Interactive Whiteboard Market Analysis 2015-2019 and Forecast 2020-2030 14.1. Introduction 14.2. Historical Market Size (US$ Mn) and Market Volume (Mn Units) Trend Analysis By Market Taxonomy, 2015-2019 14.3. Market Size (US$ Mn) and Market Volume (Mn Units) Forecast By Market Taxonomy, 2020-2030 14.3.1. By Country 14.3.1.1. U.S. 14.3.1.2. Canada 14.3.2. By Solution 14.3.3. By Type 14.3.4. By Size 14.3.5. By Application 14.3.6. By Operating System 14.4. Market Attractiveness Analysis 14.4.1. By Country 14.4.2. By Solution 14.4.3. By Type 14.4.4. By Size 14.4.5. By Application 14.4.6. By Operating System 15. Latin America Interactive Whiteboard Market Analysis 2015-2019 and Forecast 2020-2030 15.1. Introduction 15.2. Historical Market Size (US$ Mn) and Market Volume (Mn Units) Trend Analysis By Market Taxonomy, 2015-2019 15.3. Market Size (US$ Mn) and Market Volume (Mn Units) Forecast By Market Taxonomy, 2020-2030 15.3.1. By Country 15.3.1.1. Brazil 15.3.1.2. Mexico 15.3.1.3. Rest of Latin America 15.3.2. By Solution 15.3.3. By Type 15.3.4. By Size 15.3.5. By Application 15.3.6. By Operating System 15.4. Market Attractiveness Analysis 15.4.1. By Country 15.4.2. By Solution 15.4.3. By Type 15.4.4. By Size 15.4.5. By Application 15.4.6. By Operating System 16. Europe Interactive Whiteboard Market Analysis 2015-2019 and Forecast 2020-2030 16.1. Introduction 16.2. Historical Market Size (US$ Mn) and Market Volume (Mn Units) Trend Analysis By Market Taxonomy, 2015-2019 16.3. Market Size (US$ Mn) and Market Volume (Mn Units) Forecast By Market Taxonomy, 2020-2030 16.3.1. By Country 16.3.1.1. Germany 16.3.1.2. Italy 16.3.1.3. France 16.3.1.4. U.K. 16.3.1.5. Spain 16.3.1.6. BENELUX 16.3.1.7. Russia 16.3.1.8. Rest of Europe 16.3.2. By Solution 16.3.3. By Type 16.3.4. By Size 16.3.5. By Application 16.3.6. By Operating System 16.4. Market Attractiveness Analysis 16.4.1. By Country 16.4.2. By Solution 16.4.3. By Type 16.4.4. By Size 16.4.5. By Application 16.4.6. By Operating System 17. Southeast Asia and Pacific Interactive Whiteboard Market Analysis 2015-2019 and Forecast 2020-2030 17.1. Introduction 17.2. Historical Market Size (US$ Mn) and Market Volume (Mn Units) Trend Analysis By Market Taxonomy, 2015-2019 17.3. Market Size (US$ Mn) and Market Volume (Mn Units) Forecast By Market Taxonomy, 2020-2030 17.3.1. By Country 17.3.1.1. India 17.3.1.2. ASEAN 17.3.1.3. Oceania 17.3.1.4. Rest of APAC excluding Japan 17.3.2. By Solution 17.3.3. By Type 17.3.4. By Size 17.3.5. By Application 17.3.6. By Operating System 17.4. Market Attractiveness Analysis 17.4.1. By Country 17.4.2. By Solution 17.4.3. By Type 17.4.4. By Size 17.4.5. By Application 17.4.6. By Operating System 18. East Asia Interactive Whiteboard Market Analysis 2015-2019 and Forecast 2020-2030 18.1. Introduction 18.2. Historical Market Size (US$ Mn) and Market Volume (Mn Units) Trend Analysis By Market Taxonomy, 2015-2019 18.3. Market Size (US$ Mn) and Market Volume (Mn Units) Forecast By Market Taxonomy, 2020-2030 18.3.1. By Country 18.3.1.1. China 18.3.1.2. Japan 18.3.1.3. South Korea 18.3.2. By Solution 18.3.3. By Type 18.3.4. By Size 18.3.5. By Application 18.3.6. By Operating System 18.4. Market Attractiveness Analysis 18.4.1. By Country 18.4.2. By Solution 18.4.3. By Type 18.4.4. By Size 18.4.5. By Application 18.4.6. By Operating System 19. Middle East and Africa Interactive Whiteboard Market Analysis 2015-2019 and Forecast 2020-2030 19.1. Introduction 19.2. Historical Market Size (US$ Mn) and Market Volume (Mn Units) Trend Analysis By Market Taxonomy, 2015-2019 19.3. Market Size (US$ Mn) and Market Volume (Mn Units) Forecast By Market Taxonomy, 2020-2030 19.3.1. By Country 19.3.1.1. GCC Countries 19.3.1.2. Turkey 19.3.1.3. Israel 19.3.1.4. Northern Africa 19.3.1.5. South Africa 19.3.1.6. Rest of Middle East and Africa 19.3.2. By Solution 19.3.3. By Type 19.3.4. By Size 19.3.5. By Application 19.3.6. By Operating System 19.4. Market Attractiveness Analysis 19.4.1. By Country 19.4.2. By Solution 19.4.3. By Type 19.4.4. By Size 19.4.5. By Application 19.4.6. By Operating System 20. Key and Emerging Countries Analysis- Interactive Whiteboards Market 20.1. U.S. Interactive Whiteboards Market Analysis 20.1.1. By Solution 20.1.2. By Type 20.1.3. By Size 20.1.4. By Application 20.1.5. By Operating System 20.2. Canada Interactive Whiteboards Market Analysis 20.2.1. By Solution 20.2.2. By Type 20.2.3. By Size 20.2.4. By Application 20.2.5. By Operating System 20.3. Mexico Interactive Whiteboards Market Analysis 20.3.1. By Solution 20.3.2. By Type 20.3.3. By Size 20.3.4. By Application 20.3.5. By Operating System 20.4. Brazil Interactive Whiteboards Market Analysis 20.4.1. By Solution 20.4.2. By Type 20.4.3. By Size 20.4.4. By Application 20.4.5. By Operating System 20.5. Germany Interactive Whiteboards Market Analysis 20.5.1. By Solution 20.5.2. By Type 20.5.3. By Size 20.5.4. By Application 20.5.5. By Operating System 20.6. Italy Interactive Whiteboards Market Analysis 20.6.1. By Solution 20.6.2. By Type 20.6.3. By Size 20.6.4. By Application 20.6.5. By Operating System 20.7. France Interactive Whiteboards Market Analysis 20.7.1. By Solution 20.7.2. By Type 20.7.3. By Size 20.7.4. By Application 20.7.5. By Operating System 20.8. U.K. Interactive Whiteboards Market Analysis 20.8.1. By Solution 20.8.2. By Type 20.8.3. By Size 20.8.4. By Application 20.8.5. By Operating System 20.9. Spain Interactive Whiteboards Market Analysis 20.9.1. By Solution 20.9.2. By Type 20.9.3. By Size 20.9.4. By Application 20.9.5. By Operating System 20.10. BENELUX Interactive Whiteboards Market Analysis 20.10.1. By Solution 20.10.2. By Type 20.10.3. By Size 20.10.4. By Application 20.10.5. By Operating System 20.11. Russia Interactive Whiteboards Market Analysis 20.11.1. By Solution 20.11.2. By Type 20.11.3. By Size 20.11.4. By Application 20.11.5. By Operating System 20.12. China Interactive Whiteboards Market Analysis 20.12.1. By Solution 20.12.2. By Type 20.12.3. By Size 20.12.4. By Application 20.12.5. By Operating System 20.13. Japan Interactive Whiteboards Market Analysis 20.13.1. By Solution 20.13.2. By Type 20.13.3. By Size 20.13.4. By Application 20.13.5. By Operating System 20.14. South Korea Interactive Whiteboards Market Analysis 20.14.1. By Solution 20.14.2. By Type 20.14.3. By Size 20.14.4. By Application 20.14.5. By Operating System 20.15. India Interactive Whiteboards Market Analysis 20.15.1. By Solution 20.15.2. By Type 20.15.3. By Size 20.15.4. By Application 20.15.5. By Operating System 20.16. ASEAN Interactive Whiteboards Market Analysis 20.16.1. By Solution 20.16.2. By Type 20.16.3. By Size 20.16.4. By Application 20.16.5. By Operating System 20.17. Australia and New Zealand Interactive Whiteboards Market Analysis 20.17.1. By Solution 20.17.2. By Type 20.17.3. By Size 20.17.4. By Application 20.17.5. By Operating System 20.18. GCC Countries Interactive Whiteboards Market Analysis 20.18.1. By Solution 20.18.2. By Type 20.18.3. By Size 20.18.4. By Application 20.18.5. By Operating System 20.19. Turkey Interactive Whiteboards Market Analysis 20.19.1. By Solution 20.19.2. By Type 20.19.3. By Size 20.19.4. By Application 20.19.5. By Operating System 20.20. South Africa Interactive Whiteboards Market Analysis 20.20.1. By Solution 20.20.2. By Type 20.20.3. By Size 20.20.4. By Application 20.20.5. By Operating System 21. Market Structure Analysis 21.1. Market Analysis by Position of Companies 21.2. Market Concentration 21.3. Market Share Analysis of Top Players 22. Competition Analysis 22.1. Competition Dashboard 22.2. Competition Deep Dive 22.2.1. Xiamen Interactive Technology Co., Ltd 22.2.1.1. Overview 22.2.1.2. Product Portfolio 22.2.1.3. Profitability by Market Segments (Product/Channel/Region) 22.2.1.4. Sales Footprint 22.2.1.5. Strategy Overview 22.2.1.5.1. Marketing Strategy 22.2.1.5.2. Product Strategy 22.2.1.5.3. Channel Strategy 22.2.2. SMART Technologies ULC 22.2.2.1. Overview 22.2.2.2. Product Portfolio 22.2.2.3. Profitability by Market Segments (Product/Channel/Region) 22.2.2.4. Sales Footprint 22.2.2.5. Strategy Overview 22.2.2.5.1. Marketing Strategy 22.2.2.5.2. Product Strategy 22.2.2.5.3. Channel Strategy 22.2.3. PROMETHEAN LIMITED 22.2.3.1. Overview 22.2.3.2. Product Portfolio 22.2.3.3. Profitability by Market Segments (Product/Channel/Region) 22.2.3.4. Sales Footprint 22.2.3.5. Strategy Overview 22.2.3.5.1. Marketing Strategy 22.2.3.5.2. Product Strategy 22.2.3.5.3. Channel Strategy 22.2.4. Boxlight 22.2.4.1. Overview 22.2.4.2. Product Portfolio 22.2.4.3. Profitability by Market Segments (Product/Channel/Region) 22.2.4.4. Sales Footprint 22.2.4.5. Strategy Overview 22.2.4.5.1. Marketing Strategy 22.2.4.5.2. Product Strategy 22.2.4.5.3. Channel Strategy 22.2.5. Genee World Ltd 22.2.5.1. Overview 22.2.5.2. Product Portfolio 22.2.5.3. Profitability by Market Segments (Product/Channel/Region) 22.2.5.4. Sales Footprint 22.2.5.5. Strategy Overview 22.2.5.5.1. Marketing Strategy 22.2.5.5.2. Product Strategy 22.2.5.5.3. Channel Strategy 22.2.6. I3 SOLUTIONS 22.2.6.1. Overview 22.2.6.2. Product Portfolio 22.2.6.3. Profitability by Market Segments (Product/Channel/Region) 22.2.6.4. Sales Footprint 22.2.6.5. Strategy Overview 22.2.6.5.1. Marketing Strategy 22.2.6.5.2. Product Strategy 22.2.6.5.3. Channel Strategy 22.2.7. Ricoh 22.2.7.1. Overview 22.2.7.2. Product Portfolio 22.2.7.3. Profitability by Market Segments (Product/Channel/Region) 22.2.7.4. Sales Footprint 22.2.7.5. Strategy Overview 22.2.7.5.1. Marketing Strategy 22.2.7.5.2. Product Strategy 22.2.7.5.3. Channel Strategy 22.2.8. Starboard Solution 22.2.8.1. Overview 22.2.8.2. Product Portfolio 22.2.8.3. Profitability by Market Segments (Product/Channel/Region) 22.2.8.4. Sales Footprint 22.2.8.5. Strategy Overview 22.2.8.5.1. Marketing Strategy 22.2.8.5.2. Product Strategy 22.2.8.5.3. Channel Strategy 22.2.9. TRIUMPH BOARD a.s. 22.2.9.1. Overview 22.2.9.2. Product Portfolio 22.2.9.3. Profitability by Market Segments (Product/Channel/Region) 22.2.9.4. Sales Footprint 22.2.9.5. Strategy Overview 22.2.9.5.1. Marketing Strategy 22.2.9.5.2. Product Strategy 22.2.9.5.3. Channel Strategy 22.2.10. Sharp Corporation 22.2.10.1. Overview 22.2.10.2. Product Portfolio 22.2.10.3. Profitability by Market Segments (Product/Channel/Region) 22.2.10.4. Sales Footprint 22.2.10.5. Strategy Overview 22.2.10.5.1. Marketing Strategy 22.2.10.5.2. Product Strategy 22.2.10.5.3. Channel Strategy 22.2.11. Hitachi Interactive Solutions 22.2.11.1. Overview 22.2.11.2. Product Portfolio 22.2.11.3. Profitability by Market Segments (Product/Channel/Region) 22.2.11.4. Sales Footprint 22.2.11.5. Strategy Overview 22.2.11.5.1. Marketing Strategy 22.2.11.5.2. Product Strategy 22.2.11.5.3. Channel Strategy 22.2.12. ELMO Company Limited 22.2.12.1. Overview 22.2.12.2. Product Portfolio 22.2.12.3. Profitability by Market Segments (Product/Channel/Region) 22.2.12.4. Sales Footprint 22.2.12.5. Strategy Overview 22.2.12.5.1. Marketing Strategy 22.2.12.5.2. Product Strategy 22.2.12.5.3. Channel Strategy 22.2.13. BenQ 22.2.13.1. Overview 22.2.13.2. Product Portfolio 22.2.13.3. Profitability by Market Segments (Product/Channel/Region) 22.2.13.4. Sales Footprint 22.2.13.5. Strategy Overview 22.2.13.5.1. Marketing Strategy 22.2.13.5.2. Product Strategy 22.2.13.5.3. Channel Strategy 22.2.14. Seiko Epson Corporation 22.2.14.1. Overview 22.2.14.2. Product Portfolio 22.2.14.3. Profitability by Market Segments (Product/Channel/Region) 22.2.14.4. Sales Footprint 22.2.14.5. Strategy Overview 22.2.14.5.1. Marketing Strategy 22.2.14.5.2. Product Strategy 22.2.14.5.3. Channel Strategy 22.2.15. InFocus Corporation 22.2.15.1. Overview 22.2.15.2. Product Portfolio 22.2.15.3. Profitability by Market Segments (Product/Channel/Region) 22.2.15.4. Sales Footprint 22.2.15.5. Strategy Overview 22.2.15.5.1. Marketing Strategy 22.2.15.5.2. Product Strategy 22.2.15.5.3. Channel Strategy 23. Assumptions and Acronyms Used 24. Research Methodology
Don't pay for what you don't need
Customize your report by selecting specific countries or regions and save 30%!
List of Tables
Table 01: Global Virtual Events Market Value Analysis (2015 – 2019) and Forecast (2020 – 2030) by Solution Table 02: Global Virtual Events Market Volume Analysis (2015 – 2019) and Forecast (2020 – 2030) by Solution Table 03: Global Virtual Events Market Value Analysis (2015 – 2019) and Forecast (2020 – 2030) by Type Table 04: Global Virtual Events Market Volume Analysis (2015 – 2019) and Forecast (2020 – 2030) by Type Table 05: Global Virtual Events Market Value Analysis (2015 – 2019) and Forecast (2020 – 2030) by Size Table 06: Global Virtual Events Market Volume Analysis (2015 – 2019) and Forecast (2020 – 2030) by Size Table 07: Global Virtual Events Market Value Analysis (2015 – 2019) and Forecast (2020 – 2030) by Application Table 08: Global Virtual Events Market Volume Analysis (2015 – 2019) and Forecast (2020 – 2030) by Application Table 09: Global Virtual Events Market Value Analysis (2015 – 2019) and Forecast (2020 – 2030) by Operating System Table 10: Global Virtual Events Market Volume Analysis (2015 – 2019) and Forecast (2020 – 2030) by Operating System Table 11: Global Virtual Events Market Value Analysis (2015 – 2019) and Forecast (2020 – 2030) by Region Table 12: Global Virtual Events Market Volume Analysis (2015 – 2019) and Forecast (2020 – 2030) by Region Table 13: North America Virtual Events Market Value Analysis (2015 – 2019) and Forecast (2020 – 2030) by Solution Table 14: North America Virtual Events Market Volume Analysis (2015 – 2019) and Forecast (2020 – 2030) by Solution Table 15: North America Virtual Events Market Value Analysis (2015 – 2019) and Forecast (2020 – 2030) by Type Table 16: North America Virtual Events Market Volume Analysis (2015 – 2019) and Forecast (2020 – 2030) by Type Table 17: North America Virtual Events Market Value Analysis (2015 – 2019) and Forecast (2020 – 2030) by Size Table 18: North America Virtual Events Market Volume Analysis (2015 – 2019) and Forecast (2020 – 2030) by Size Table 19: North America Virtual Events Market Value Analysis (2015 – 2019) and Forecast (2020 – 2030) by Application Table 20: North America Virtual Events Market Volume Analysis (2015 – 2019) and Forecast (2020 – 2030) by Application Table 21: North America Virtual Events Market Value Analysis (2015 – 2019) and Forecast (2020 – 2030) by Operating System Table 22: North America Virtual Events Market Volume Analysis (2015 – 2019) and Forecast (2020 – 2030) by Operating System Table 23: North America Virtual Events Market Value Analysis (2015 – 2019) and Forecast (2020 – 2030) by Country Table 24: North America Virtual Events Market Volume Analysis (2015 – 2019) and Forecast (2020 – 2030) by Country Table 25: Latin America Virtual Events Market Value Analysis (2015 – 2019) and Forecast (2020 – 2030) by Solution Table 26: Latin America Virtual Events Market Volume Analysis (2015 – 2019) and Forecast (2020 – 2030) by Solution Table 27: Latin America Virtual Events Market Value Analysis (2015 – 2019) and Forecast (2020 – 2030) by Type Table 28: Latin America Virtual Events Market Volume Analysis (2015 – 2019) and Forecast (2020 – 2030) by Type Table 29: Latin America Virtual Events Market Value Analysis (2015 – 2019) and Forecast (2020 – 2030) by Size Table 30: Latin America Virtual Events Market Volume Analysis (2015 – 2019) and Forecast (2020 – 2030) by Size Table 31: Latin America Virtual Events Market Value Analysis (2015 – 2019) and Forecast (2020 – 2030) by Application Table 32: Latin America Virtual Events Market Volume Analysis (2015 – 2019) and Forecast (2020 – 2030) by Application Table 33: Latin America Virtual Events Market Value Analysis (2015 – 2019) and Forecast (2020 – 2030) by Operating System Table 34: Latin America Virtual Events Market Volume Analysis (2015 – 2019) and Forecast (2020 – 2030) by Operating System Table 35: Latin America Virtual Events Market Value Analysis (2015 – 2019) and Forecast (2020 – 2030) by Country Table 36: Latin America Virtual Events Market Volume Analysis (2015 – 2019) and Forecast (2020 – 2030) by Country Table 37: Europe Virtual Events Market Value Analysis (2015 – 2019) and Forecast (2020 – 2030) by Solution Table 38: Europe Virtual Events Market Volume Analysis (2015 – 2019) and Forecast (2020 – 2030) by Solution Table 39: Europe Virtual Events Market Value Analysis (2015 – 2019) and Forecast (2020 – 2030) by Type Table 40: Europe Virtual Events Market Volume Analysis (2015 – 2019) and Forecast (2020 – 2030) by Type Table 41: Europe Virtual Events Market Value Analysis (2015 – 2019) and Forecast (2020 – 2030) by Size Table 42: Europe Virtual Events Market Volume Analysis (2015 – 2019) and Forecast (2020 – 2030) by Size Table 43: Europe Virtual Events Market Value Analysis (2015 – 2019) and Forecast (2020 – 2030) by Application Table 44: Europe Virtual Events Market Volume Analysis (2015 – 2019) and Forecast (2020 – 2030) by Application Table 45: Europe Virtual Events Market Value Analysis (2015 – 2019) and Forecast (2020 – 2030) by Operating System Table 46: Europe Virtual Events Market Volume Analysis (2015 – 2019) and Forecast (2020 – 2030) by Operating System Table 47: Europe Virtual Events Market Value Analysis (2015 – 2019) and Forecast (2020 – 2030) by Country Table 48: Europe Virtual Events Market Volume Analysis (2015 – 2019) and Forecast (2020 – 2030) by Country Table 49: Southeast Asia and Pacific Virtual Events Market Value Analysis (2015 – 2019) and Forecast (2020 – 2030) by Solution Table 50: Southeast Asia and Pacific Virtual Events Market Volume Analysis (2015 – 2019) and Forecast (2020 – 2030) by Solution Table 51: Southeast Asia and Pacific Virtual Events Market Value Analysis (2015 – 2019) and Forecast (2020 – 2030) by Type Table 52: Southeast Asia and Pacific Virtual Events Market Volume Analysis (2015 – 2019) and Forecast (2020 – 2030) by Type Table 53: Southeast Asia and Pacific Virtual Events Market Value Analysis (2015 – 2019) and Forecast (2020 – 2030) by Size Table 54: Southeast Asia and Pacific Virtual Events Market Volume Analysis (2015 – 2019) and Forecast (2020 – 2030) by Size Table 55: Southeast Asia and Pacific Virtual Events Market Value Analysis (2015 – 2019) and Forecast (2020 – 2030) by Application Table 56: Southeast Asia and Pacific Virtual Events Market Volume Analysis (2015 – 2019) and Forecast (2020 – 2030) by Application Table 57: Southeast Asia and Pacific Virtual Events Market Value Analysis (2015 – 2019) and Forecast (2020 – 2030) by Operating System Table 58: Southeast Asia and Pacific Virtual Events Market Volume Analysis (2015 – 2019) and Forecast (2020 – 2030) by Operating System Table 59: Southeast Asia and Pacific Virtual Events Market Value Analysis (2015 – 2019) and Forecast (2020 – 2030) by Country Table 60: Southeast Asia and Pacific Virtual Events Market Volume Analysis (2015 – 2019) and Forecast (2020 – 2030) by Country Table 61: East Asia Virtual Events Market Value Analysis (2015 – 2019) and Forecast (2020 – 2030) by Solution Table 62: East Asia Virtual Events Market Volume Analysis (2015 – 2019) and Forecast (2020 – 2030) by Solution Table 63: East Asia Virtual Events Market Value Analysis (2015 – 2019) and Forecast (2020 – 2030) by Type Table 64: East Asia Virtual Events Market Volume Analysis (2015 – 2019) and Forecast (2020 – 2030) by Type Table 65: East Asia Virtual Events Market Value Analysis (2015 – 2019) and Forecast (2020 – 2030) by Size Table 66: East Asia Virtual Events Market Volume Analysis (2015 – 2019) and Forecast (2020 – 2030) by Size Table 67: East Asia Virtual Events Market Value Analysis (2015 – 2019) and Forecast (2020 – 2030) by Application Table 68: East Asia Virtual Events Market Volume Analysis (2015 – 2019) and Forecast (2020 – 2030) by Application Table 69: East Asia Virtual Events Market Value Analysis (2015 – 2019) and Forecast (2020 – 2030) by Operating System Table 70: East Asia Virtual Events Market Volume Analysis (2015 – 2019) and Forecast (2020 – 2030) by Operating System Table 71: East Asia Virtual Events Market Value Analysis (2015 – 2019) and Forecast (2020 – 2030) by Country Table 72: East Asia Virtual Events Market Volume Analysis (2015 – 2019) and Forecast (2020 – 2030) by Country Table 73: Middle East and Africa Virtual Events Market Value Analysis (2015 – 2019) and Forecast (2020 – 2030) by Solution Table 74: Middle East and Africa Virtual Events Market Volume Analysis (2015 – 2019) and Forecast (2020 – 2030) by Solution Table 75: Middle East and Africa Virtual Events Market Value Analysis (2015 – 2019) and Forecast (2020 – 2030) by Type Table 76: Middle East and Africa Virtual Events Market Volume Analysis (2015 – 2019) and Forecast (2020 – 2030) by Type Table 77: Middle East and Africa Virtual Events Market Value Analysis (2015 – 2019) and Forecast (2020 – 2030) by Size Table 78: Middle East and Africa Virtual Events Market Volume Analysis (2015 – 2019) and Forecast (2020 – 2030) by Size Table 79: Middle East and Africa Virtual Events Market Value Analysis (2015 – 2019) and Forecast (2020 – 2030) by Application Table 80: Middle East and Africa Virtual Events Market Volume Analysis (2015 – 2019) and Forecast (2020 – 2030) by Application Table 81: Middle East and Africa Virtual Events Market Value Analysis (2015 – 2019) and Forecast (2020 – 2030) by Operating System Table 82: Middle East and Africa Virtual Events Market Volume Analysis (2015 – 2019) and Forecast (2020 – 2030) by Operating System Table 83: Middle East and Africa Virtual Events Market Value Analysis (2015 – 2019) and Forecast (2020 – 2030) by Country Table 84: Middle East and Africa Virtual Events Market Volume Analysis (2015 – 2019) and Forecast (2020 – 2030) by Country
List of Charts
Figure 01: Global Interactive Whiteboards Market Size (US$ Mn) Forecast and Y-o-Y Growth Rate (%) from 2020 – 2030 Figure 02: Global Interactive Whiteboards Market Absolute $ Opportunity (US$ Mn), 2015 – 2030 Figure 03: Global Interactive Whiteboards Market Incremental Opportunity (US$ Mn) Analysis by Region, 2020 – 2030 Figure 04: Global Interactive Whiteboards Market Incremental Opportunity (US$ Mn) Analysis by Solution, 2020 – 2030 Figure 05: Global Interactive Whiteboards Market Incremental Opportunity (US$ Mn) Analysis by Type, 2020 – 2030 Figure 06: Global Interactive Whiteboards Market Incremental Opportunity (US$ Mn) Analysis by Size, 2020 – 2030 Figure 07: Global Interactive Whiteboards Market Incremental Opportunity (US$ Mn) Analysis by Application, 2020 – 2030 Figure 08: Global Interactive Whiteboards Market Incremental Opportunity (US$ Mn) Analysis by Operating System, 2020 – 2030 Figure 09: Global Interactive Whiteboards Market Share Analysis (2020 – 2030) by Solution Figure 10: Global Interactive Whiteboards Market Attractiveness by Solution Figure 11: Global Interactive Whiteboards Market Y-o-Y Growth Trend Analysis (2018 – 2030) by Solution Figure 12: Global Interactive Whiteboards Market Share Analysis (2020 – 2030) by Type Figure 13: Global Interactive Whiteboards Market Attractiveness by Type Figure 14: Global Interactive Whiteboards Market Y-o-Y Growth Trend Analysis (2018 – 2030) by Type Figure 15: Global Interactive Whiteboards Market Share Analysis (2020 – 2030) by Size Figure 16: Global Interactive Whiteboards Market Attractiveness by Size Figure 17: Global Interactive Whiteboards Market Y-o-Y Growth Trend Analysis (2018 – 2030) by Size Figure 18: Global Interactive Whiteboards Market Share Analysis (2020 – 2030) by Application Figure 19: Global Interactive Whiteboards Market Attractiveness by Application Figure 20: Global Interactive Whiteboards Market Y-o-Y Growth Trend Analysis (2018 – 2030) by Application Figure 21: Global Interactive Whiteboards Market Share Analysis (2020 – 2030) by Operating System Figure 22: Global Interactive Whiteboards Market Attractiveness by Operating System Figure 23: Global Interactive Whiteboards Market Y-o-Y Growth Trend Analysis (2018 – 2030) by Operating System Figure 24: Global Interactive Whiteboards Market Share Analysis (2020 – 2030) by Region Figure 25: Global Interactive Whiteboards Market Attractiveness by Region Figure 26: Global Interactive Whiteboards Market Y-o-Y Growth Trend Analysis (2018 – 2030) by Region Figure 27: North America Interactive Whiteboards Market Size (US$ Mn) Forecast and Y-o-Y Growth Rate (%) from 2020 – 2030 Figure 28: North America Interactive Whiteboards Market Absolute $ Opportunity (US$ Mn), 2015 – 2030 Figure 29: North America Interactive Whiteboards Market Incremental Opportunity (US$ Mn) Analysis by Country, 2020 – 2030 Figure 30: North America Interactive Whiteboards Market Incremental Opportunity (US$ Mn) Analysis by Solution, 2020 – 2030 Figure 31: North America Interactive Whiteboards Market Incremental Opportunity (US$ Mn) Analysis by Type, 2020 – 2030 Figure 32: North America Interactive Whiteboards Market Incremental Opportunity (US$ Mn) Analysis by Size, 2020 – 2030 Figure 33: North America Interactive Whiteboards Market Incremental Opportunity (US$ Mn) Analysis by Application, 2020 – 2030 Figure 34: North America Interactive Whiteboards Market Incremental Opportunity (US$ Mn) Analysis by Operating System, 2020 – 2030 Figure 35: North America Interactive Whiteboards Market Share Analysis (2020 – 2030) by Solution Figure 36: North America Interactive Whiteboards Market Attractiveness by Solution Figure 37: North America Interactive Whiteboards Market Y-o-Y Growth Trend Analysis (2018 – 2030) by Solution Figure 38: North America Interactive Whiteboards Market Share Analysis (2020 – 2030) by Type Figure 39: North America Interactive Whiteboards Market Attractiveness by Type Figure 40: North America Interactive Whiteboards Market Y-o-Y Growth Trend Analysis (2018 – 2030) by Type Figure 41: North America Interactive Whiteboards Market Share Analysis (2020 – 2030) by Size Figure 42: North America Interactive Whiteboards Market Attractiveness by Size Figure 43: North America Interactive Whiteboards Market Y-o-Y Growth Trend Analysis (2018 – 2030) by Size Figure 44: North America Interactive Whiteboards Market Share Analysis (2020 – 2030) by Application Figure 45: North America Interactive Whiteboards Market Attractiveness by Application Figure 46: North America Interactive Whiteboards Market Y-o-Y Growth Trend Analysis (2018 – 2030) by Application Figure 47: North America Interactive Whiteboards Market Share Analysis (2020 – 2030) by Operating System Figure 48: North America Interactive Whiteboards Market Attractiveness by Operating System Figure 49: North America Interactive Whiteboards Market Y-o-Y Growth Trend Analysis (2018 – 2030) by Operating System Figure 50: North America Interactive Whiteboards Market Share Analysis (2020 – 2030) by Country Figure 51: North America Interactive Whiteboards Market Attractiveness by Country Figure 52: North America Interactive Whiteboards Market Y-o-Y Growth Trend Analysis (2018 – 2030) by Country Figure 53: Latin America Interactive Whiteboards Market Size (US$ Mn) Forecast and Y-o-Y Growth Rate (%) from 2020 – 2030 Figure 54: Latin America Interactive Whiteboards Market Absolute $ Opportunity (US$ Mn), 2015 – 2030 Figure 55: Latin America Interactive Whiteboards Market Incremental Opportunity (US$ Mn) Analysis by Country, 2020 – 2030 Figure 56: Latin America Interactive Whiteboards Market Incremental Opportunity (US$ Mn) Analysis by Solution, 2020 – 2030 Figure 57: Latin America Interactive Whiteboards Market Incremental Opportunity (US$ Mn) Analysis by Type, 2020 – 2030 Figure 58: Latin America Interactive Whiteboards Market Incremental Opportunity (US$ Mn) Analysis by Size, 2020 – 2030 Figure 59: Latin America Interactive Whiteboards Market Incremental Opportunity (US$ Mn) Analysis by Application, 2020 – 2030 Figure 60: Latin America Interactive Whiteboards Market Incremental Opportunity (US$ Mn) Analysis by Operating System, 2020 – 2030 Figure 61: Latin America Interactive Whiteboards Market Share Analysis (2020 – 2030) by Solution Figure 62: Latin America Interactive Whiteboards Market Attractiveness by Solution Figure 63: Latin America Interactive Whiteboards Market Y-o-Y Growth Trend Analysis (2018 – 2030) by Solution Figure 64: Latin America Interactive Whiteboards Market Share Analysis (2020 – 2030) by Type Figure 65: Latin America Interactive Whiteboards Market Attractiveness by Type Figure 66: Latin America Interactive Whiteboards Market Y-o-Y Growth Trend Analysis (2018 – 2030) by Type Figure 67: Latin America Interactive Whiteboards Market Share Analysis (2020 – 2030) by Size Figure 68: Latin America Interactive Whiteboards Market Attractiveness by Size Figure 69: Latin America Interactive Whiteboards Market Y-o-Y Growth Trend Analysis (2018 – 2030) by Size Figure 70: Latin America Interactive Whiteboards Market Share Analysis (2020 – 2030) by Application Figure 71: Latin America Interactive Whiteboards Market Attractiveness by Application Figure 72: Latin America Interactive Whiteboards Market Y-o-Y Growth Trend Analysis (2018 – 2030) by Application Figure 73: Latin America Interactive Whiteboards Market Share Analysis (2020 – 2030) by Operating System Figure 74: Latin America Interactive Whiteboards Market Attractiveness by Operating System Figure 75: Latin America Interactive Whiteboards Market Y-o-Y Growth Trend Analysis (2018 – 2030) by Operating System Figure 76: Latin America Interactive Whiteboards Market Share Analysis (2020 – 2030) by Country Figure 77: Latin America Interactive Whiteboards Market Attractiveness by Country Figure 78: Latin America Interactive Whiteboards Market Y-o-Y Growth Trend Analysis (2018 – 2030) by Country Figure 79: Europe Interactive Whiteboards Market Size (US$ Mn) Forecast and Y-o-Y Growth Rate (%) from 2020 – 2030 Figure 80: Europe Interactive Whiteboards Market Absolute $ Opportunity (US$ Mn), 2015 – 2030 Figure 81: Europe Interactive Whiteboards Market Incremental Opportunity (US$ Mn) Analysis by Country, 2020 – 2030 Figure 82: Europe Interactive Whiteboards Market Incremental Opportunity (US$ Mn) Analysis by Solution, 2020 – 2030 Figure 83: Europe Interactive Whiteboards Market Incremental Opportunity (US$ Mn) Analysis by Type, 2020 – 2030 Figure 84: Europe Interactive Whiteboards Market Incremental Opportunity (US$ Mn) Analysis by Size, 2020 – 2030 Figure 85: Europe Interactive Whiteboards Market Incremental Opportunity (US$ Mn) Analysis by Application, 2020 – 2030 Figure 86: Europe Interactive Whiteboards Market Incremental Opportunity (US$ Mn) Analysis by Operating System, 2020 – 2030 Figure 87: Europe Interactive Whiteboards Market Share Analysis (2020 – 2030) by Solution Figure 88: Europe Interactive Whiteboards Market Attractiveness by Solution Figure 89: Europe Interactive Whiteboards Market Y-o-Y Growth Trend Analysis (2018 – 2030) by Solution Figure 90: Europe Interactive Whiteboards Market Share Analysis (2020 – 2030) by Type Figure 91: Europe Interactive Whiteboards Market Attractiveness by Type Figure 92: Europe Interactive Whiteboards Market Y-o-Y Growth Trend Analysis (2018 – 2030) by Type Figure 93: Europe Interactive Whiteboards Market Share Analysis (2020 – 2030) by Size Figure 94: Europe Interactive Whiteboards Market Attractiveness by Size Figure 95: Europe Interactive Whiteboards Market Y-o-Y Growth Trend Analysis (2018 – 2030) by Size Figure 96: Europe Interactive Whiteboards Market Share Analysis (2020 – 2030) by Application Figure 97: Europe Interactive Whiteboards Market Attractiveness by Application Figure 98: Europe Interactive Whiteboards Market Y-o-Y Growth Trend Analysis (2018 – 2030) by Application Figure 99: Europe Interactive Whiteboards Market Share Analysis (2020 – 2030) by Operating System Figure 100: Europe Interactive Whiteboards Market Attractiveness by Operating System Figure 101: Europe Interactive Whiteboards Market Y-o-Y Growth Trend Analysis (2018 – 2030) by Operating System Figure 102: Europe Interactive Whiteboards Market Share Analysis (2020 – 2030) by Country Figure 103: Europe Interactive Whiteboards Market Attractiveness by Country Figure 104: Europe Interactive Whiteboards Market Y-o-Y Growth Trend Analysis (2018 – 2030) by Country Figure 105: Southeast Asia and Pacific Interactive Whiteboards Market Size (US$ Mn) Forecast and Y-o-Y Growth Rate (%) from 2020 – 2030 Figure 106: Southeast Asia and Pacific Interactive Whiteboards Market Absolute $ Opportunity (US$ Mn), 2015 – 2030 Figure 107: Southeast Asia and Pacific Interactive Whiteboards Market Incremental Opportunity (US$ Mn) Analysis by Country, 2020 – 2030 Figure 108: Southeast Asia and Pacific Interactive Whiteboards Market Incremental Opportunity (US$ Mn) Analysis by Solution, 2020 – 2030 Figure 109: Southeast Asia and Pacific Interactive Whiteboards Market Incremental Opportunity (US$ Mn) Analysis by Type, 2020 – 2030 Figure 110: Southeast Asia and Pacific Interactive Whiteboards Market Incremental Opportunity (US$ Mn) Analysis by Size, 2020 – 2030 Figure 111: Southeast Asia and Pacific Interactive Whiteboards Market Incremental Opportunity (US$ Mn) Analysis by Application, 2020 – 2030 Figure 112: Southeast Asia and Pacific Interactive Whiteboards Market Incremental Opportunity (US$ Mn) Analysis by Operating System, 2020 – 2030 Figure 113: Southeast Asia and Pacific Interactive Whiteboards Market Share Analysis (2020 – 2030) by Solution Figure 114: Southeast Asia and Pacific Interactive Whiteboards Market Attractiveness by Solution Figure 115: Southeast Asia and Pacific Interactive Whiteboards Market Y-o-Y Growth Trend Analysis (2018 – 2030) by Solution Figure 116: Southeast Asia and Pacific Interactive Whiteboards Market Share Analysis (2020 – 2030) by Type Figure 117: Southeast Asia and Pacific Interactive Whiteboards Market Attractiveness by Type Figure 118: Southeast Asia and Pacific Interactive Whiteboards Market Y-o-Y Growth Trend Analysis (2018 – 2030) by Type Figure 119: Southeast Asia and Pacific Interactive Whiteboards Market Share Analysis (2020 – 2030) by Size Figure 120: Southeast Asia and Pacific Interactive Whiteboards Market Attractiveness by Size Figure 121: Southeast Asia and Pacific Interactive Whiteboards Market Y-o-Y Growth Trend Analysis (2018 – 2030) by Size Figure 122: Southeast Asia and Pacific Interactive Whiteboards Market Share Analysis (2020 – 2030) by Application Figure 123: Southeast Asia and Pacific Interactive Whiteboards Market Attractiveness by Application Figure 124: Southeast Asia and Pacific Interactive Whiteboards Market Y-o-Y Growth Trend Analysis (2018 – 2030) by Application Figure 125: Southeast Asia and Pacific Interactive Whiteboards Market Share Analysis (2020 – 2030) by Operating System Figure 126: Southeast Asia and Pacific Interactive Whiteboards Market Attractiveness by Operating System Figure 127: Southeast Asia and Pacific Interactive Whiteboards Market Y-o-Y Growth Trend Analysis (2018 – 2030) by Operating System Figure 128: Southeast Asia and Pacific Interactive Whiteboards Market Share Analysis (2020 – 2030) by Country Figure 129: Southeast Asia and Pacific Interactive Whiteboards Market Attractiveness by Country Figure 130: Southeast Asia and Pacific Interactive Whiteboards Market Y-o-Y Growth Trend Analysis (2018 – 2030) by Country Figure 131: East Asia Interactive Whiteboards Market Size (US$ Mn) Forecast and Y-o-Y Growth Rate (%) from 2020 – 2030 Figure 132: East Asia Interactive Whiteboards Market Absolute $ Opportunity (US$ Mn), 2015 – 2030 Figure 133: East Asia Interactive Whiteboards Market Incremental Opportunity (US$ Mn) Analysis by Country, 2020 – 2030 Figure 134: East Asia Interactive Whiteboards Market Incremental Opportunity (US$ Mn) Analysis by Solution, 2020 – 2030 Figure 135: East Asia Interactive Whiteboards Market Incremental Opportunity (US$ Mn) Analysis by Type, 2020 – 2030 Figure 136: East Asia Interactive Whiteboards Market Incremental Opportunity (US$ Mn) Analysis by Size, 2020 – 2030 Figure 137: East Asia Interactive Whiteboards Market Incremental Opportunity (US$ Mn) Analysis by Application, 2020 – 2030 Figure 138: East Asia Interactive Whiteboards Market Incremental Opportunity (US$ Mn) Analysis by Operating System, 2020 – 2030 Figure 139: East Asia Interactive Whiteboards Market Share Analysis (2020 – 2030) by Solution Figure 140: East Asia Interactive Whiteboards Market Attractiveness by Solution Figure 141: East Asia Interactive Whiteboards Market Y-o-Y Growth Trend Analysis (2018 – 2030) by Solution Figure 142: East Asia Interactive Whiteboards Market Share Analysis (2020 – 2030) by Type Figure 143: East Asia Interactive Whiteboards Market Attractiveness by Type Figure 144: East Asia Interactive Whiteboards Market Y-o-Y Growth Trend Analysis (2018 – 2030) by Type Figure 145: East Asia Interactive Whiteboards Market Share Analysis (2020 – 2030) by Size Figure 146: East Asia Interactive Whiteboards Market Attractiveness by Size Figure 147: East Asia Interactive Whiteboards Market Y-o-Y Growth Trend Analysis (2018 – 2030) by Size Figure 148: East Asia Interactive Whiteboards Market Share Analysis (2020 – 2030) by Application Figure 149: East Asia Interactive Whiteboards Market Attractiveness by Application Figure 150: East Asia Interactive Whiteboards Market Y-o-Y Growth Trend Analysis (2018 – 2030) by Application Figure 151: East Asia Interactive Whiteboards Market Share Analysis (2020 – 2030) by Operating System Figure 152: East Asia Interactive Whiteboards Market Attractiveness by Operating System Figure 153: East Asia Interactive Whiteboards Market Y-o-Y Growth Trend Analysis (2018 – 2030) by Operating System Figure 154: East Asia Interactive Whiteboards Market Share Analysis (2020 – 2030) by Country Figure 155: East Asia Interactive Whiteboards Market Attractiveness by Country Figure 156: East Asia Interactive Whiteboards Market Y-o-Y Growth Trend Analysis (2018 – 2030) by Country Figure 157: Middle East and Africa Interactive Whiteboards Market Size (US$ Mn) Forecast and Y-o-Y Growth Rate (%) from 2020 – 2030 Figure 158: Middle East and Africa Interactive Whiteboards Market Absolute $ Opportunity (US$ Mn), 2015 – 2030 Figure 159: Middle East and Africa Interactive Whiteboards Market Incremental Opportunity (US$ Mn) Analysis by Country, 2020 – 2030 Figure 160: Middle East and Africa Interactive Whiteboards Market Incremental Opportunity (US$ Mn) Analysis by Solution, 2020 – 2030 Figure 161: Middle East and Africa Interactive Whiteboards Market Incremental Opportunity (US$ Mn) Analysis by Type, 2020 – 2030 Figure 162: Middle East and Africa Interactive Whiteboards Market Incremental Opportunity (US$ Mn) Analysis by Size, 2020 – 2030 Figure 163: Middle East and Africa Interactive Whiteboards Market Incremental Opportunity (US$ Mn) Analysis by Application, 2020 – 2030 Figure 164: Middle East and Africa Interactive Whiteboards Market Incremental Opportunity (US$ Mn) Analysis by Operating System, 2020 – 2030 Figure 165: Middle East and Africa Interactive Whiteboards Market Share Analysis (2020 – 2030) by Solution Figure 166: Middle East and Africa Interactive Whiteboards Market Attractiveness by Solution Figure 167: Middle East and Africa Interactive Whiteboards Market Y-o-Y Growth Trend Analysis (2018 – 2030) by Solution Figure 168: Middle East and Africa Interactive Whiteboards Market Share Analysis (2020 – 2030) by Type Figure 169: Middle East and Africa Interactive Whiteboards Market Attractiveness by Type Figure 170: Middle East and Africa Interactive Whiteboards Market Y-o-Y Growth Trend Analysis (2018 – 2030) by Type Figure 171: Middle East and Africa Interactive Whiteboards Market Share Analysis (2020 – 2030) by Size Figure 172: Middle East and Africa Interactive Whiteboards Market Attractiveness by Size Figure 173: Middle East and Africa Interactive Whiteboards Market Y-o-Y Growth Trend Analysis (2018 – 2030) by Size Figure 174: Middle East and Africa Interactive Whiteboards Market Share Analysis (2020 – 2030) by Application Figure 175: Middle East and Africa Interactive Whiteboards Market Attractiveness by Application Figure 176: Middle East and Africa Interactive Whiteboards Market Y-o-Y Growth Trend Analysis (2018 – 2030) by Application Figure 177: Middle East and Africa Interactive Whiteboards Market Share Analysis (2020 – 2030) by Operating System Figure 178: Middle East and Africa Interactive Whiteboards Market Attractiveness by Operating System Figure 179: Middle East and Africa Interactive Whiteboards Market Y-o-Y Growth Trend Analysis (2018 – 2030) by Operating System Figure 180: Middle East and Africa Interactive Whiteboards Market Share Analysis (2020 – 2030) by Country Figure 181: Middle East and Africa Interactive Whiteboards Market Attractiveness by Country Figure 182: Middle East and Africa Interactive Whiteboards Market Y-o-Y Growth Trend Analysis (2018 – 2030) by Country
Recommendations
Explore Technology Insights
View Reports