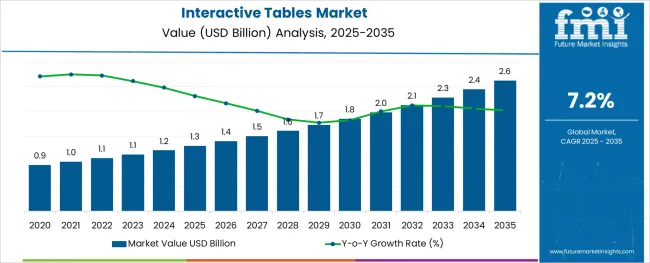
The global demand for Interactive Tables is anticipated to increase at a healthy CAGR of around 7.2% to 7.7% between 2022 and 2032, totaling a valuation of over USD 1.5 Billion by 2027. Growth in the market is driven by rising adoption of interactive tables across various end use verticals such as educational sector and business enterprises.
Report Attribute | Details |
---|---|
Interactive Tables Market Projected Growth Rate (2022 to 2032) | 7.2% - 7.7% CAGR |
Interactive tables, also known as display tables, are innovative solutions which are able to display some content and allow for user input by means of some interaction paradigm. These display tables are similar to that of tablet or iPad but with the visual impact and working area of a larger touch screen.
Initially, integrative tables were developed for educational purposes as they were able to create an interest in students for better studying. However, with the passage of time, scope on interactive tables widened with applications in business enterprises, restaurants, museums, malls, airports, galleries, exhibitions etc.
Growing adoption of interactive tables across various sectors is providing a major thrust to market growth and the trend is likely to continue during the forecast period.
Interactive tables offer various benefits including portability, durability, user friendly nature, versatility etc. which makes them ideal for adoption across various end use verticals. They are able to bring to life ideas and concepts on account of their ability to provide information directly to the viewers.
Leading manufacturers are offering interactive tables with starter kits for beginners to make them more user friendly. Moreover, they are developing advanced products that can function well with touch, joysticks, and stylus.
Rising applications of interactive tables across diverse-end use verticals such as educational institutes, businesses, hotels, restaurants etc., advancements in touch board technology, rapid digitalization, and growing consumer awareness about the various benefits of interactive tables are some of the major factors expected to boost the growth of interactive tables market during the forecast period.
Interactive tables have become ideal solutions for adoption across diverse industries due to their superior viewing angles, portability, and user-friendly nature. They come with a wide screen that is embedded in touch and are being increasingly used to view any necessary details.
Rapid expansion of educational industry supported by increasing investments by government in modernizing educational sector is emerging as a crucial factor spurring the growth of interactive tables market. These tables are being increasingly adopted by educational institutions as they make learning easy and more interesting.
They help students to explore subjects and provide solutions to problems as they are preloaded with software and learning materials. Similarly, gamification of these tables along with rising need for making learning more interactive for students is expected to boost the adoption of interactive tables during the forecast period.
Over the last few years, interactive tables have emerged as one of the most cutting-edge innovations used in hospital sector. They are being increasingly adopted by restaurants and hotels as they reduce the clutter and mess of menus as well helps in improving customer experience. Rapid expansion of this sector will therefore continue to assist market growth during the forecast period.
Moreover, rising trend of using interactive tables in events and tradeshows coupled with advancements in interactive table design and technology will augment market growth in the future. Interactive tables are employed in museums, exhibitions, showrooms etc. for collecting and displaying essential information.
In addition to this, growing popularity of interactive tables across business organizations is expected to generate lucrative growth opportunities for the manufacturers of interactive tables in the future. These display tables are in organizations to effectively interact with clients and customers with the help of digital content.
Despite positive growth projections, the global interactive tables market is facing certain obstacles which are likely to restrain its growth during the forecast period. Some of these obstacles are the high cost of interactive tables, their delicate nature, and high maintenance expenditure.
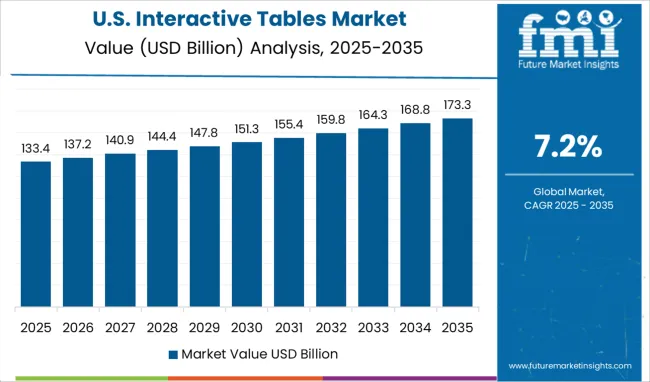
North America was the most dominant market for interactive tables in 2022 and the trend is likely to follow during the forecast period between 2022 and 2032. Growth in the market is driven by heavy presence of interactive touch board solution providers, innovations in interactive tables and rising adoption of interactive tables in business enterprises Interactive Tables Market Snapshot
The global demand for interactive tables is anticipated to increase at a healthy CAGR of around 7.2% to 7.7% between 2022 and 2032, totaling a valuation of over USD 1.5 Billion by 2027. Growth in the market is driven by rising adoption of interactive tables across various end use verticals such as educational sector and business enterprises.
Report Attribute | Details |
---|---|
Interactive Tables Market Projected Growth Rate (2022 to 2032) | 7.2% - 7.7% CAGR |
Interactive tables, also known as display tables, are innovative solutions which are able to display some content and allow for user input by means of some interaction paradigm. These display tables are similar to that of tablet or iPad but with the visual impact and working area of a larger touch screen.
Initially, integrative tables were developed for educational purposes as they were able to create an interest in students for better studying. However, with the passage of time, scope on interactive tables widened with applications in business enterprises, restaurants, museums, malls, airports, galleries, exhibitions etc. Growing adoption of interactive tables across various sectors is providing a major thrust to market growth and the trend is likely to continue during the forecast period.
Interactive tables offer various benefits including portability, durability, user friendly nature, versatility etc. which makes them ideal for adoption across various end use verticals. They are able to bring to life ideas and concepts on account of their ability to provide information directly to the viewers.
Leading manufacturers are offering interactive tables with starter kits for beginners to make them more user friendly. Moreover, they are developing advanced products that can function well with touch, joysticks, and stylus.
Rising applications of interactive tables across diverse-end use verticals such as educational institutes, businesses, hotels, restaurants etc., advancements in touch board technology, rapid digitalization, and growing consumer awareness about the various benefits of interactive tables are some of the major factors expected to boost the growth of interactive tables market during the forecast period.
Interactive tables have become ideal solutions for adoption across diverse industries due to their superior viewing angles, portability, and user-friendly nature. They come with a wide screen that is embedded in touch and are being increasingly used to view any necessary details.
Rapid expansion of educational industry supported by increasing investments by government in modernizing educational sector is emerging as a crucial factor spurring the growth of interactive tables market. These tables are being increasingly adopted by educational institutions as they make learning easy and more interesting.
They help students to explore subjects and provide solutions to problems as they are preloaded with software and learning materials. Similarly, gamification of these tables along with rising need for making learning more interactive for students is expected to boost the adoption of interactive tables during the forecast period.
Over the last few years, interactive tables have emerged as one of the most cutting-edge innovations used in hospital sector. They are being increasingly adopted by restaurants and hotels as they reduce the clutter and mess of menus as well helps in improving customer experience. Rapid expansion of this sector will therefore continue to assist market growth during the forecast period.
Moreover, rising trend of using interactive tables in events and tradeshows coupled with advancements in interactive table design and technology will augment market growth in the future. Interactive tables are employed in museums, exhibitions, showrooms etc. for collecting and displaying essential information.
In addition to this, growing popularity of interactive tables across business organizations is expected to generate lucrative growth opportunities for the manufacturers of interactive tables in the future. These display tables are in organizations to effectively interact with clients and customers with the help of digital content and educational industry.
Demand for interactive tables is especially high across developed nations like the United States and Canada due to rapid adoption of these display tables across educational and hospital sectors.
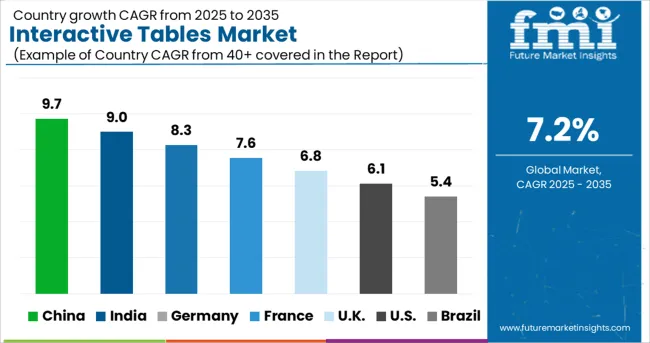
According to Future Market Insights, the Asia Pacific interactive tables market is forecast to grow at the highest CAGR over the forecast period, owing to the growing popularity of interactive tables, increasing investments in modernizing educational sector, and presence of interactive table manufacturers across China.
Similarly, rising penetration of digitalization coupled with growing demand for multi-touch interactive displays will further assist market growth across Asia pacific during the forthcoming years.
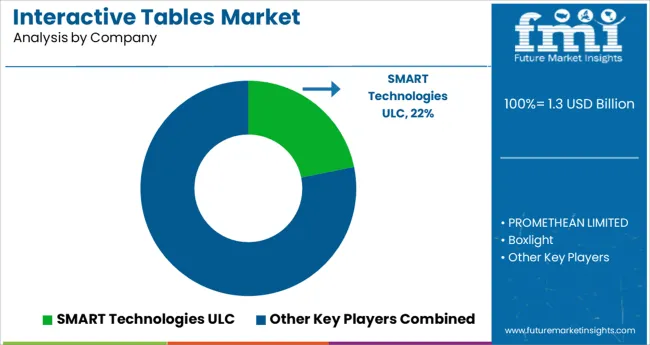
Some of the key participants present in the global interactive tables market include TouchIT Technologies Holdings Inc, SMART Technologies; Boxlight, Microsoft Corporation, Bare Conductive, Promethean Limited, Pathway Innovations & Technologies, Inc., Sharp Electronics Corporation, Samsung Corporation, Google Corporation, Cisco Systems, Inc., Panasonic Corporation, and Dell, Inc., among others.
These market players are constantly introducing advanced products with additional features to woo more and more customers. Besides this, they are adopting strategies such as mergers, acquisitions, partnerships, and collaborations to expand their global presence.
Report Attribute | Details |
---|---|
Growth Rate | CAGR of 7.2% - 7.7% from 2022 to 2032 |
Base Year for Estimation | 2021 |
Historical Data | 2015 to 2020 |
Forecast Period | 2022 to 2032 |
Quantitative Units | Revenue in USD Million and CAGR from 2022 to 2032 |
Report Coverage | Revenue Forecast, Volume Forecast, Company Ranking, Competitive Landscape, Growth Factors, Trends and Pricing Analysis |
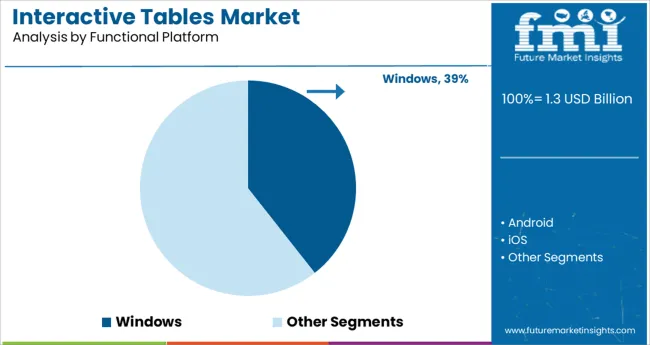
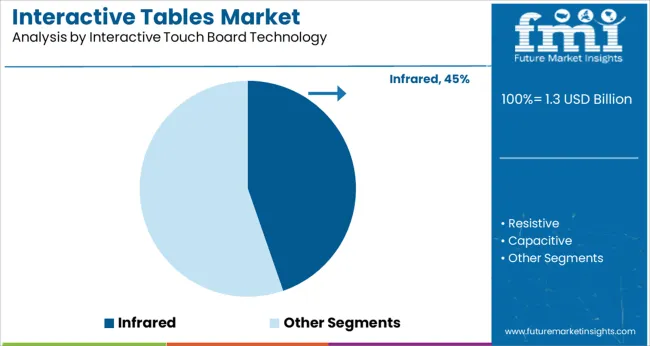
Segments Covered | Functional Platform, Interactive Touch Board Technology, Region |
Regions Covered | North America; Latin America; Western Europe; Eastern Europe; APEJ; Japan; Middle East and Africa |
Key Countries Profiled | USA, Canada, Brazil, Argentina, Germany, UK, France, Spain, Italy, Nordics, BENELUX, Australia & New Zealand, China, India, ASEAN, GCC, South Africa |
Key Companies Profiled | TouchIT Technologies Holdings Inc; SMART Technologies; Boxlight; Microsoft Corporation; Bare Conductive; Promethean Limited; Pathway Innovations & Technologies, Inc.; Sharp Electronics Corporation; Samsung Corporation; Google Corporation; Cisco Systems, Inc.; Panasonic Corporation; Dell, Inc. |
Customization | Available Upon Request |
Table 1: Global Interactive Tables Market Value (US$ Mn) Forecast by Region, 2017-2032
Table 2: Global Interactive Tables Market (Mn Units) Forecast by Region, 2017-2032
Table 3: Global Interactive Tables Market Value (US$ Mn) Forecast by Solution, 2017-2032
Table 4: Global Interactive Tables Market (Mn Units) Forecast by Solution, 2017-2032
Table 5: Global Interactive Tables Market Value (US$ Mn) Forecast by Type, 2017-2032
Table 6: Global Interactive Tables Market (Mn Units) Forecast by Type, 2017-2032
Table 7: Global Interactive Tables Market Value (US$ Mn) Forecast by Application, 2017-2032
Table 8: Global Interactive Tables Market (Mn Units) Forecast by Application, 2017-2032
Table 9: Global Interactive Tables Market Value (US$ Mn) Forecast by Size, 2017-2032
Table 10: Global Interactive Tables Market (Mn Units) Forecast by Size, 2017-2032
Table 11: Global Interactive Tables Market Value (US$ Mn) Forecast by OS, 2017-2032
Table 12: Global Interactive Tables Market (Mn Units) Forecast by OS, 2017-2032
Table 13: North America Interactive Tables Market Value (US$ Mn) Forecast by Country, 2017-2032
Table 14: North America Interactive Tables Market (Mn Units) Forecast by Country, 2017-2032
Table 15: North America Interactive Tables Market Value (US$ Mn) Forecast by Solution, 2017-2032
Table 16: North America Interactive Tables Market (Mn Units) Forecast by Solution, 2017-2032
Table 17: North America Interactive Tables Market Value (US$ Mn) Forecast by Type, 2017-2032
Table 18: North America Interactive Tables Market (Mn Units) Forecast by Type, 2017-2032
Table 19: North America Interactive Tables Market Value (US$ Mn) Forecast by Application, 2017-2032
Table 20: North America Interactive Tables Market (Mn Units) Forecast by Application, 2017-2032
Table 21: North America Interactive Tables Market Value (US$ Mn) Forecast by Size, 2017-2032
Table 22: North America Interactive Tables Market (Mn Units) Forecast by Size, 2017-2032
Table 23: North America Interactive Tables Market Value (US$ Mn) Forecast by OS, 2017-2032
Table 24: North America Interactive Tables Market (Mn Units) Forecast by OS, 2017-2032
Table 25: Latin America Interactive Tables Market Value (US$ Mn) Forecast by Country, 2017-2032
Table 26: Latin America Interactive Tables Market (Mn Units) Forecast by Country, 2017-2032
Table 27: Latin America Interactive Tables Market Value (US$ Mn) Forecast by Solution, 2017-2032
Table 28: Latin America Interactive Tables Market (Mn Units) Forecast by Solution, 2017-2032
Table 29: Latin America Interactive Tables Market Value (US$ Mn) Forecast by Type, 2017-2032
Table 30: Latin America Interactive Tables Market (Mn Units) Forecast by Type, 2017-2032
Table 31: Latin America Interactive Tables Market Value (US$ Mn) Forecast by Application, 2017-2032
Table 32: Latin America Interactive Tables Market (Mn Units) Forecast by Application, 2017-2032
Table 33: Latin America Interactive Tables Market Value (US$ Mn) Forecast by Size, 2017-2032
Table 34: Latin America Interactive Tables Market (Mn Units) Forecast by Size, 2017-2032
Table 35: Latin America Interactive Tables Market Value (US$ Mn) Forecast by OS, 2017-2032
Table 36: Latin America Interactive Tables Market (Mn Units) Forecast by OS, 2017-2032
Table 37: Europe Interactive Tables Market Value (US$ Mn) Forecast by Country, 2017-2032
Table 38: Europe Interactive Tables Market (Mn Units) Forecast by Country, 2017-2032
Table 39: Europe Interactive Tables Market Value (US$ Mn) Forecast by Solution, 2017-2032
Table 40: Europe Interactive Tables Market (Mn Units) Forecast by Solution, 2017-2032
Table 41: Europe Interactive Tables Market Value (US$ Mn) Forecast by Type, 2017-2032
Table 42: Europe Interactive Tables Market (Mn Units) Forecast by Type, 2017-2032
Table 43: Europe Interactive Tables Market Value (US$ Mn) Forecast by Application, 2017-2032
Table 44: Europe Interactive Tables Market (Mn Units) Forecast by Application, 2017-2032
Table 45: Europe Interactive Tables Market Value (US$ Mn) Forecast by Size, 2017-2032
Table 46: Europe Interactive Tables Market (Mn Units) Forecast by Size, 2017-2032
Table 47: Europe Interactive Tables Market Value (US$ Mn) Forecast by OS, 2017-2032
Table 48: Europe Interactive Tables Market (Mn Units) Forecast by OS, 2017-2032
Table 49: East Asia Interactive Tables Market Value (US$ Mn) Forecast by Country, 2017-2032
Table 50: East Asia Interactive Tables Market (Mn Units) Forecast by Country, 2017-2032
Table 51: East Asia Interactive Tables Market Value (US$ Mn) Forecast by Solution, 2017-2032
Table 52: East Asia Interactive Tables Market (Mn Units) Forecast by Solution, 2017-2032
Table 53: East Asia Interactive Tables Market Value (US$ Mn) Forecast by Type, 2017-2032
Table 54: East Asia Interactive Tables Market (Mn Units) Forecast by Type, 2017-2032
Table 55: East Asia Interactive Tables Market Value (US$ Mn) Forecast by Application, 2017-2032
Table 56: East Asia Interactive Tables Market (Mn Units) Forecast by Application, 2017-2032
Table 57: East Asia Interactive Tables Market Value (US$ Mn) Forecast by Size, 2017-2032
Table 58: East Asia Interactive Tables Market (Mn Units) Forecast by Size, 2017-2032
Table 59: East Asia Interactive Tables Market Value (US$ Mn) Forecast by OS, 2017-2032
Table 60: East Asia Interactive Tables Market (Mn Units) Forecast by OS, 2017-2032
Table 61: South Asia & Pacific Interactive Tables Market Value (US$ Mn) Forecast by Country, 2017-2032
Table 62: South Asia & Pacific Interactive Tables Market (Mn Units) Forecast by Country, 2017-2032
Table 63: South Asia & Pacific Interactive Tables Market Value (US$ Mn) Forecast by Solution, 2017-2032
Table 64: South Asia & Pacific Interactive Tables Market (Mn Units) Forecast by Solution, 2017-2032
Table 65: South Asia & Pacific Interactive Tables Market Value (US$ Mn) Forecast by Type, 2017-2032
Table 66: South Asia & Pacific Interactive Tables Market (Mn Units) Forecast by Type, 2017-2032
Table 67: South Asia & Pacific Interactive Tables Market Value (US$ Mn) Forecast by Application, 2017-2032
Table 68: South Asia & Pacific Interactive Tables Market (Mn Units) Forecast by Application, 2017-2032
Table 69: South Asia & Pacific Interactive Tables Market Value (US$ Mn) Forecast by Size, 2017-2032
Table 70: South Asia & Pacific Interactive Tables Market (Mn Units) Forecast by Size, 2017-2032
Table 71: South Asia & Pacific Interactive Tables Market Value (US$ Mn) Forecast by OS, 2017-2032
Table 72: South Asia & Pacific Interactive Tables Market (Mn Units) Forecast by OS, 2017-2032
Table 73: MEA Interactive Tables Market Value (US$ Mn) Forecast by Country, 2017-2032
Table 74: MEA Interactive Tables Market (Mn Units) Forecast by Country, 2017-2032
Table 75: MEA Interactive Tables Market Value (US$ Mn) Forecast by Solution, 2017-2032
Table 76: MEA Interactive Tables Market (Mn Units) Forecast by Solution, 2017-2032
Table 77: MEA Interactive Tables Market Value (US$ Mn) Forecast by Type, 2017-2032
Table 78: MEA Interactive Tables Market (Mn Units) Forecast by Type, 2017-2032
Table 79: MEA Interactive Tables Market Value (US$ Mn) Forecast by Application, 2017-2032
Table 80: MEA Interactive Tables Market (Mn Units) Forecast by Application, 2017-2032
Table 81: MEA Interactive Tables Market Value (US$ Mn) Forecast by Size, 2017-2032
Table 82: MEA Interactive Tables Market (Mn Units) Forecast by Size, 2017-2032
Table 83: MEA Interactive Tables Market Value (US$ Mn) Forecast by OS, 2017-2032
Table 84: MEA Interactive Tables Market (Mn Units) Forecast by OS, 2017-2032
Figure 1: Global Interactive Tables Market Value (US$ Mn) by Solution, 2022-2032
Figure 2: Global Interactive Tables Market Value (US$ Mn) by Type, 2022-2032
Figure 3: Global Interactive Tables Market Value (US$ Mn) by Application, 2022-2032
Figure 4: Global Interactive Tables Market Value (US$ Mn) by Size, 2022-2032
Figure 5: Global Interactive Tables Market Value (US$ Mn) by OS, 2022-2032
Figure 6: Global Interactive Tables Market Value (US$ Mn) by Region, 2022-2032
Figure 7: Global Interactive Tables Market Value (US$ Mn) Analysis by Region, 2017-2032
Figure 8: Global Interactive Tables Market (Mn Units) Analysis by Region, 2017-2032
Figure 9: Global Interactive Tables Market Value Share (%) and BPS Analysis by Region, 2022-2032
Figure 10: Global Interactive Tables Market Y-o-Y Growth (%) Projections by Region, 2022-2032
Figure 11: Global Interactive Tables Market Value (US$ Mn) Analysis by Solution, 2017-2032
Figure 12: Global Interactive Tables Market (Mn Units) Analysis by Solution, 2017-2032
Figure 13: Global Interactive Tables Market Value Share (%) and BPS Analysis by Solution, 2022-2032
Figure 14: Global Interactive Tables Market Y-o-Y Growth (%) Projections by Solution, 2022-2032
Figure 15: Global Interactive Tables Market Value (US$ Mn) Analysis by Type, 2017-2032
Figure 16: Global Interactive Tables Market (Mn Units) Analysis by Type, 2017-2032
Figure 17: Global Interactive Tables Market Value Share (%) and BPS Analysis by Type, 2022-2032
Figure 18: Global Interactive Tables Market Y-o-Y Growth (%) Projections by Type, 2022-2032
Figure 19: Global Interactive Tables Market Value (US$ Mn) Analysis by Application, 2017-2032
Figure 20: Global Interactive Tables Market (Mn Units) Analysis by Application, 2017-2032
Figure 21: Global Interactive Tables Market Value Share (%) and BPS Analysis by Application, 2022-2032
Figure 22: Global Interactive Tables Market Y-o-Y Growth (%) Projections by Application, 2022-2032
Figure 23: Global Interactive Tables Market Value (US$ Mn) Analysis by Size, 2017-2032
Figure 24: Global Interactive Tables Market (Mn Units) Analysis by Size, 2017-2032
Figure 25: Global Interactive Tables Market Value Share (%) and BPS Analysis by Size, 2022-2032
Figure 26: Global Interactive Tables Market Y-o-Y Growth (%) Projections by Size, 2022-2032
Figure 27: Global Interactive Tables Market Value (US$ Mn) Analysis by OS, 2017-2032
Figure 28: Global Interactive Tables Market (Mn Units) Analysis by OS, 2017-2032
Figure 29: Global Interactive Tables Market Value Share (%) and BPS Analysis by OS, 2022-2032
Figure 30: Global Interactive Tables Market Y-o-Y Growth (%) Projections by OS, 2022-2032
Figure 31: Global Interactive Tables Market Attractiveness by Solution, 2022-2032
Figure 32: Global Interactive Tables Market Attractiveness by Type, 2022-2032
Figure 33: Global Interactive Tables Market Attractiveness by Application, 2022-2032
Figure 34: Global Interactive Tables Market Attractiveness by Size, 2022-2032
Figure 35: Global Interactive Tables Market Attractiveness by OS, 2022-2032
Figure 36: Global Interactive Tables Market Attractiveness by Region, 2022-2032
Figure 37: North America Interactive Tables Market Value (US$ Mn) by Solution, 2022-2032
Figure 38: North America Interactive Tables Market Value (US$ Mn) by Type, 2022-2032
Figure 39: North America Interactive Tables Market Value (US$ Mn) by Application, 2022-2032
Figure 40: North America Interactive Tables Market Value (US$ Mn) by Size, 2022-2032
Figure 41: North America Interactive Tables Market Value (US$ Mn) by OS, 2022-2032
Figure 42: North America Interactive Tables Market Value (US$ Mn) by Country, 2022-2032
Figure 43: North America Interactive Tables Market Value (US$ Mn) Analysis by Country, 2017-2032
Figure 44: North America Interactive Tables Market (Mn Units) Analysis by Country, 2017-2032
Figure 45: North America Interactive Tables Market Value Share (%) and BPS Analysis by Country, 2022-2032
Figure 46: North America Interactive Tables Market Y-o-Y Growth (%) Projections by Country, 2022-2032
Figure 47: North America Interactive Tables Market Value (US$ Mn) Analysis by Solution, 2017-2032
Figure 48: North America Interactive Tables Market (Mn Units) Analysis by Solution, 2017-2032
Figure 49: North America Interactive Tables Market Value Share (%) and BPS Analysis by Solution, 2022-2032
Figure 50: North America Interactive Tables Market Y-o-Y Growth (%) Projections by Solution, 2022-2032
Figure 51: North America Interactive Tables Market Value (US$ Mn) Analysis by Type, 2017-2032
Figure 52: North America Interactive Tables Market (Mn Units) Analysis by Type, 2017-2032
Figure 53: North America Interactive Tables Market Value Share (%) and BPS Analysis by Type, 2022-2032
Figure 54: North America Interactive Tables Market Y-o-Y Growth (%) Projections by Type, 2022-2032
Figure 55: North America Interactive Tables Market Value (US$ Mn) Analysis by Application, 2017-2032
Figure 56: North America Interactive Tables Market (Mn Units) Analysis by Application, 2017-2032
Figure 57: North America Interactive Tables Market Value Share (%) and BPS Analysis by Application, 2022-2032
Figure 58: North America Interactive Tables Market Y-o-Y Growth (%) Projections by Application, 2022-2032
Figure 59: North America Interactive Tables Market Value (US$ Mn) Analysis by Size, 2017-2032
Figure 60: North America Interactive Tables Market (Mn Units) Analysis by Size, 2017-2032
Figure 61: North America Interactive Tables Market Value Share (%) and BPS Analysis by Size, 2022-2032
Figure 62: North America Interactive Tables Market Y-o-Y Growth (%) Projections by Size, 2022-2032
Figure 63: North America Interactive Tables Market Value (US$ Mn) Analysis by OS, 2017-2032
Figure 64: North America Interactive Tables Market (Mn Units) Analysis by OS, 2017-2032
Figure 65: North America Interactive Tables Market Value Share (%) and BPS Analysis by OS, 2022-2032
Figure 66: North America Interactive Tables Market Y-o-Y Growth (%) Projections by OS, 2022-2032
Figure 67: North America Interactive Tables Market Attractiveness by Solution, 2022-2032
Figure 68: North America Interactive Tables Market Attractiveness by Type, 2022-2032
Figure 69: North America Interactive Tables Market Attractiveness by Application, 2022-2032
Figure 70: North America Interactive Tables Market Attractiveness by Size, 2022-2032
Figure 71: North America Interactive Tables Market Attractiveness by OS, 2022-2032
Figure 72: North America Interactive Tables Market Attractiveness by Country, 2022-2032
Figure 73: Latin America Interactive Tables Market Value (US$ Mn) by Solution, 2022-2032
Figure 74: Latin America Interactive Tables Market Value (US$ Mn) by Type, 2022-2032
Figure 75: Latin America Interactive Tables Market Value (US$ Mn) by Application, 2022-2032
Figure 76: Latin America Interactive Tables Market Value (US$ Mn) by Size, 2022-2032
Figure 77: Latin America Interactive Tables Market Value (US$ Mn) by OS, 2022-2032
Figure 78: Latin America Interactive Tables Market Value (US$ Mn) by Country, 2022-2032
Figure 79: Latin America Interactive Tables Market Value (US$ Mn) Analysis by Country, 2017-2032
Figure 80: Latin America Interactive Tables Market (Mn Units) Analysis by Country, 2017-2032
Figure 81: Latin America Interactive Tables Market Value Share (%) and BPS Analysis by Country, 2022-2032
Figure 82: Latin America Interactive Tables Market Y-o-Y Growth (%) Projections by Country, 2022-2032
Figure 83: Latin America Interactive Tables Market Value (US$ Mn) Analysis by Solution, 2017-2032
Figure 84: Latin America Interactive Tables Market (Mn Units) Analysis by Solution, 2017-2032
Figure 85: Latin America Interactive Tables Market Value Share (%) and BPS Analysis by Solution, 2022-2032
Figure 86: Latin America Interactive Tables Market Y-o-Y Growth (%) Projections by Solution, 2022-2032
Figure 87: Latin America Interactive Tables Market Value (US$ Mn) Analysis by Type, 2017-2032
Figure 88: Latin America Interactive Tables Market (Mn Units) Analysis by Type, 2017-2032
Figure 89: Latin America Interactive Tables Market Value Share (%) and BPS Analysis by Type, 2022-2032
Figure 90: Latin America Interactive Tables Market Y-o-Y Growth (%) Projections by Type, 2022-2032
Figure 91: Latin America Interactive Tables Market Value (US$ Mn) Analysis by Application, 2017-2032
Figure 92: Latin America Interactive Tables Market (Mn Units) Analysis by Application, 2017-2032
Figure 93: Latin America Interactive Tables Market Value Share (%) and BPS Analysis by Application, 2022-2032
Figure 94: Latin America Interactive Tables Market Y-o-Y Growth (%) Projections by Application, 2022-2032
Figure 95: Latin America Interactive Tables Market Value (US$ Mn) Analysis by Size, 2017-2032
Figure 96: Latin America Interactive Tables Market (Mn Units) Analysis by Size, 2017-2032
Figure 97: Latin America Interactive Tables Market Value Share (%) and BPS Analysis by Size, 2022-2032
Figure 98: Latin America Interactive Tables Market Y-o-Y Growth (%) Projections by Size, 2022-2032
Figure 99: Latin America Interactive Tables Market Value (US$ Mn) Analysis by OS, 2017-2032
Figure 100: Latin America Interactive Tables Market (Mn Units) Analysis by OS, 2017-2032
Figure 101: Latin America Interactive Tables Market Value Share (%) and BPS Analysis by OS, 2022-2032
Figure 102: Latin America Interactive Tables Market Y-o-Y Growth (%) Projections by OS, 2022-2032
Figure 103: Latin America Interactive Tables Market Attractiveness by Solution, 2022-2032
Figure 104: Latin America Interactive Tables Market Attractiveness by Type, 2022-2032
Figure 105: Latin America Interactive Tables Market Attractiveness by Application, 2022-2032
Figure 106: Latin America Interactive Tables Market Attractiveness by Size, 2022-2032
Figure 107: Latin America Interactive Tables Market Attractiveness by OS, 2022-2032
Figure 108: Latin America Interactive Tables Market Attractiveness by Country, 2022-2032
Figure 109: Europe Interactive Tables Market Value (US$ Mn) by Solution, 2022-2032
Figure 110: Europe Interactive Tables Market Value (US$ Mn) by Type, 2022-2032
Figure 111: Europe Interactive Tables Market Value (US$ Mn) by Application, 2022-2032
Figure 112: Europe Interactive Tables Market Value (US$ Mn) by Size, 2022-2032
Figure 113: Europe Interactive Tables Market Value (US$ Mn) by OS, 2022-2032
Figure 114: Europe Interactive Tables Market Value (US$ Mn) by Country, 2022-2032
Figure 115: Europe Interactive Tables Market Value (US$ Mn) Analysis by Country, 2017-2032
Figure 116: Europe Interactive Tables Market (Mn Units) Analysis by Country, 2017-2032
Figure 117: Europe Interactive Tables Market Value Share (%) and BPS Analysis by Country, 2022-2032
Figure 118: Europe Interactive Tables Market Y-o-Y Growth (%) Projections by Country, 2022-2032
Figure 119: Europe Interactive Tables Market Value (US$ Mn) Analysis by Solution, 2017-2032
Figure 120: Europe Interactive Tables Market (Mn Units) Analysis by Solution, 2017-2032
Figure 121: Europe Interactive Tables Market Value Share (%) and BPS Analysis by Solution, 2022-2032
Figure 122: Europe Interactive Tables Market Y-o-Y Growth (%) Projections by Solution, 2022-2032
Figure 123: Europe Interactive Tables Market Value (US$ Mn) Analysis by Type, 2017-2032
Figure 124: Europe Interactive Tables Market (Mn Units) Analysis by Type, 2017-2032
Figure 125: Europe Interactive Tables Market Value Share (%) and BPS Analysis by Type, 2022-2032
Figure 126: Europe Interactive Tables Market Y-o-Y Growth (%) Projections by Type, 2022-2032
Figure 127: Europe Interactive Tables Market Value (US$ Mn) Analysis by Application, 2017-2032
Figure 128: Europe Interactive Tables Market (Mn Units) Analysis by Application, 2017-2032
Figure 129: Europe Interactive Tables Market Value Share (%) and BPS Analysis by Application, 2022-2032
Figure 130: Europe Interactive Tables Market Y-o-Y Growth (%) Projections by Application, 2022-2032
Figure 131: Europe Interactive Tables Market Value (US$ Mn) Analysis by Size, 2017-2032
Figure 132: Europe Interactive Tables Market (Mn Units) Analysis by Size, 2017-2032
Figure 133: Europe Interactive Tables Market Value Share (%) and BPS Analysis by Size, 2022-2032
Figure 134: Europe Interactive Tables Market Y-o-Y Growth (%) Projections by Size, 2022-2032
Figure 135: Europe Interactive Tables Market Value (US$ Mn) Analysis by OS, 2017-2032
Figure 136: Europe Interactive Tables Market (Mn Units) Analysis by OS, 2017-2032
Figure 137: Europe Interactive Tables Market Value Share (%) and BPS Analysis by OS, 2022-2032
Figure 138: Europe Interactive Tables Market Y-o-Y Growth (%) Projections by OS, 2022-2032
Figure 139: Europe Interactive Tables Market Attractiveness by Solution, 2022-2032
Figure 140: Europe Interactive Tables Market Attractiveness by Type, 2022-2032
Figure 141: Europe Interactive Tables Market Attractiveness by Application, 2022-2032
Figure 142: Europe Interactive Tables Market Attractiveness by Size, 2022-2032
Figure 143: Europe Interactive Tables Market Attractiveness by OS, 2022-2032
Figure 144: Europe Interactive Tables Market Attractiveness by Country, 2022-2032
Figure 145: East Asia Interactive Tables Market Value (US$ Mn) by Solution, 2022-2032
Figure 146: East Asia Interactive Tables Market Value (US$ Mn) by Type, 2022-2032
Figure 147: East Asia Interactive Tables Market Value (US$ Mn) by Application, 2022-2032
Figure 148: East Asia Interactive Tables Market Value (US$ Mn) by Size, 2022-2032
Figure 149: East Asia Interactive Tables Market Value (US$ Mn) by OS, 2022-2032
Figure 150: East Asia Interactive Tables Market Value (US$ Mn) by Country, 2022-2032
Figure 151: East Asia Interactive Tables Market Value (US$ Mn) Analysis by Country, 2017-2032
Figure 152: East Asia Interactive Tables Market (Mn Units) Analysis by Country, 2017-2032
Figure 153: East Asia Interactive Tables Market Value Share (%) and BPS Analysis by Country, 2022-2032
Figure 154: East Asia Interactive Tables Market Y-o-Y Growth (%) Projections by Country, 2022-2032
Figure 155: East Asia Interactive Tables Market Value (US$ Mn) Analysis by Solution, 2017-2032
Figure 156: East Asia Interactive Tables Market (Mn Units) Analysis by Solution, 2017-2032
Figure 157: East Asia Interactive Tables Market Value Share (%) and BPS Analysis by Solution, 2022-2032
Figure 158: East Asia Interactive Tables Market Y-o-Y Growth (%) Projections by Solution, 2022-2032
Figure 159: East Asia Interactive Tables Market Value (US$ Mn) Analysis by Type, 2017-2032
Figure 160: East Asia Interactive Tables Market (Mn Units) Analysis by Type, 2017-2032
Figure 161: East Asia Interactive Tables Market Value Share (%) and BPS Analysis by Type, 2022-2032
Figure 162: East Asia Interactive Tables Market Y-o-Y Growth (%) Projections by Type, 2022-2032
Figure 163: East Asia Interactive Tables Market Value (US$ Mn) Analysis by Application, 2017-2032
Figure 164: East Asia Interactive Tables Market (Mn Units) Analysis by Application, 2017-2032
Figure 165: East Asia Interactive Tables Market Value Share (%) and BPS Analysis by Application, 2022-2032
Figure 166: East Asia Interactive Tables Market Y-o-Y Growth (%) Projections by Application, 2022-2032
Figure 167: East Asia Interactive Tables Market Value (US$ Mn) Analysis by Size, 2017-2032
Figure 168: East Asia Interactive Tables Market (Mn Units) Analysis by Size, 2017-2032
Figure 169: East Asia Interactive Tables Market Value Share (%) and BPS Analysis by Size, 2022-2032
Figure 170: East Asia Interactive Tables Market Y-o-Y Growth (%) Projections by Size, 2022-2032
Figure 171: East Asia Interactive Tables Market Value (US$ Mn) Analysis by OS, 2017-2032
Figure 172: East Asia Interactive Tables Market (Mn Units) Analysis by OS, 2017-2032
Figure 173: East Asia Interactive Tables Market Value Share (%) and BPS Analysis by OS, 2022-2032
Figure 174: East Asia Interactive Tables Market Y-o-Y Growth (%) Projections by OS, 2022-2032
Figure 175: East Asia Interactive Tables Market Attractiveness by Solution, 2022-2032
Figure 176: East Asia Interactive Tables Market Attractiveness by Type, 2022-2032
Figure 177: East Asia Interactive Tables Market Attractiveness by Application, 2022-2032
Figure 178: East Asia Interactive Tables Market Attractiveness by Size, 2022-2032
Figure 179: East Asia Interactive Tables Market Attractiveness by OS, 2022-2032
Figure 180: East Asia Interactive Tables Market Attractiveness by Country, 2022-2032
Figure 181: South Asia & Pacific Interactive Tables Market Value (US$ Mn) by Solution, 2022-2032
Figure 182: South Asia & Pacific Interactive Tables Market Value (US$ Mn) by Type, 2022-2032
Figure 183: South Asia & Pacific Interactive Tables Market Value (US$ Mn) by Application, 2022-2032
Figure 184: South Asia & Pacific Interactive Tables Market Value (US$ Mn) by Size, 2022-2032
Figure 185: South Asia & Pacific Interactive Tables Market Value (US$ Mn) by OS, 2022-2032
Figure 186: South Asia & Pacific Interactive Tables Market Value (US$ Mn) by Country, 2022-2032
Figure 187: South Asia & Pacific Interactive Tables Market Value (US$ Mn) Analysis by Country, 2017-2032
Figure 188: South Asia & Pacific Interactive Tables Market (Mn Units) Analysis by Country, 2017-2032
Figure 189: South Asia & Pacific Interactive Tables Market Value Share (%) and BPS Analysis by Country, 2022-2032
Figure 190: South Asia & Pacific Interactive Tables Market Y-o-Y Growth (%) Projections by Country, 2022-2032
Figure 191: South Asia & Pacific Interactive Tables Market Value (US$ Mn) Analysis by Solution, 2017-2032
Figure 192: South Asia & Pacific Interactive Tables Market (Mn Units) Analysis by Solution, 2017-2032
Figure 193: South Asia & Pacific Interactive Tables Market Value Share (%) and BPS Analysis by Solution, 2022-2032
Figure 194: South Asia & Pacific Interactive Tables Market Y-o-Y Growth (%) Projections by Solution, 2022-2032
Figure 195: South Asia & Pacific Interactive Tables Market Value (US$ Mn) Analysis by Type, 2017-2032
Figure 196: South Asia & Pacific Interactive Tables Market (Mn Units) Analysis by Type, 2017-2032
Figure 197: South Asia & Pacific Interactive Tables Market Value Share (%) and BPS Analysis by Type, 2022-2032
Figure 198: South Asia & Pacific Interactive Tables Market Y-o-Y Growth (%) Projections by Type, 2022-2032
Figure 199: South Asia & Pacific Interactive Tables Market Value (US$ Mn) Analysis by Application, 2017-2032
Figure 200: South Asia & Pacific Interactive Tables Market (Mn Units) Analysis by Application, 2017-2032
Figure 201: South Asia & Pacific Interactive Tables Market Value Share (%) and BPS Analysis by Application, 2022-2032
Figure 202: South Asia & Pacific Interactive Tables Market Y-o-Y Growth (%) Projections by Application, 2022-2032
Figure 203: South Asia & Pacific Interactive Tables Market Value (US$ Mn) Analysis by Size, 2017-2032
Figure 204: South Asia & Pacific Interactive Tables Market (Mn Units) Analysis by Size, 2017-2032
Figure 205: South Asia & Pacific Interactive Tables Market Value Share (%) and BPS Analysis by Size, 2022-2032
Figure 206: South Asia & Pacific Interactive Tables Market Y-o-Y Growth (%) Projections by Size, 2022-2032
Figure 207: South Asia & Pacific Interactive Tables Market Value (US$ Mn) Analysis by OS, 2017-2032
Figure 208: South Asia & Pacific Interactive Tables Market (Mn Units) Analysis by OS, 2017-2032
Figure 209: South Asia & Pacific Interactive Tables Market Value Share (%) and BPS Analysis by OS, 2022-2032
Figure 210: South Asia & Pacific Interactive Tables Market Y-o-Y Growth (%) Projections by OS, 2022-2032
Figure 211: South Asia & Pacific Interactive Tables Market Attractiveness by Solution, 2022-2032
Figure 212: South Asia & Pacific Interactive Tables Market Attractiveness by Type, 2022-2032
Figure 213: South Asia & Pacific Interactive Tables Market Attractiveness by Application, 2022-2032
Figure 214: South Asia & Pacific Interactive Tables Market Attractiveness by Size, 2022-2032
Figure 215: South Asia & Pacific Interactive Tables Market Attractiveness by OS, 2022-2032
Figure 216: South Asia & Pacific Interactive Tables Market Attractiveness by Country, 2022-2032
Figure 217: MEA Interactive Tables Market Value (US$ Mn) by Solution, 2022-2032
Figure 218: MEA Interactive Tables Market Value (US$ Mn) by Type, 2022-2032
Figure 219: MEA Interactive Tables Market Value (US$ Mn) by Application, 2022-2032
Figure 220: MEA Interactive Tables Market Value (US$ Mn) by Size, 2022-2032
Figure 221: MEA Interactive Tables Market Value (US$ Mn) by OS, 2022-2032
Figure 222: MEA Interactive Tables Market Value (US$ Mn) by Country, 2022-2032
Figure 223: MEA Interactive Tables Market Value (US$ Mn) Analysis by Country, 2017-2032
Figure 224: MEA Interactive Tables Market (Mn Units) Analysis by Country, 2017-2032
Figure 225: MEA Interactive Tables Market Value Share (%) and BPS Analysis by Country, 2022-2032
Figure 226: MEA Interactive Tables Market Y-o-Y Growth (%) Projections by Country, 2022-2032
Figure 227: MEA Interactive Tables Market Value (US$ Mn) Analysis by Solution, 2017-2032
Figure 228: MEA Interactive Tables Market (Mn Units) Analysis by Solution, 2017-2032
Figure 229: MEA Interactive Tables Market Value Share (%) and BPS Analysis by Solution, 2022-2032
Figure 230: MEA Interactive Tables Market Y-o-Y Growth (%) Projections by Solution, 2022-2032
Figure 231: MEA Interactive Tables Market Value (US$ Mn) Analysis by Type, 2017-2032
Figure 232: MEA Interactive Tables Market (Mn Units) Analysis by Type, 2017-2032
Figure 233: MEA Interactive Tables Market Value Share (%) and BPS Analysis by Type, 2022-2032
Figure 234: MEA Interactive Tables Market Y-o-Y Growth (%) Projections by Type, 2022-2032
Figure 235: MEA Interactive Tables Market Value (US$ Mn) Analysis by Application, 2017-2032
Figure 236: MEA Interactive Tables Market (Mn Units) Analysis by Application, 2017-2032
Figure 237: MEA Interactive Tables Market Value Share (%) and BPS Analysis by Application, 2022-2032
Figure 238: MEA Interactive Tables Market Y-o-Y Growth (%) Projections by Application, 2022-2032
Figure 239: MEA Interactive Tables Market Value (US$ Mn) Analysis by Size, 2017-2032
Figure 240: MEA Interactive Tables Market (Mn Units) Analysis by Size, 2017-2032
Figure 241: MEA Interactive Tables Market Value Share (%) and BPS Analysis by Size, 2022-2032
Figure 242: MEA Interactive Tables Market Y-o-Y Growth (%) Projections by Size, 2022-2032
Figure 243: MEA Interactive Tables Market Value (US$ Mn) Analysis by OS, 2017-2032
Figure 244: MEA Interactive Tables Market (Mn Units) Analysis by OS, 2017-2032
Figure 245: MEA Interactive Tables Market Value Share (%) and BPS Analysis by OS, 2022-2032
Figure 246: MEA Interactive Tables Market Y-o-Y Growth (%) Projections by OS, 2022-2032
Figure 247: MEA Interactive Tables Market Attractiveness by Solution, 2022-2032
Figure 248: MEA Interactive Tables Market Attractiveness by Type, 2022-2032
Figure 249: MEA Interactive Tables Market Attractiveness by Application, 2022-2032
Figure 250: MEA Interactive Tables Market Attractiveness by Size, 2022-2032
Figure 251: MEA Interactive Tables Market Attractiveness by OS, 2022-2032
Figure 252: MEA Interactive Tables Market Attractiveness by Country, 2022-2032
FMI projects the global interactive tables market to expand at around 7.2% to 7.7% CAGR during the forecast period.
As per FMI, Asia Pacific is expected to be the most opportunistic interactive tables market, expanding at a robust CAGR during the forecast period.
TouchIT Technologies Holdings Inc, SMART Technologies; Boxlight, Microsoft Corporation, Bare Conductive, Promethean Limited, Pathway Innovations & Technologies, and Samsung corporation are some prominent interactive tables manufacturers
Explore Electronics & Components Insights
Thank you!
You will receive an email from our Business Development Manager. Please be sure to check your SPAM/JUNK folder too.