IQF Vegetables Market Size and Share Forecast Outlook 2025 to 2035

The global IQF vegetables market is valued at USD 1.8 billion in 2025 and is expected to reach USD 2.9 billion by 2035, reflecting a CAGR of 4.8%. Growth expansion is driven by rising demand for convenience foods, increasing awareness of healthy eating, and advancements in IQF (Individually Quick Frozen) freezing technology that preserves nutritional value and enhances shelf life.
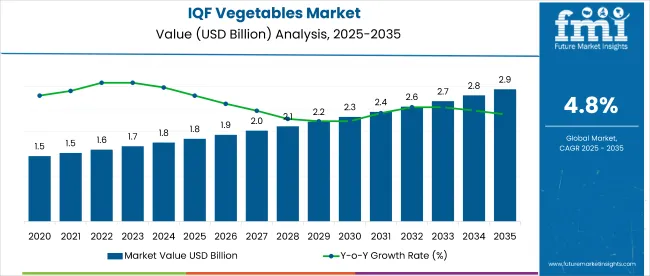
Quick Stats for IQF Vegetables Market

  • Market Value (2025): USD 1.8 billion
  • Forecast Value (2035): USD 2.9 billion
  • Forecast CAGR: 4.8%
  • Type Leader in 2025: Potatoes (26% Market Share)
  • Top Application Segment: Ready-to-eat Food (36% Market Share)
  • Key Growth Region: Asia-Pacific (Japan is the fastest growing market with 3.5% CAGR)

Iqf Vegetables Market

Metric Value
Estimated Size (2025E) USD 1.8 billion
Projected Value (2035F) USD 2.9 billion
CAGR (2025 to 2035) 4.8%

The growing preference for ready-to-eat meals and the expansion of food service chains globally are also likely to stimulate demand across both developed and developing markets.

The market holds an estimated 14-16% share of individually quick-frozen (IQF) produce, driven by rising demand for high-quality frozen ingredients with extended shelf life. Within the processed vegetables segment, IQF vegetables represent approximately 28-30%, supported by technological advantages in preservation, texture retention, and nutritional value.

In the convenience food market, IQF vegetables account for nearly 10%, reflecting their widespread use in ready-to-cook and frozen meal solutions. The cold chain logistics sector sees a smaller but critical share of around 6-8%, emphasizing the need for specialized storage and transportation infrastructure. Additionally, IQF vegetables contribute approximately 12% to advancements in food preservation technologies, highlighting their role in enhancing shelf stability and reducing food waste.

Government regulations imapcting the market focus on innovation in processing technologies, diversified product offerings, and sustainable packaging initiatives. Advancements such as nitrogen-based IQF systems and investments in cold chain logistics are enhancing product shelf life and distribution reach, making frozen vegetables more accessible across regions. Regulatory approvals in multiple countries are further opening new avenues for market expansion, particularly in health-conscious and import-reliant economies.

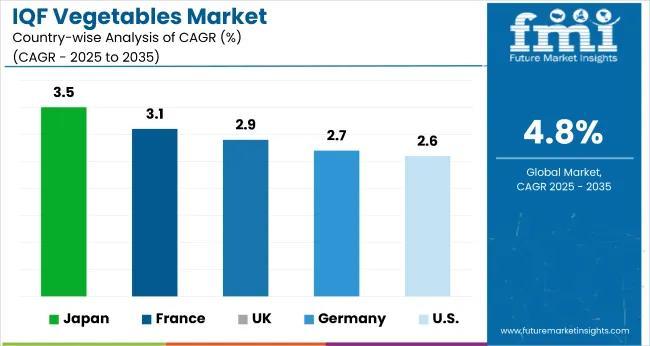
The USA is projected to be a leading market, expanding at a CAGR of 2.6% from 2025 to 2035. Potatoes will lead the type segment with a 26% share, while, ready-to-eat food will dominate the application segment with a 36% market share in 2025.The Germany and Japan markets Other key markets such as Germany and Japan are also expected to grow steadily at CAGRs of 2.7% and 3.5%, respectively.

Analyzing IQF Vegetables Market by Top Investment Segments

The IQF vegetables market is segmented into type, application and region. By type, the market includes beans, peas, corn & baby corn, broccoli & cauliflower, potato, onion, tomato and carrot. By application, the market is segmented into food (Bakery, confectionary & snack food, dairy & dessert, cooking food, ready to eat food), and beverage (Juice and other non-alcoholic beverages), and concentrate.

Regionally, the market is classified into North America, Latin America, Western Europe, Eastern Europe, Balkans & Baltic, Russia & Belarus, Central Asia, East Asia, South Asia & Pacific, and Middle East & Africa.
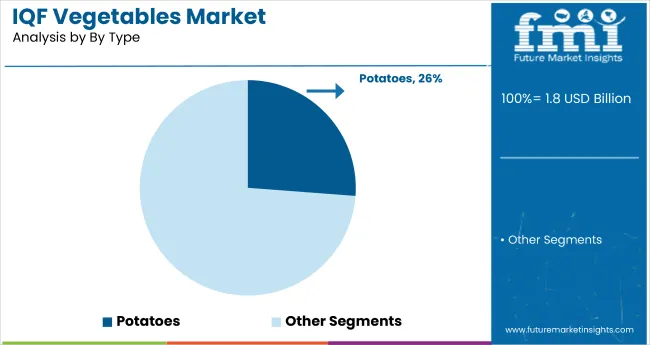
Potatoes to Lead the Type Segment with 26% Market Share

Iqf Vegetables Market Analysis By Type

Potatoes are projected to lead the type segment,accounting for 26% of the global market share in 2025. The increasing use of IQF potatoes in quick meals, fast food chains, and processed food manufacturing has supported its dominance. This segment benefits from its long shelf life, ease of cooking, and high versatility across cuisines. The rising popularity of Western diets in developing regions has further amplified demand for IQF potato-based products.
  • Widely used in applications such as fries, hash browns, and ready-to-eat breakfast meals.
  • Growing demand for foodservice providers and the HoReCa (Hotel, restaurant, and catering) industry.
  • Retains most of its nutritional value due to advanced freezing techniques.

Ready-to-eat Food to Lead the Application Segment with 36% Market Share

Iqf Vegetables Market Analysis By Application

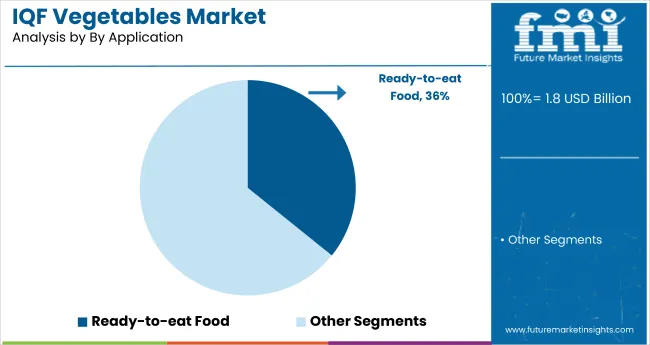
Ready-to-eat food is expected to dominate the application segment,accounting for 36% of the market share in 2025. Growing demand for convenience and time-saving meal options has significantly increased the adoption of IQF vegetables in ready-to-eat products. These meals are favored by working professionals and urban households due to minimal preparation requirements and high nutritional retention.

  • Strong demand for single-portion frozen meal solutions tailored to busy lifestyles.
  • Widely incorporated by leading global ready-to-eat meal brands.
  • Frozen packaging technology supports extended shelf life and quality preservation.

Top IQF Vegetables Market Dynamics

The global IQF fruits and vegetables market has been experiencing steady growth, driven by rising consumer demand for minimally processed, nutrient-rich, and convenient foods. IQF technology preserves taste, texture, and nutritional value without additives, making it popular across sectors like ready-to-eat meals, bakery, and dairy.

Recent Trends in the IQF Vegetables Market

  • Rising demand for single-serve IQF vegetable packs due to growth in solo households.
  • Technological innovations in nitrogen-based IQF freezing systems to enhance shelf life.
  • Increasing retail penetration of private label IQF vegetable brands.
  • Surge in plant-based and clean-label product formulations using IQF vegetables.

Key Challenges in the IQF Vegetables Market
  • Recurring contamination risks such as Listeria monocytogenes in frozen vegetable products.
  • High operational and infrastructure costs for cold chain and IQF equipment.
  • Limited awareness in developing regions about the benefits of IQF technology.
  • Seasonal dependence and pricing volatility in raw vegetable supply chains.

Top Countries Formulating, Distributing and Supplying IQF Vegetables

Country Wise Analysis Of Iqf Vegetables Market

Japan is projected to lead the IQF vegetables market due to strong consumer preference for convenient, health-oriented frozen foods and widespread adoption in retail and foodservice sectors.

The UK is expected to grow at a CAGR of 2.9%, as increased health awareness and expanded supermarket offerings continue to drive interest in IQF products.While, Germany market is expected to grow at 2.7% and the USA, at a CAGR of 2.6%.

The report covers an in-depth analysis of 40+ countries; with the five top-performing OECD nations highlighted below.
In-Depth Analysis of IQF Vegetables Demand in the USA

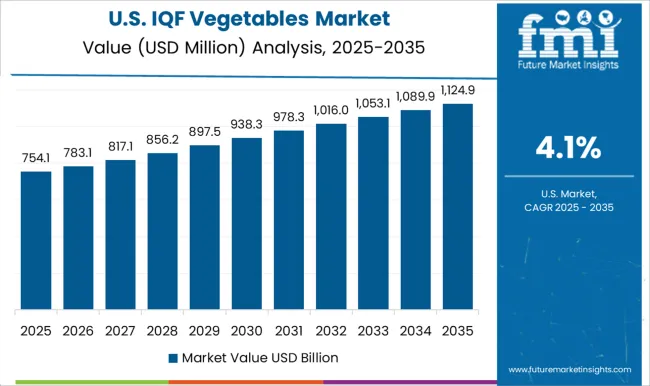
The USA IQF vegetables revenue is growing at a CAGR of 2.6% from 2025 to 2035. Growth is driven by widespread adoption of frozen foods, increased consumer preference for convenience, and robust cold storage infrastructure. Leading brands and private labels are expanding portfolios with healthier, organic, and eco-friendly IQF products to align with consumer trends.

  • Increasing consumer demand for organic, clean-label, and minimally processed frozen vegetables.
  • Strong and efficient nationwide supply chain supports widespread IQF product distribution.
  • Ongoing investments in food safety measures and automation enhance processing efficiency.

Growth Outlook of IQF Vegetables in the UK

The sales of IQF vegetables in the UK are expanding at a CAGR of 2.9% during the forecast period. Growth is driven by rising adoption of health-conscious and plant-based diets, coupled with an increase in one-person households. The expansion of digital grocery platforms and focus on packaging sustainability are reinforcing the segment’s appeal.
  • Rising demand for single-serve and pre-cut IQF vegetables tailored to individual portions and convenience.
  • Shifting consumer preferences toward plant-based and health-conscious meal options.
  • Rapid growth in online and supermarket sales channels for IQF products.

Analysis of IQF Vegetables in Germany

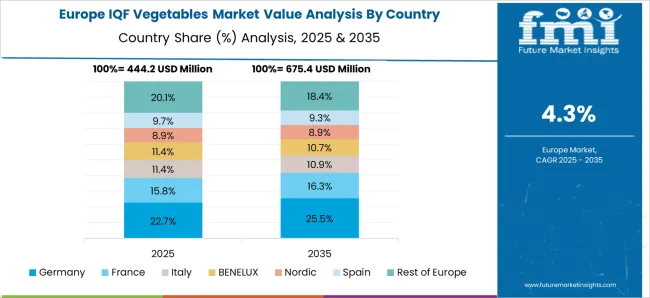
The Germany IQF vegetables market is projected to grow at a CAGR of 2.7% from 2025 to 2035. Growth is driven by increasing number of consumers in Germany drawn to frozen vegetables due to convenience, nutritional preservation, and growing environmental awareness. The rise in smaller households, eco-packaging initiatives, and the rising popularity of frozen organic options further support the demand.

  • German consumers prefer low-waste, easy-to-prepare food options.
  • Strong demand for organic and additive-free IQF vegetables.
  • Increasing interest in frozen food as a sustainable meal solution.

IQF Vegetables Trends in France

The IQF vegetables revenue in France is expected to grow at a CAGR of 3.1% from 2025 to 2035. France remains a key hub in Europe for IQF vegetable distribution due to its developed cold chain and diverse frozen food offerings. French consumers continue to prioritize food quality and health, driving sales of nutrient-rich and minimally processed frozen vegetables.

  • Growing health and wellness trends among urban populations.
  • Strong retail infrastructure and export potential.
  • Supportive regulations promoting frozen and nutrient-rich diets.

Analysis of IQF Vegetables in Japan

The Japan IQF vegetables market is projected to grow at a CAGR of 3.5% from 2025 to 2035. The demand is fueled by aging demographics, busy urban lifestyles, and a preference for hygienically packed, ready-to-use food products. IQF potatoes and corn dominate the Japanese market due to consistent year-round availability and high-quality preservation techniques.
  • Demand driven by convenience and limited time for cooking.
  • Potato and corn varieties remain the top-selling IQF vegetables.
  • Private label brands are expanding rapidly across retail chains.

Leading IQF Vegetables Market Suppliers

Iqf Vegetables Market Analysis By Company

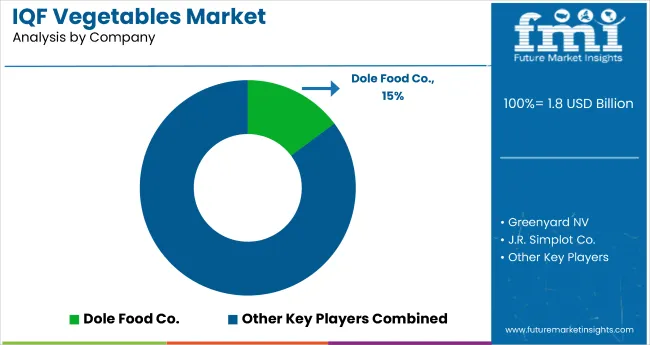
The IQF vegetables market is moderately fragmented, with several regional and global players competing based on product quality, sourcing capabilities, innovation, and retail partnerships. Companies like B&G Foods Holdings Corp., Dole Food Co., ConAgra Foods, and Greenyard NV maintain substantial presence through extensive distribution networks and large-scale production facilities, while newer entrants are gaining traction through niche offerings and sustainable packaging.

Top companies are actively pursuing strategies focused on expanding processing capacity, launching innovative product formats, and establishing regional partnerships to improve supply resilience. Price competitiveness, investment in food safety certifications, and alignment with organic and clean-label trends are central to supplier strategies. In 2025, companies have been observed enhancing automation in IQF lines, strengthening their presence in Asia and North America, and securing long-term contracts with major foodservice providers and supermarkets.

Recent IQF Vegetables Market News

  • In March 2025, J.R. Simplot Company announced a strategic partnership with DKSH to expand Simplot’s food brands in China, aiming to increase its market presence and distribution of IQF vegetables and other products in the region.
  • In 2025, Uren Food Group Limited published an update highlighting its continued leadership in the UK IQF vegetable sector. The company emphasized its fully traceable supply chain, rapid delivery capabilities, and broad range of high-quality IQF vegetables. Uren’s focus on supply chain transparency and service efficiency positions it as a key supplier for both retail and foodservice clients in 2025.

IQF Vegetables Market Report Scope

Report Attributes Details
Current Total Market Size (2025) USD 1.8 billion
Projected Market Size (2035) USD 2.9 billion
CAGR (2025 to 2035) 4.8%
Base Year for Estimation 2024
Historical Period 2020 to 2024
Projections Period 2025 to 2035
Market Analysis Parameters Revenue in USD billion/Volume in Kilotons
By Type Beans, Peas, Corn & Baby Corn, Broccoli & Cauliflower, Potato, Onion, Tomato, and Carrot
By Application Food (Bakery, Confectionery & Snack Food, Dairy & Dessert, Cooking Food, Ready-to-Eat), Beverage (Juice, Other Non-Alcoholic Beverages), and Concentrate
Regions Covered North America, Latin America, Western Europe, Eastern Europe, Balkans & Baltic, Russia & Belarus, Central Asia, East Asia, South Asia & Pacific, Middle East & Africa
Countries Covered United States, Canada, United Kingdom, Germany, France, China, Japan, South Korea, Brazil, Australia and 40+ countries
Key Players B&G Foods Holdings Corp., Capricorn Food Products India Ltd, ConAgra Foods, Inc., Dole Food Co., Greenyard NV, J.R. Simplot Co., Kerry Group Plc., Pinnacle Foods, Inc., SunOpta Inc., Uren Food Group Limited
Additional Attributes Dollar sales by product type, share by functionality, regional demand growth, regulatory influence, clean- label trends, competitive benchmarking

Key Segmentation

By Type:

  • Beans
  • Peas
  • Corn and Baby Corn
  • Broccoli and Cauliflower
  • Potato
  • Onion
  • Tomato
  • Carrot

By Application:

  • Food
    • Bakery, Confectionary & Snack Food
    • Dairy & Dessert
    • Cooking food
    • Ready to Eat Food
  • Beverage
    • Juice
    • Other Non-alcoholic Beverages
    • Concentrate

By Region:

  • North America
  • Latin America
  • Europe
  • Asia Pacific
  • Middle East and Africa

Table of Content

  1. Executive Summary
    • Global Market Outlook
    • Demand-side Trends
    • Supply-side Trends
    • Technology Roadmap Analysis
    • Analysis and Recommendations
  2. Market Overview
    • Market Coverage/Taxonomy
    • Market Definition/Scope/Limitations
  3. Market Background
    • Market Dynamics
      • Drivers
      • Restraints
      • Opportunity
      • Trends
    • Scenario Forecast
      • Demand in Optimistic Scenario
      • Demand in Likely Scenario
      • Demand in Conservative Scenario
    • Opportunity Map Analysis
    • Product Life Cycle Analysis
    • Supply Chain Analysis
      • Supply Side Participants and their Roles
        • Producers
        • Mid-Level Participants (Traders/ Agents/ Brokers)
        • Wholesalers and Distributors
      • Value Added and Value Created at Node in the Supply Chain
      • List of Raw Material Suppliers
      • List of Existing and Potential Buyer’s
    • Investment Feasibility Matrix
    • Value Chain Analysis
      • Profit Margin Analysis
      • Wholesalers and Distributors
      • Retailers
    • PESTLE and Porter’s Analysis
    • Regulatory Landscape
      • By Key Regions
      • By Key Countries
    • Regional Parent Market Outlook
    • Production and Consumption Statistics
    • Import and Export Statistics
  4. Global Market Analysis 2020 to 2024 and Forecast, 2025 to 2035
    • Historical Market Size Value (USD Billion) & Volume (Kilotons) Analysis, 2020 to 2024
    • Current and Future Market Size Value (USD Billion) & Volume (Kilotons) Projections, 2025 to 2035
      • Y-o-Y Growth Trend Analysis
      • Absolute $ Opportunity Analysis
  5. Global Market Pricing Analysis 2020 to 2024 and Forecast 2025 to 2035
  6. Global Market Analysis 2020 to 2024 and Forecast 2025 to 2035, By Type
    • Introduction/Key Findings
    • Historical Market Size Value (USD Billion) & Volume (Kilotons) Analysis By Type, 2020 to 2024
    • Current and Future Market Size Value (USD Billion) & Volume (Kilotons) Analysis and Forecast By Type, 2025 to 2035
      • Beans
      • Peas
      • Corn and Baby Corn
      • Broccoli and Cauliflower
      • Potato
      • Onion
      • Tomato
      • Carrot
    • Y-o-Y Growth Trend Analysis By Type, 2020 to 2024
    • Absolute $ Opportunity Analysis By Type, 2025 to 2035
  7. Global Market Analysis 2020 to 2024 and Forecast 2025 to 2035, By Application
    • Introduction/Key Findings
    • Historical Market Size Value (USD Billion) & Volume (Kilotons) Analysis By Application, 2020 to 2024
    • Current and Future Market Size Value (USD Billion) & Volume (Kilotons) Analysis and Forecast By Application, 2025 to 2035
      • Food
        • Bakery, Confectionary & Snack Food
        • Dairy & Dessert
        • Cooking food
        • Ready to Eat Food
      • Beverage
        • Juice
        • Other Non-alcoholic Beverages
      • Concentrate
    • Y-o-Y Growth Trend Analysis By Application, 2020 to 2024
    • Absolute $ Opportunity Analysis By Application, 2025 to 2035
  8. Global Market Analysis 2020 to 2024 and Forecast 2025 to 2035, By Region
    • Introduction
    • Historical Market Size Value (USD Billion) & Volume (Kilotons) Analysis By Region, 2020 to 2024
    • Current Market Size Value (USD Billion) & Volume (Kilotons) Analysis and Forecast By Region, 2025 to 2035
      • North America
      • Latin America
      • Western Europe
      • Eastern Europe
      • East Asia
      • South Asia & Pacific
      • Middle East and Africa
    • Market Attractiveness Analysis By Region
  9. North America Market Analysis 2020 to 2024 and Forecast 2025 to 2035, By Country
    • Historical Market Size Value (USD Billion) & Volume (Kilotons) Trend Analysis By Market Taxonomy, 2020 to 2024
    • Market Size Value (USD Billion) & Volume (Kilotons) Forecast By Market Taxonomy, 2025 to 2035
      • By Country
        • USA
        • Canada
        • Mexico
      • By Type
      • By Application
    • Market Attractiveness Analysis
      • By Country
      • By Type
      • By Application
    • Key Takeaways
  10. Latin America Market Analysis 2020 to 2024 and Forecast 2025 to 2035, By Country
    • Historical Market Size Value (USD Billion) & Volume (Kilotons) Trend Analysis By Market Taxonomy, 2020 to 2024
    • Market Size Value (USD Billion) & Volume (Kilotons) Forecast By Market Taxonomy, 2025 to 2035
      • By Country
        • Brazil
        • Argentina
        • Rest of LATAM
      • By Type
      • By Application
    • Market Attractiveness Analysis
      • By Country
      • By Type
      • By Application
    • Key Takeaways
  11. Western Europe Market Analysis 2020 to 2024 and Forecast 2025 to 2035, By Country
    • Historical Market Size Value (USD Billion) & Volume (Kilotons) Trend Analysis By Market Taxonomy, 2020 to 2024
    • Market Size Value (USD Billion) & Volume (Kilotons) Forecast By Market Taxonomy, 2025 to 2035
      • By Country
        • Germany
        • Italy
        • France
        • UK
        • Spain
        • BENELUX
        • Nordic
        • Rest of W.Europe
      • By Type
      • By Application
    • Market Attractiveness Analysis
      • By Country
      • By Type
      • By Application
    • Key Takeaways
  12. Eastern Europe Market Analysis 2020 to 2024 and Forecast 2025 to 2035, By Country
    • Historical Market Size Value (USD Billion) & Volume (Kilotons) Trend Analysis By Market Taxonomy, 2020 to 2024
    • Market Size Value (USD Billion) & Volume (Kilotons) Forecast By Market Taxonomy, 2025 to 2035
      • By Country
        • Russia
        • Hungary
        • Poland
        • Balkan & Baltics
        • Rest of E. Europe
      • By Type
      • By Application
    • Market Attractiveness Analysis
      • By Country
      • By Type
      • By Application
    • Key Takeaways
  13. East Asia Market Analysis 2020 to 2024 and Forecast 2025 to 2035, By Country
    • Historical Market Size Value (USD Billion) & Volume (Kilotons) Trend Analysis By Market Taxonomy, 2020 to 2024
    • Market Size Value (USD Billion) & Volume (Kilotons) Forecast By Market Taxonomy, 2025 to 2035
      • By Country
        • China
        • Japan
        • South Korea
      • By Type
      • By Application
    • Market Attractiveness Analysis
      • By Country
      • By Type
      • By Application
    • Key Takeaways
  14. South Asia & Pacific Market Analysis 2020 to 2024 and Forecast 2025 to 2035, By Country
    • Historical Market Size Value (USD Billion) & Volume (Kilotons) Trend Analysis By Market Taxonomy, 2020 to 2024
    • Market Size Value (USD Billion) & Volume (Kilotons) Forecast By Market Taxonomy, 2025 to 2035
      • By Country
        • India
        • Australia & New Zealand
        • ASEAN
        • Rest of SAP
      • By Type
      • By Application
    • Market Attractiveness Analysis
      • By Country
      • By Type
      • By Application
    • Key Takeaways
  15. Middle East and Africa Market Analysis 2020 to 2024 and Forecast 2025 to 2035, By Country
    • Historical Market Size Value (USD Billion) & Volume (Kilotons) Trend Analysis By Market Taxonomy, 2020 to 2024
    • Market Size Value (USD Billion) & Volume (Kilotons) Forecast By Market Taxonomy, 2025 to 2035
      • By Country
        • GCC Countries
        • Northern Africa
        • South Africa
        • Turkiye
        • Rest of MEA
      • By Type
      • By Application
    • Market Attractiveness Analysis
      • By Country
      • By Type
      • By Application
    • Key Takeaways
  16. Key Countries Market Analysis
    • USA
      • Pricing Analysis
      • Market Share Analysis, 2024
        • By Type
        • By Application
    • Canada
      • Pricing Analysis
      • Market Share Analysis, 2024
        • By Type
        • By Application
    • Brazil
      • Pricing Analysis
      • Market Share Analysis, 2024
        • By Type
        • By Application
    • Mexico
      • Pricing Analysis
      • Market Share Analysis, 2024
        • By Type
        • By Application
    • Argentina
      • Pricing Analysis
      • Market Share Analysis, 2024
        • By Type
        • By Application
  17. Market Structure Analysis
    • Competition Dashboard
    • Competition Benchmarking
    • Market Share Analysis of Top Players
      • By Regional
      • By Type
      • By Application
  18. Competition Analysis
    • Competition Deep Dive
      • B&G Foods Holdings Corp.
        • Overview
        • Product Portfolio
        • Profitability by Market Segments (Product/Age /Sales Channel/Region)
        • Sales Footprint
        • Strategy Overview
          • Marketing Strategy
          • Product Strategy
          • Channel Strategy
      • Capricorn Food Products India Ltd
        • Overview
        • Product Portfolio
        • Profitability by Market Segments (Product/Age /Sales Channel/Region)
        • Sales Footprint
        • Strategy Overview
          • Marketing Strategy
          • Product Strategy
          • Channel Strategy
      • ConAgra Foods, Inc
        • Overview
        • Product Portfolio
        • Profitability by Market Segments (Product/Age /Sales Channel/Region)
        • Sales Footprint
        • Strategy Overview
          • Marketing Strategy
          • Product Strategy
          • Channel Strategy
      • Dole Food Co.
        • Overview
        • Product Portfolio
        • Profitability by Market Segments (Product/Age /Sales Channel/Region)
        • Sales Footprint
        • Strategy Overview
          • Marketing Strategy
          • Product Strategy
          • Channel Strategy
      • Greenyard NV
        • Overview
        • Product Portfolio
        • Profitability by Market Segments (Product/Age /Sales Channel/Region)
        • Sales Footprint
        • Strategy Overview
          • Marketing Strategy
          • Product Strategy
          • Channel Strategy
      • J.R. Simplot Co.
        • Overview
        • Product Portfolio
        • Profitability by Market Segments (Product/Age /Sales Channel/Region)
        • Sales Footprint
        • Strategy Overview
          • Marketing Strategy
          • Product Strategy
          • Channel Strategy
      • Kerry Group Plc.
        • Overview
        • Product Portfolio
        • Profitability by Market Segments (Product/Age /Sales Channel/Region)
        • Sales Footprint
        • Strategy Overview
          • Marketing Strategy
          • Product Strategy
          • Channel Strategy
      • Pinnacle Foods, Inc.
        • Overview
        • Product Portfolio
        • Profitability by Market Segments (Product/Age /Sales Channel/Region)
        • Sales Footprint
        • Strategy Overview
          • Marketing Strategy
          • Product Strategy
          • Channel Strategy
      • SunOpta Inc.
        • Overview
        • Product Portfolio
        • Profitability by Market Segments (Product/Age /Sales Channel/Region)
        • Sales Footprint
        • Strategy Overview
          • Marketing Strategy
          • Product Strategy
          • Channel Strategy
      • Uren Food Group Limited
        • Overview
        • Product Portfolio
        • Profitability by Market Segments (Product/Age /Sales Channel/Region)
        • Sales Footprint
        • Strategy Overview
          • Marketing Strategy
          • Product Strategy
          • Channel Strategy
  19. Assumptions & Acronyms Used
  20. Research Methodology

List of Tables

  • Table 1: Global Market Value (USD Billion) Forecast by Region, 2020-2035
  • Table 2: Global Market Volume (Kilotons) Forecast by Region, 2020-2035
  • Table 3: Global Market Value (USD Billion) Forecast by Type, 2020-2035
  • Table 4: Global Market Volume (Kilotons) Forecast by Type, 2020-2035
  • Table 5: Global Market Value (USD Billion) Forecast by Application, 2020-2035
  • Table 6: Global Market Volume (Kilotons) Forecast by Application, 2020-2035
  • Table 7: North America Market Value (USD Billion) Forecast by Country, 2020-2035
  • Table 8: North America Market Volume (Kilotons) Forecast by Country, 2020-2035
  • Table 9: North America Market Value (USD Billion) Forecast by Type, 2020-2035
  • Table 10: North America Market Volume (Kilotons) Forecast by Type, 2020-2035
  • Table 11: North America Market Value (USD Billion) Forecast by Application, 2020-2035
  • Table 12: North America Market Volume (Kilotons) Forecast by Application, 2020-2035
  • Table 13: Latin America Market Value (USD Billion) Forecast by Country, 2020-2035
  • Table 14: Latin America Market Volume (Kilotons) Forecast by Country, 2020-2035
  • Table 15: Latin America Market Value (USD Billion) Forecast by Type, 2020-2035
  • Table 16: Latin America Market Volume (Kilotons) Forecast by Type, 2020-2035
  • Table 17: Latin America Market Value (USD Billion) Forecast by Application, 2020-2035
  • Table 18: Latin America Market Volume (Kilotons) Forecast by Application, 2020-2035
  • Table 19: Western Europe Market Value (USD Billion) Forecast by Country, 2020-2035
  • Table 20: Western Europe Market Volume (Kilotons) Forecast by Country, 2020-2035
  • Table 21: Western Europe Market Value (USD Billion) Forecast by Type, 2020-2035
  • Table 22: Western Europe Market Volume (Kilotons) Forecast by Type, 2020-2035
  • Table 23: Western Europe Market Value (USD Billion) Forecast by Application, 2020-2035
  • Table 24: Western Europe Market Volume (Kilotons) Forecast by Application, 2020-2035
  • Table 25: Eastern Europe Market Value (USD Billion) Forecast by Country, 2020-2035
  • Table 26: Eastern Europe Market Volume (Kilotons) Forecast by Country, 2020-2035
  • Table 27: Eastern Europe Market Value (USD Billion) Forecast by Type, 2020-2035
  • Table 28: Eastern Europe Market Volume (Kilotons) Forecast by Type, 2020-2035
  • Table 29: Eastern Europe Market Value (USD Billion) Forecast by Application, 2020-2035
  • Table 30: Eastern Europe Market Volume (Kilotons) Forecast by Application, 2020-2035
  • Table 31: East Asia Market Value (USD Billion) Forecast by Country, 2020-2035
  • Table 32: East Asia Market Volume (Kilotons) Forecast by Country, 2020-2035
  • Table 33: East Asia Market Value (USD Billion) Forecast by Type, 2020-2035
  • Table 34: East Asia Market Volume (Kilotons) Forecast by Type, 2020-2035
  • Table 35: East Asia Market Value (USD Billion) Forecast by Application, 2020-2035
  • Table 36: East Asia Market Volume (Kilotons) Forecast by Application, 2020-2035
  • Table 37: South Asia & Pacific Market Value (USD Billion) Forecast by Country, 2020-2035
  • Table 38: South Asia & Pacific Market Volume (Kilotons) Forecast by Country, 2020-2035
  • Table 39: South Asia & Pacific Market Value (USD Billion) Forecast by Type, 2020-2035
  • Table 40: South Asia & Pacific Market Volume (Kilotons) Forecast by Type, 2020-2035
  • Table 41: South Asia & Pacific Market Value (USD Billion) Forecast by Application, 2020-2035
  • Table 42: South Asia & Pacific Market Volume (Kilotons) Forecast by Application, 2020-2035
  • Table 43: Middle East and Africa Market Value (USD Billion) Forecast by Country, 2020-2035
  • Table 44: Middle East and Africa Market Volume (Kilotons) Forecast by Country, 2020-2035
  • Table 45: Middle East and Africa Market Value (USD Billion) Forecast by Type, 2020-2035
  • Table 46: Middle East and Africa Market Volume (Kilotons) Forecast by Type, 2020-2035
  • Table 47: Middle East and Africa Market Value (USD Billion) Forecast by Application, 2020-2035
  • Table 48: Middle East and Africa Market Volume (Kilotons) Forecast by Application, 2020-2035

List of Figures

  • Figure 1: Global Market Volume (Kilotons) Forecast 2020-2035
  • Figure 2: Global Market Pricing Analysis
  • Figure 3: Global Market Value (USD Billion) Forecast 2020-2035
  • Figure 4: Global Market Value Share and BPS Analysis by Type, 2025 and 2035
  • Figure 5: Global Market Y-o-Y Growth Comparison by Type, 2025-2035
  • Figure 6: Global Market Attractiveness Analysis by Type
  • Figure 7: Global Market Value Share and BPS Analysis by Application, 2025 and 2035
  • Figure 8: Global Market Y-o-Y Growth Comparison by Application, 2025-2035
  • Figure 9: Global Market Attractiveness Analysis by Application
  • Figure 10: Global Market Value (USD Billion) Share and BPS Analysis by Region, 2025 and 2035
  • Figure 11: Global Market Y-o-Y Growth Comparison by Region, 2025-2035
  • Figure 12: Global Market Attractiveness Analysis by Region
  • Figure 13: North America Market Incremental $ Opportunity, 2025-2035
  • Figure 14: Latin America Market Incremental $ Opportunity, 2025-2035
  • Figure 15: Western Europe Market Incremental $ Opportunity, 2025-2035
  • Figure 16: Eastern Europe Market Incremental $ Opportunity, 2025-2035
  • Figure 17: East Asia Market Incremental $ Opportunity, 2025-2035
  • Figure 18: South Asia & Pacific Market Incremental $ Opportunity, 2025-2035
  • Figure 19: Middle East and Africa Market Incremental $ Opportunity, 2025-2035
  • Figure 20: North America Market Value Share and BPS Analysis by Country, 2025 and 2035
  • Figure 21: North America Market Value Share and BPS Analysis by Type, 2025 and 2035
  • Figure 22: North America Market Y-o-Y Growth Comparison by Type, 2025-2035
  • Figure 23: North America Market Attractiveness Analysis by Type
  • Figure 24: North America Market Value Share and BPS Analysis by Application, 2025 and 2035
  • Figure 25: North America Market Y-o-Y Growth Comparison by Application, 2025-2035
  • Figure 26: North America Market Attractiveness Analysis by Application
  • Figure 27: Latin America Market Value Share and BPS Analysis by Country, 2025 and 2035
  • Figure 28: Latin America Market Value Share and BPS Analysis by Type, 2025 and 2035
  • Figure 29: Latin America Market Y-o-Y Growth Comparison by Type, 2025-2035
  • Figure 30: Latin America Market Attractiveness Analysis by Type
  • Figure 31: Latin America Market Value Share and BPS Analysis by Application, 2025 and 2035
  • Figure 32: Latin America Market Y-o-Y Growth Comparison by Application, 2025-2035
  • Figure 33: Latin America Market Attractiveness Analysis by Application
  • Figure 34: Western Europe Market Value Share and BPS Analysis by Country, 2025 and 2035
  • Figure 35: Western Europe Market Value Share and BPS Analysis by Type, 2025 and 2035
  • Figure 36: Western Europe Market Y-o-Y Growth Comparison by Type, 2025-2035
  • Figure 37: Western Europe Market Attractiveness Analysis by Type
  • Figure 38: Western Europe Market Value Share and BPS Analysis by Application, 2025 and 2035
  • Figure 39: Western Europe Market Y-o-Y Growth Comparison by Application, 2025-2035
  • Figure 40: Western Europe Market Attractiveness Analysis by Application
  • Figure 41: Eastern Europe Market Value Share and BPS Analysis by Country, 2025 and 2035
  • Figure 42: Eastern Europe Market Value Share and BPS Analysis by Type, 2025 and 2035
  • Figure 43: Eastern Europe Market Y-o-Y Growth Comparison by Type, 2025-2035
  • Figure 44: Eastern Europe Market Attractiveness Analysis by Type
  • Figure 45: Eastern Europe Market Value Share and BPS Analysis by Application, 2025 and 2035
  • Figure 46: Eastern Europe Market Y-o-Y Growth Comparison by Application, 2025-2035
  • Figure 47: Eastern Europe Market Attractiveness Analysis by Application
  • Figure 48: East Asia Market Value Share and BPS Analysis by Country, 2025 and 2035
  • Figure 49: East Asia Market Value Share and BPS Analysis by Type, 2025 and 2035
  • Figure 50: East Asia Market Y-o-Y Growth Comparison by Type, 2025-2035
  • Figure 51: East Asia Market Attractiveness Analysis by Type
  • Figure 52: East Asia Market Value Share and BPS Analysis by Application, 2025 and 2035
  • Figure 53: East Asia Market Y-o-Y Growth Comparison by Application, 2025-2035
  • Figure 54: East Asia Market Attractiveness Analysis by Application
  • Figure 55: South Asia & Pacific Market Value Share and BPS Analysis by Country, 2025 and 2035
  • Figure 56: South Asia & Pacific Market Value Share and BPS Analysis by Type, 2025 and 2035
  • Figure 57: South Asia & Pacific Market Y-o-Y Growth Comparison by Type, 2025-2035
  • Figure 58: South Asia & Pacific Market Attractiveness Analysis by Type
  • Figure 59: South Asia & Pacific Market Value Share and BPS Analysis by Application, 2025 and 2035
  • Figure 60: South Asia & Pacific Market Y-o-Y Growth Comparison by Application, 2025-2035
  • Figure 61: South Asia & Pacific Market Attractiveness Analysis by Application
  • Figure 62: Middle East and Africa Market Value Share and BPS Analysis by Country, 2025 and 2035
  • Figure 63: Middle East and Africa Market Value Share and BPS Analysis by Type, 2025 and 2035
  • Figure 64: Middle East and Africa Market Y-o-Y Growth Comparison by Type, 2025-2035
  • Figure 65: Middle East and Africa Market Attractiveness Analysis by Type
  • Figure 66: Middle East and Africa Market Value Share and BPS Analysis by Application, 2025 and 2035
  • Figure 67: Middle East and Africa Market Y-o-Y Growth Comparison by Application, 2025-2035
  • Figure 68: Middle East and Africa Market Attractiveness Analysis by Application
  • Figure 69: Global Market - Tier Structure Analysis
  • Figure 70: Global Market - Company Share Analysis

Frequently Asked Questions

What is the projected size of the IQF vegetables market in 2025?

The market size is valued at USD 1.8 billion in 2025.

What is the outlook on IQF vegetables demand by 2035?

The market is forecasted to reach USD 2.9 billion by 2035, reflecting a CAGR of 4.8%.

Which segment leads the IQF vegetables market by the vegetable type segment in 2025?

Potatoes will lead the vegetable type segment, accounting for 26% of the global share in 2025.

What is the top application segment in the IQF vegetables market in 2025?

Ready-to-eat food will dominate the ready-to-food segment with a 36% share in 2025.

Which country is projected to have the fastest-growing IQF vegetables market?

Japan is projected to grow at the fastest rate, with a CAGR of 3.5% from 2025 to 2035.

Explore Similar Insights

Future Market Insights

IQF Vegetables Market