Reports

- Global Locations -

Headquarters

Future Market Insights, Inc.

Christiana Corporate, 200
Continental Drive, Suite 401,
Newark, Delaware - 19713,
United States

T: +1-845-579-5705

Americas

Future Market Insights, Inc.

616 Corporate Way, Suite 2-9018,
Valley Cottage, NY 10989, United States

T: +1-347-918-3531

MEA

Future Market Insights

1602-6 Jumeirah Bay X2 Tower, Plot No: JLT-PH2-X2A,
Jumeirah Lakes Towers, Dubai,
United Arab Emirates

Europe

Future Market Insights

3rd Floor, 207 Regent Street,
W1B 3HH London
United Kingdom

T: + 44 (0) 20 8123 9659
D: +44 (0) 20 3287 4268

Asia Pacific

Future Market Insights

IndiaLand Global Tech Park, Unit UG-1, Behind Grand HighStreet, Phase 1, Hinjawadi, MH, Pune – 411057, India

Intracranial Aneurysm Market Outlook (2022 to 2032)

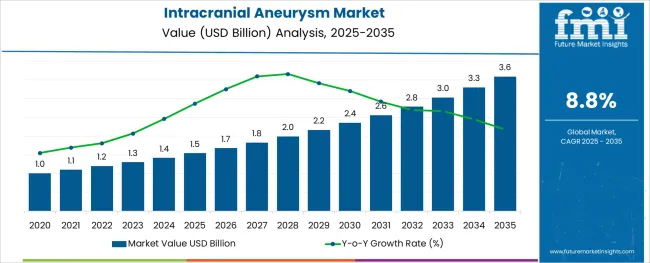
The global intracranial aneurysm market is set to flourish in the global market at a promising CAGR of 8.8% between 2022 and 2032. The market is anticipated to reach USD 2.56 Billion by 2032, while it holds a market value of USD 1.2 Billion in 2022.

Latest technological developments, increasing cases of brain aneurysms & their complications along with the introduction of minimally invasive procedures are gaining traction in the intracranial aneurysm market.

A global study on the intracranial aneurysm market explains that the growing cases of intracranial aneurysms in the brain involve the bulging in the wall of an artery in the brain. It causes swelling, ballooning, and widening. Aneurysms weaken the walls and make it hard for the nerves to function properly.

Intracranial aneurysms and their rising cases are attributed to the growing number of geriatric patients, fueling intracranial aneurysm treatment and solutions. The weak walls are usually thin and make no difference in the support provided by these layers, fueling the demand for intracranial aneurysm solutions and treatment.

The expanding intracranial aneurysm market size is attributed to the new advanced technology integrated with intracranial aneurysm treatment and solutions. As the risk of walls bursting increases, end-user patients, and treatment centers adopt the intracranial aneurysm treatment and solution methods.

The treatment of brain aneurysms includes medical therapy, surgical clipping or endovascular therapy, or coiling without or with adjunctive devices, fueling the demand for intracranial aneurysm treatment solutions.

Attributes Value
Intracranial Aneurysm Market Size (2022) US$ 1.2 Billion
Intracranial Aneurysm Market Projected Size (2032) US$ 2.56 Billion
Intracranial Aneurysm Market Value CAGR (2022 to 2032) 8.8%

Don't pay for what you don't need

Customize your report by selecting specific countries or regions and save 30%!

What are the Major Driving Factors for the Intracranial Aneurysm Market?

Rising high-blood pressure patients through trauma and blood vessels along with hypertension leading to the cases of an intracranial brain aneurysm are fueling the demand for intracranial aneurysm treatment and solutions.

According to the intracranial aneurysm market survey, the market is dynamic in nature and functions in every component. Currently, a large number of people are at risk of a brain aneurysm. The elderly class is more affected and exposed to the condition and seeks instant treatment solutions. From medication to consultancy, the government is focusing more and more on intracranial aneurysm treatment as it grows among the population. Minimally invasive surgeries are also helping patients in getting relief, fueling the demand for intracranial aneurysm treatment solutions.

New technology and innovative techniques like endovascular coiling are being used for the treatment of intracranial aneurysms that are a part of minimally invasive procedures, widely recommended by physicians. In this procedure, a microcatheter is inserted in the groin area through the artery consisting of an aneurysm. That checks upon the condition of the aneurysm and prevents the blood from entering other parts of the brain. This fuels the sales of intracranial aneurysm treatment solutions.

What are the Possible Limitations for the Intracranial Aneurysm Market Future Trends?

The spread of covid-19, high health risk chances during surgeries coupled with the high cost associated with treatment solutions are hindering the growth of the intracranial aneurysm market.

As the covid-19 has stretched its roots and damaged the supply chains of multiple markets, especially with the government putting bans and logistics restrictions, capital generation went low while the expense got high with time, damaging multiple market spaces.

The intracranial aneurysm market was also got adversely affected by the curse of the pandemic as the healthcare centers were filled with the covid-19 patients, and research and development centers were inactive, especially those that research minimally invasive surgeries and their effects. Another factor that hampered the growth of the intracranial aneurysm market is the risk associated with surgeries along with alternative medicine options that end user or patient considers less risky.

Sabyasachi Ghosh
Sabyasachi Ghosh

Principal Consultant

Talk to Analyst

Find your sweet spots for generating winning opportunities in this market.

Comparative View of Adjacent Intracranial Aneurysm Market

Intracranial aneurysm Market:

Attributes Intracranial aneurysm Market
CAGR (2022 to 2032) 8.8%
Market Value (2022) US$ 1.2 Billion
Growth Factor The growing cases of brain aneurysms in the elderly class along with advanced technological developments in minimally invasive surgeries are fueling the demand for intracranial aneurysm treatment solutions.
Future Opportunities New innovative techniques like endovascular techniques to monitor the condition and prevention of clotting and blood flow in other parts of the brain are creating new opportunities
Market Trends The latest trends in the intracranial aneurysm market are the high risks involved and the growing cases in first-world countries that are shaping the market dynamics.

Brain Implants Market:

Attributes Brain Implants Market
CAGR (2022 to 2032) 12.1%
Market Value (2022) US$ 5.72 Billion
Growth Factor Post-lockdown surgeries due to lockdown, higher cases of a brain tumors or clotting along with the latest technology growing and fueling the demand for brain implants.
Future Opportunities The latest technology such as nanotechnology used in the production and research and development procedures is creating opportunities for the brain implants market.
Market Trends The latest market trends involve the exciting price range of these implants with the discounted installation charges shaping the market trends for the brain implants market.

Blood Clot Retrieval Devices Market:

Attributes Blood Clot Retrieval Devices Market
CAGR (2022 to 2032) 14.5%
Market Value (2022) US$ 1.49 Billion
Growth Factor The rise in the health conditions such as a transient ischemic attacks, hemorrhagic stroke, and ischemia along with the latest technological advancements are fueling the demand for brain clotting retrieval devices.
Future Opportunities The opportunities that the market creates are through the addition of new stroke-specific devices, reducing the number of side effects of operative periods.
Market Trends The higher number of neurological and cardiac disorders consumes the most blood clotting retrieval and treatment devices, setting up upward trends for the market.

The Intracranial aneurysm market analysis states that the use of new platforms like Artificial intelligence, big data, and the Internet of Things (IoT) is integrating with treatment solutions. Countries such as the USA, the UK, and Germany have witnessed a high prevalence of intracranial aneurysms in recent years. Neuro Intervention India states that approximately 6.0 million people in the USA develop an unruptured intracranial aneurysm. It is also reported that every year, around 30,000 deaths in the USA are due to the rupture of intracranial aneurysms. This pushes the demand for intracranial aneurysm treatment solutions.

Category-wise Insights for Intracranial Aneurysm Market

Which Type segment of Intracranial aneurysm treatment solution is the Most Lucrative in the Global Market?

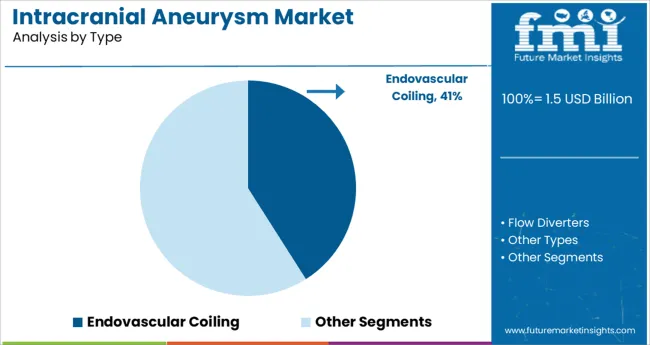
According to the intracranial aneurysm market analysis, the type category has three major segments, Surgical Clipping, Endovascular Coiling, and Flow Diverters. The endovascular coiling segment dominates the market while holding a market share of 85.3% of the global share.

The minimally invasive techniques go through the catheter to locate the aneurysm in the brain. Growing hypertension among the geriatric population leads people to a higher chance of brain aneurysms and other diseases, ultimately gaining traction for the intracranial aneurysm market. The neurology industry and the Intracranial Aneurysm solutions market grow side by side, thriving the demand for Intracranial aneurysms.

What is the Major End User of the Global Intracranial aneurysm Market?

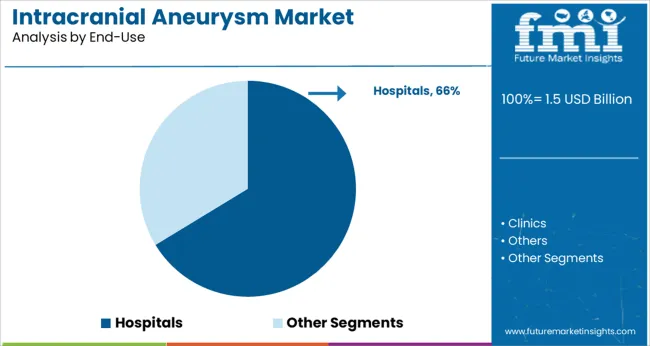
According to the intracranial aneurysm market research report, the end user category is dominated by the hospital segment, holding 89.5% of the global market. The segment grows at a promising CAGR of 8.9% through the forecast period. The factors that attribute to the growth of the intracranial aneurysm market in this segment are the application of technologically advanced tools in operation theaters and intensive care units, the rising number of hospitals globally, and increased government funding to the hospitals. This fuels the sales of intracranial aneurysm treatment solutions.

Get the data you need at a Fraction of the cost

Personalize your report by choosing insights you need
and save 40%!

Regional Analysis

What is the Growth Outlook for the North America Intracranial Aneurysm Market?

North America holds 27% of the global share in the global intracranial aneurysm market in 2022.

The growing intracranial aneurysm market in the North American region is attributed to the growing healthcare facilities, government investments, and rising cases of brain aneurysms. Furthermore, the relevant cases of hypertension and intracranial aneurysms have increased the overall demand for intracranial aneurysm treatment solutions in new regions of North America.

Also, an increasing number of initiatives being undertaken by various organizations is expected to fuel market growth. The new research and development centers are focusing on new treatment approaches, such as the endovascular process.

How is the Performance of the Asia Pacific Intracranial aneurysm Market?

Asia Pacific region is anticipated to thrive at the highest CAGR of 12.7% through 2032. Presence of emerging economies like India and China that are investing huge capital in building their healthcare infrastructure, advancing and making it tech-enabled.

The cases of hypertension and brain aneurysms rising with the geriatric population growing in the region are fueling the growth of the market. Other factors that gain traction for the intracranial aneurysm market are an increasing number of initiatives being undertaken by various organizations that are expected to fuel market growth.

How is the Start-up Ecosystem in the Intracranial aneurysm Market?

The Intracranial aneurysm market size expands the new diseases, and the markets related to their treatment and cure are proliferating. Higher government investments and businesses are taking an interest in the specific healthcare support centers, along with the rising healthcare sector in almost every region, which is increasing the startup activity.

The non-profitable organization is also taking part in building these health centers. For instance, The Bee Foundation (TBF), an NGO, is focusing on spreading awareness and reducing the number of deaths due to cerebral aneurysms through innovative research.
Competitive Landscape for the Intracranial aneurysm Market

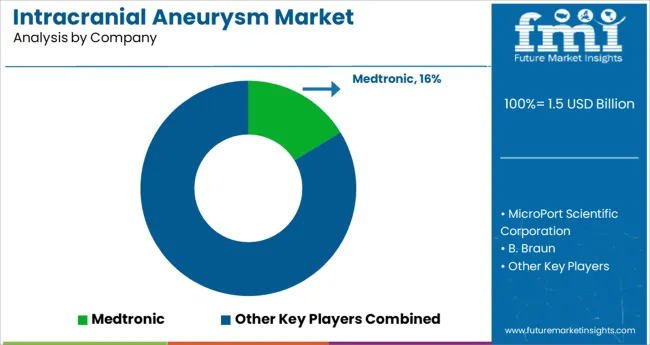
The intracranial aneurysm market has various key competitors that focus on expanding healthcare centers with advanced technology. The key competitors understand and focus on new techniques that are aneurysm-specific and target wall healing and blood prevention. This makes the competitive landscape more dynamic and versatile, owing to the expansion of the intracranial aneurysm market.

The key competitors flourishing in the growth of intracranial aneurysm treatment solutions are Medtronic, Microport Scientific Corporation, B. Braun, Stryker, Johnson and Johnson Services Inc., Microvention Inc., Codman Neuro (Integra Lifesciences).

Recent Developments in the Global Intracranial Aneurysm Market

  • MicroPort Scientific Corporation has introduced new therapies for neurovascular intervention that resolve potential issues related to brain aneurysms, offering specific tools to surgeons. This fuels the sales of intracranial aneurysm treatment solutions.
  • Stryker has added the neuro form atlas stent system that is further used in conjunction with metal coils that help in packing Aneurysms (weak walls and blood vessel scars) in the brain. This is anticipated to help multiple surgeons across the globe.

Global Intracranial aneurysm Market Key Players

  • Medtronic
  • MicroPort Scientific Corporation
  • B. Braun
  • Stryker
  • Johnson and Johnson Services Inc.
  • Microvention Inc.
  • Codman Neuro (Integra Lifesciences)
  • Renolit

Intracranial aneurysm Market by Segmentation

By Type Outlook:

  • Surgical Clipping
  • Endovascular Coiling
  • Flow Diverters

By Application Outlook:

  • Hospitals
  • Clinics
  • Others

By Region:

  • North America
  • Latin America
  • Europe
  • Middle East and Africa
  • South Asia
  • Oceania
  • Middle East and Africa

Frequently Asked Questions

At What Rate will the Intracranial Aneurysm Market Grow?

The intracranial aneurysm market is expected to grow at 8.8% CAGR from 2022 to 2032.

What is the Net Worth of the Global Intracranial Aneurysm Market?

The Intracranial aneurysm market is estimated to be around US$ 1.2 Billion in 2022.

What is the Projected Value of the Intracranial Aneurysm Market?

The intracranial aneurysm market is anticipated to reach a revenue of US$ 2.56 Billion by 2032.

Which is the Best Performing Type Category in the Intracranial Aneurysm Market?

The Endovascular Coiling segment is forecasted to hold the largest market share by type category in the intracranial aneurysm market.

Which is the Rapidly Growing Region for the Intracranial Aneurysm Market?

North American region is the most dominant region for the intracranial aneurysm market in 2022 with a market share of 27.2% of the global market.

Table of Content

1. Executive Summary | Intracranial Aneurysm Market

    1.1. Global Market Outlook

    1.2. Demand-side Trends

    1.3. Supply-side Trends

    1.4. Technology Roadmap Analysis

    1.5. Analysis and Recommendations

2. Market Overview

    2.1. Market Coverage / Taxonomy

    2.2. Market Definition / Scope / Limitations

3. Market Background

    3.1. Market Dynamics

        3.1.1. Drivers

        3.1.2. Restraints

        3.1.3. Opportunity

        3.1.4. Trends

    3.2. Scenario Forecast

        3.2.1. Demand in Optimistic Scenario

        3.2.2. Demand in Likely Scenario

        3.2.3. Demand in Conservative Scenario

    3.3. Opportunity Map Analysis

    3.4. Investment Feasibility Matrix

    3.5. PESTLE and Porter’s Analysis

    3.6. Regulatory Landscape

        3.6.1. By Key Regions

        3.6.2. By Key Countries

    3.7. Regional Parent Market Outlook

4. Global Market Analysis 2017 to 2021 and Forecast, 2022 to 2032

    4.1. Historical Market Size Value (US$ Million) Analysis, 2017 to 2021

    4.2. Current and Future Market Size Value (US$ Million) Projections, 2022 to 2032

        4.2.1. Y-o-Y Growth Trend Analysis

        4.2.2. Absolute $ Opportunity Analysis

5. Global Market Analysis 2017 to 2021 and Forecast 2022 to 2032, By Type

    5.1. Introduction / Key Findings

    5.2. Historical Market Size Value (US$ Million) Analysis By Type, 2017 to 2021

    5.3. Current and Future Market Size Value (US$ Million) Analysis and Forecast By Type, 2022 to 2032

        5.3.1. Surgical Clipping

        5.3.2. Endovascular Coiling

        5.3.3. Flow Diverters

        5.3.4. Other Types

    5.4. Y-o-Y Growth Trend Analysis By Type, 2017 to 2021

    5.5. Absolute $ Opportunity Analysis By Type, 2022 to 2032

6. Global Market Analysis 2017 to 2021 and Forecast 2022 to 2032, By End-use

    6.1. Introduction / Key Findings

    6.2. Historical Market Size Value (US$ Million) Analysis By End-use, 2017 to 2021

    6.3. Current and Future Market Size Value (US$ Million) Analysis and Forecast By End-use, 2022 to 2032

        6.3.1. Hospitals

        6.3.2. Clinics

        6.3.3. Others

    6.4. Y-o-Y Growth Trend Analysis By End-use, 2017 to 2021

    6.5. Absolute $ Opportunity Analysis By End-use, 2022 to 2032

7. Global Market Analysis 2017 to 2021 and Forecast 2022 to 2032, By Region

    7.1. Introduction

    7.2. Historical Market Size Value (US$ Million) Analysis By Region, 2017 to 2021

    7.3. Current Market Size Value (US$ Million) Analysis and Forecast By Region, 2022 to 2032

        7.3.1. North America

        7.3.2. Latin America

        7.3.3. Europe

        7.3.4. Asia Pacific

        7.3.5. Middle East and Africa

    7.4. Market Attractiveness Analysis By Region

8. North America Market Analysis 2017 to 2021 and Forecast 2022 to 2032, By Country

    8.1. Historical Market Size Value (US$ Million) Trend Analysis By Market Taxonomy, 2017 to 2021

    8.2. Market Size Value (US$ Million) Forecast By Market Taxonomy, 2022 to 2032

        8.2.1. By Country

            8.2.1.1. United States of America

            8.2.1.2. Canada

        8.2.2. By Type

        8.2.3. By End-use

    8.3. Market Attractiveness Analysis

        8.3.1. By Country

        8.3.2. By Type

        8.3.3. By End-use

    8.4. Key Takeaways

9. Latin America Market Analysis 2017 to 2021 and Forecast 2022 to 2032, By Country

    9.1. Historical Market Size Value (US$ Million) Trend Analysis By Market Taxonomy, 2017 to 2021

    9.2. Market Size Value (US$ Million) Forecast By Market Taxonomy, 2022 to 2032

        9.2.1. By Country

            9.2.1.1. Brazil

            9.2.1.2. Mexico

            9.2.1.3. Rest of Latin America

        9.2.2. By Type

        9.2.3. By End-use

    9.3. Market Attractiveness Analysis

        9.3.1. By Country

        9.3.2. By Type

        9.3.3. By End-use

    9.4. Key Takeaways

10. Europe Market Analysis 2017 to 2021 and Forecast 2022 to 2032, By Country

    10.1. Historical Market Size Value (US$ Million) Trend Analysis By Market Taxonomy, 2017 to 2021

    10.2. Market Size Value (US$ Million) Forecast By Market Taxonomy, 2022 to 2032

        10.2.1. By Country

            10.2.1.1. Germany

            10.2.1.2. United Kingdom

            10.2.1.3. France

            10.2.1.4. Spain

            10.2.1.5. Italy

            10.2.1.6. Rest of Europe

        10.2.2. By Type

        10.2.3. By End-use

    10.3. Market Attractiveness Analysis

        10.3.1. By Country

        10.3.2. By Type

        10.3.3. By End-use

    10.4. Key Takeaways

11. Asia Pacific Market Analysis 2017 to 2021 and Forecast 2022 to 2032, By Country

    11.1. Historical Market Size Value (US$ Million) Trend Analysis By Market Taxonomy, 2017 to 2021

    11.2. Market Size Value (US$ Million) Forecast By Market Taxonomy, 2022 to 2032

        11.2.1. By Country

            11.2.1.1. China

            11.2.1.2. Japan

            11.2.1.3. South Korea

            11.2.1.4. India

            11.2.1.5. Malaysia

            11.2.1.6. Singapore

            11.2.1.7. Australia

            11.2.1.8. New Zealand

            11.2.1.9. Rest of Asia-Pacific

        11.2.2. By Type

        11.2.3. By End-use

    11.3. Market Attractiveness Analysis

        11.3.1. By Country

        11.3.2. By Type

        11.3.3. By End-use

    11.4. Key Takeaways

12. Middle East and Africa Market Analysis 2017 to 2021 and Forecast 2022 to 2032, By Country

    12.1. Historical Market Size Value (US$ Million) Trend Analysis By Market Taxonomy, 2017 to 2021

    12.2. Market Size Value (US$ Million) Forecast By Market Taxonomy, 2022 to 2032

        12.2.1. By Country

            12.2.1.1. GCC Countries

            12.2.1.2. South Africa

            12.2.1.3. Israel

            12.2.1.4. Rest of Middle East and Africa

        12.2.2. By Type

        12.2.3. By End-use

    12.3. Market Attractiveness Analysis

        12.3.1. By Country

        12.3.2. By Type

        12.3.3. By End-use

    12.4. Key Takeaways

13. Key Countries Market Analysis

    13.1. United States of America

        13.1.1. Pricing Analysis

        13.1.2. Market Share Analysis, 2021

            13.1.2.1. By Type

            13.1.2.2. By End-use

    13.2. Canada

        13.2.1. Pricing Analysis

        13.2.2. Market Share Analysis, 2021

            13.2.2.1. By Type

            13.2.2.2. By End-use

    13.3. Brazil

        13.3.1. Pricing Analysis

        13.3.2. Market Share Analysis, 2021

            13.3.2.1. By Type

            13.3.2.2. By End-use

    13.4. Mexico

        13.4.1. Pricing Analysis

        13.4.2. Market Share Analysis, 2021

            13.4.2.1. By Type

            13.4.2.2. By End-use

    13.5. Germany

        13.5.1. Pricing Analysis

        13.5.2. Market Share Analysis, 2021

            13.5.2.1. By Type

            13.5.2.2. By End-use

    13.6. United Kingdom

        13.6.1. Pricing Analysis

        13.6.2. Market Share Analysis, 2021

            13.6.2.1. By Type

            13.6.2.2. By End-use

    13.7. France

        13.7.1. Pricing Analysis

        13.7.2. Market Share Analysis, 2021

            13.7.2.1. By Type

            13.7.2.2. By End-use

    13.8. Spain

        13.8.1. Pricing Analysis

        13.8.2. Market Share Analysis, 2021

            13.8.2.1. By Type

            13.8.2.2. By End-use

    13.9. Italy

        13.9.1. Pricing Analysis

        13.9.2. Market Share Analysis, 2021

            13.9.2.1. By Type

            13.9.2.2. By End-use

    13.10. China

        13.10.1. Pricing Analysis

        13.10.2. Market Share Analysis, 2021

            13.10.2.1. By Type

            13.10.2.2. By End-use

    13.11. Japan

        13.11.1. Pricing Analysis

        13.11.2. Market Share Analysis, 2021

            13.11.2.1. By Type

            13.11.2.2. By End-use

    13.12. South Korea

        13.12.1. Pricing Analysis

        13.12.2. Market Share Analysis, 2021

            13.12.2.1. By Type

            13.12.2.2. By End-use

    13.13. Malaysia

        13.13.1. Pricing Analysis

        13.13.2. Market Share Analysis, 2021

            13.13.2.1. By Type

            13.13.2.2. By End-use

    13.14. Singapore

        13.14.1. Pricing Analysis

        13.14.2. Market Share Analysis, 2021

            13.14.2.1. By Type

            13.14.2.2. By End-use

    13.15. Australia

        13.15.1. Pricing Analysis

        13.15.2. Market Share Analysis, 2021

            13.15.2.1. By Type

            13.15.2.2. By End-use

    13.16. New Zealand

        13.16.1. Pricing Analysis

        13.16.2. Market Share Analysis, 2021

            13.16.2.1. By Type

            13.16.2.2. By End-use

    13.17. GCC Countries

        13.17.1. Pricing Analysis

        13.17.2. Market Share Analysis, 2021

            13.17.2.1. By Type

            13.17.2.2. By End-use

    13.18. South Africa

        13.18.1. Pricing Analysis

        13.18.2. Market Share Analysis, 2021

            13.18.2.1. By Type

            13.18.2.2. By End-use

    13.19. Israel

        13.19.1. Pricing Analysis

        13.19.2. Market Share Analysis, 2021

            13.19.2.1. By Type

            13.19.2.2. By End-use

14. Market Structure Analysis

    14.1. Competition Dashboard

    14.2. Competition Benchmarking

    14.3. Market Share Analysis of Top Players

        14.3.1. By Regional

        14.3.2. By Type

        14.3.3. By End-use

15. Competition Analysis

    15.1. Competition Deep Dive

        15.1.1. Medtronic

            15.1.1.1. Overview

            15.1.1.2. Product Portfolio

            15.1.1.3. Profitability by Market Segments

            15.1.1.4. Sales Footprint

            15.1.1.5. Strategy Overview

                15.1.1.5.1. Marketing Strategy

        15.1.2. MicroPort Scientific Corporation

            15.1.2.1. Overview

            15.1.2.2. Product Portfolio

            15.1.2.3. Profitability by Market Segments

            15.1.2.4. Sales Footprint

            15.1.2.5. Strategy Overview

                15.1.2.5.1. Marketing Strategy

        15.1.3. B. Braun

            15.1.3.1. Overview

            15.1.3.2. Product Portfolio

            15.1.3.3. Profitability by Market Segments

            15.1.3.4. Sales Footprint

            15.1.3.5. Strategy Overview

                15.1.3.5.1. Marketing Strategy

        15.1.4. Stryker

            15.1.4.1. Overview

            15.1.4.2. Product Portfolio

            15.1.4.3. Profitability by Market Segments

            15.1.4.4. Sales Footprint

            15.1.4.5. Strategy Overview

                15.1.4.5.1. Marketing Strategy

        15.1.5. Johnson and Johnson Services Inc.

            15.1.5.1. Overview

            15.1.5.2. Product Portfolio

            15.1.5.3. Profitability by Market Segments

            15.1.5.4. Sales Footprint

            15.1.5.5. Strategy Overview

                15.1.5.5.1. Marketing Strategy

        15.1.6. Microvention Inc.

            15.1.6.1. Overview

            15.1.6.2. Product Portfolio

            15.1.6.3. Profitability by Market Segments

            15.1.6.4. Sales Footprint

            15.1.6.5. Strategy Overview

                15.1.6.5.1. Marketing Strategy

        15.1.7. Integra LifeSciences

            15.1.7.1. Overview

            15.1.7.2. Product Portfolio

            15.1.7.3. Profitability by Market Segments

            15.1.7.4. Sales Footprint

            15.1.7.5. Strategy Overview

                15.1.7.5.1. Marketing Strategy

        15.1.8. Sim & Cure

            15.1.8.1. Overview

            15.1.8.2. Product Portfolio

            15.1.8.3. Profitability by Market Segments

            15.1.8.4. Sales Footprint

            15.1.8.5. Strategy Overview

                15.1.8.5.1. Marketing Strategy

        15.1.9. Oxford Endovascular

            15.1.9.1. Overview

            15.1.9.2. Product Portfolio

            15.1.9.3. Profitability by Market Segments

            15.1.9.4. Sales Footprint

            15.1.9.5. Strategy Overview

                15.1.9.5.1. Marketing Strategy

        15.1.10. Spartan Micro, Inc.

            15.1.10.1. Overview

            15.1.10.2. Product Portfolio

            15.1.10.3. Profitability by Market Segments

            15.1.10.4. Sales Footprint

            15.1.10.5. Strategy Overview

                15.1.10.5.1. Marketing Strategy

        15.1.11. Zylox-Tonbridge Medical Technology Co., Ltd

            15.1.11.1. Overview

            15.1.11.2. Product Portfolio

            15.1.11.3. Profitability by Market Segments

            15.1.11.4. Sales Footprint

            15.1.11.5. Strategy Overview

                15.1.11.5.1. Marketing Strategy

        15.1.12. Mizuho Medical Co.Ltd.

            15.1.12.1. Overview

            15.1.12.2. Product Portfolio

            15.1.12.3. Profitability by Market Segments

            15.1.12.4. Sales Footprint

            15.1.12.5. Strategy Overview

                15.1.12.5.1. Marketing Strategy

        15.1.13. Lepu Medical Technology (Beijing)Co., Ltd.

            15.1.13.1. Overview

            15.1.13.2. Product Portfolio

            15.1.13.3. Profitability by Market Segments

            15.1.13.4. Sales Footprint

            15.1.13.5. Strategy Overview

                15.1.13.5.1. Marketing Strategy

        15.1.14. Phenox GmbH

            15.1.14.1. Overview

            15.1.14.2. Product Portfolio

            15.1.14.3. Profitability by Market Segments

            15.1.14.4. Sales Footprint

            15.1.14.5. Strategy Overview

                15.1.14.5.1. Marketing Strategy

        15.1.15. Peter Lazic GmbH

            15.1.15.1. Overview

            15.1.15.2. Product Portfolio

            15.1.15.3. Profitability by Market Segments

            15.1.15.4. Sales Footprint

            15.1.15.5. Strategy Overview

                15.1.15.5.1. Marketing Strategy

16. Assumptions & Acronyms Used

17. Research Methodology

List of Tables

Table 1: Global Market Value (US$ Million) Forecast by Region, 2017 to 2032

Table 2: Global Market Value (US$ Million) Forecast by Type, 2017 to 2032

Table 3: Global Market Value (US$ Million) Forecast by End-use, 2017 to 2032

Table 4: North America Market Value (US$ Million) Forecast by Country, 2017 to 2032

Table 5: North America Market Value (US$ Million) Forecast by Type, 2017 to 2032

Table 6: North America Market Value (US$ Million) Forecast by End-use, 2017 to 2032

Table 7: Latin America Market Value (US$ Million) Forecast by Country, 2017 to 2032

Table 8: Latin America Market Value (US$ Million) Forecast by Type, 2017 to 2032

Table 9: Latin America Market Value (US$ Million) Forecast by End-use, 2017 to 2032

Table 10: Europe Market Value (US$ Million) Forecast by Country, 2017 to 2032

Table 11: Europe Market Value (US$ Million) Forecast by Type, 2017 to 2032

Table 12: Europe Market Value (US$ Million) Forecast by End-use, 2017 to 2032

Table 13: Asia Pacific Market Value (US$ Million) Forecast by Country, 2017 to 2032

Table 14: Asia Pacific Market Value (US$ Million) Forecast by Type, 2017 to 2032

Table 15: Asia Pacific Market Value (US$ Million) Forecast by End-use, 2017 to 2032

Table 16: Middle East and Africa Market Value (US$ Million) Forecast by Country, 2017 to 2032

Table 17: Middle East and Africa Market Value (US$ Million) Forecast by Type, 2017 to 2032

Table 18: Middle East and Africa Market Value (US$ Million) Forecast by End-use, 2017 to 2032

List of Charts

Figure 1: Global Market Value (US$ Million) by Type, 2022 to 2032

Figure 2: Global Market Value (US$ Million) by End-use, 2022 to 2032

Figure 3: Global Market Value (US$ Million) by Region, 2022 to 2032

Figure 4: Global Market Value (US$ Million) Analysis by Region, 2017 to 2032

Figure 5: Global Market Value Share (%) and BPS Analysis by Region, 2022 to 2032

Figure 6: Global Market Y-o-Y Growth (%) Projections by Region, 2022 to 2032

Figure 7: Global Market Value (US$ Million) Analysis by Type, 2017 to 2032

Figure 8: Global Market Value Share (%) and BPS Analysis by Type, 2022 to 2032

Figure 9: Global Market Y-o-Y Growth (%) Projections by Type, 2022 to 2032

Figure 10: Global Market Value (US$ Million) Analysis by End-use, 2017 to 2032

Figure 11: Global Market Value Share (%) and BPS Analysis by End-use, 2022 to 2032

Figure 12: Global Market Y-o-Y Growth (%) Projections by End-use, 2022 to 2032

Figure 13: Global Market Attractiveness by Type, 2022 to 2032

Figure 14: Global Market Attractiveness by End-use, 2022 to 2032

Figure 15: Global Market Attractiveness by Region, 2022 to 2032

Figure 16: North America Market Value (US$ Million) by Type, 2022 to 2032

Figure 17: North America Market Value (US$ Million) by End-use, 2022 to 2032

Figure 18: North America Market Value (US$ Million) by Country, 2022 to 2032

Figure 19: North America Market Value (US$ Million) Analysis by Country, 2017 to 2032

Figure 20: North America Market Value Share (%) and BPS Analysis by Country, 2022 to 2032

Figure 21: North America Market Y-o-Y Growth (%) Projections by Country, 2022 to 2032

Figure 22: North America Market Value (US$ Million) Analysis by Type, 2017 to 2032

Figure 23: North America Market Value Share (%) and BPS Analysis by Type, 2022 to 2032

Figure 24: North America Market Y-o-Y Growth (%) Projections by Type, 2022 to 2032

Figure 25: North America Market Value (US$ Million) Analysis by End-use, 2017 to 2032

Figure 26: North America Market Value Share (%) and BPS Analysis by End-use, 2022 to 2032

Figure 27: North America Market Y-o-Y Growth (%) Projections by End-use, 2022 to 2032

Figure 28: North America Market Attractiveness by Type, 2022 to 2032

Figure 29: North America Market Attractiveness by End-use, 2022 to 2032

Figure 30: North America Market Attractiveness by Country, 2022 to 2032

Figure 31: Latin America Market Value (US$ Million) by Type, 2022 to 2032

Figure 32: Latin America Market Value (US$ Million) by End-use, 2022 to 2032

Figure 33: Latin America Market Value (US$ Million) by Country, 2022 to 2032

Figure 34: Latin America Market Value (US$ Million) Analysis by Country, 2017 to 2032

Figure 35: Latin America Market Value Share (%) and BPS Analysis by Country, 2022 to 2032

Figure 36: Latin America Market Y-o-Y Growth (%) Projections by Country, 2022 to 2032

Figure 37: Latin America Market Value (US$ Million) Analysis by Type, 2017 to 2032

Figure 38: Latin America Market Value Share (%) and BPS Analysis by Type, 2022 to 2032

Figure 39: Latin America Market Y-o-Y Growth (%) Projections by Type, 2022 to 2032

Figure 40: Latin America Market Value (US$ Million) Analysis by End-use, 2017 to 2032

Figure 41: Latin America Market Value Share (%) and BPS Analysis by End-use, 2022 to 2032

Figure 42: Latin America Market Y-o-Y Growth (%) Projections by End-use, 2022 to 2032

Figure 43: Latin America Market Attractiveness by Type, 2022 to 2032

Figure 44: Latin America Market Attractiveness by End-use, 2022 to 2032

Figure 45: Latin America Market Attractiveness by Country, 2022 to 2032

Figure 46: Europe Market Value (US$ Million) by Type, 2022 to 2032

Figure 47: Europe Market Value (US$ Million) by End-use, 2022 to 2032

Figure 48: Europe Market Value (US$ Million) by Country, 2022 to 2032

Figure 49: Europe Market Value (US$ Million) Analysis by Country, 2017 to 2032

Figure 50: Europe Market Value Share (%) and BPS Analysis by Country, 2022 to 2032

Figure 51: Europe Market Y-o-Y Growth (%) Projections by Country, 2022 to 2032

Figure 52: Europe Market Value (US$ Million) Analysis by Type, 2017 to 2032

Figure 53: Europe Market Value Share (%) and BPS Analysis by Type, 2022 to 2032

Figure 54: Europe Market Y-o-Y Growth (%) Projections by Type, 2022 to 2032

Figure 55: Europe Market Value (US$ Million) Analysis by End-use, 2017 to 2032

Figure 56: Europe Market Value Share (%) and BPS Analysis by End-use, 2022 to 2032

Figure 57: Europe Market Y-o-Y Growth (%) Projections by End-use, 2022 to 2032

Figure 58: Europe Market Attractiveness by Type, 2022 to 2032

Figure 59: Europe Market Attractiveness by End-use, 2022 to 2032

Figure 60: Europe Market Attractiveness by Country, 2022 to 2032

Figure 61: Asia Pacific Market Value (US$ Million) by Type, 2022 to 2032

Figure 62: Asia Pacific Market Value (US$ Million) by End-use, 2022 to 2032

Figure 63: Asia Pacific Market Value (US$ Million) by Country, 2022 to 2032

Figure 64: Asia Pacific Market Value (US$ Million) Analysis by Country, 2017 to 2032

Figure 65: Asia Pacific Market Value Share (%) and BPS Analysis by Country, 2022 to 2032

Figure 66: Asia Pacific Market Y-o-Y Growth (%) Projections by Country, 2022 to 2032

Figure 67: Asia Pacific Market Value (US$ Million) Analysis by Type, 2017 to 2032

Figure 68: Asia Pacific Market Value Share (%) and BPS Analysis by Type, 2022 to 2032

Figure 69: Asia Pacific Market Y-o-Y Growth (%) Projections by Type, 2022 to 2032

Figure 70: Asia Pacific Market Value (US$ Million) Analysis by End-use, 2017 to 2032

Figure 71: Asia Pacific Market Value Share (%) and BPS Analysis by End-use, 2022 to 2032

Figure 72: Asia Pacific Market Y-o-Y Growth (%) Projections by End-use, 2022 to 2032

Figure 73: Asia Pacific Market Attractiveness by Type, 2022 to 2032

Figure 74: Asia Pacific Market Attractiveness by End-use, 2022 to 2032

Figure 75: Asia Pacific Market Attractiveness by Country, 2022 to 2032

Figure 76: Middle East and Africa Market Value (US$ Million) by Type, 2022 to 2032

Figure 77: Middle East and Africa Market Value (US$ Million) by End-use, 2022 to 2032

Figure 78: Middle East and Africa Market Value (US$ Million) by Country, 2022 to 2032

Figure 79: Middle East and Africa Market Value (US$ Million) Analysis by Country, 2017 to 2032

Figure 80: Middle East and Africa Market Value Share (%) and BPS Analysis by Country, 2022 to 2032

Figure 81: Middle East and Africa Market Y-o-Y Growth (%) Projections by Country, 2022 to 2032

Figure 82: Middle East and Africa Market Value (US$ Million) Analysis by Type, 2017 to 2032

Figure 83: Middle East and Africa Market Value Share (%) and BPS Analysis by Type, 2022 to 2032

Figure 84: Middle East and Africa Market Y-o-Y Growth (%) Projections by Type, 2022 to 2032

Figure 85: Middle East and Africa Market Value (US$ Million) Analysis by End-use, 2017 to 2032

Figure 86: Middle East and Africa Market Value Share (%) and BPS Analysis by End-use, 2022 to 2032

Figure 87: Middle East and Africa Market Y-o-Y Growth (%) Projections by End-use, 2022 to 2032

Figure 88: Middle East and Africa Market Attractiveness by Type, 2022 to 2032

Figure 89: Middle East and Africa Market Attractiveness by End-use, 2022 to 2032

Figure 90: Middle East and Africa Market Attractiveness by Country, 2022 to 2032

Recommendations

Healthcare

Abdominal Aortic Aneurysm Treatment Market

Published : November 2022

Explore Healthcare Insights

View Reports

Intracranial Aneurysm Market