The licoisoflavone market is expected to reach USD 374.1 million by 2035, recording an absolute increase of USD 163.9 million over the forecast period 2025-2035. The licoisoflavone market is valued at USD 210.2 million in 2025 and is expected to grow at a CAGR of 5.9% over the assessment period. Growth is driven by increasing demand for natural pharmaceutical ingredients, rising adoption of bioactive compounds in therapeutic applications, and growing focus on personalized medicine across the global pharmaceutical and nutraceutical sectors. Licoisoflavone offers anti-inflammatory properties, enhanced bioavailability, and standardized therapeutic efficacy, making it suitable for pharmaceutical companies, nutraceutical manufacturers, and cosmetic formulation facilities.
Licorice root extracts account for the largest share at 78% due to superior bioactivity profiles, proven therapeutic effectiveness, and compatibility with natural medicine frameworks, while synthetic variants support standardized pharmaceutical applications requiring precise dosing control. Pharmaceutical applications represent the dominant share of demand at 35%, followed by nutraceutical programs as manufacturers expand therapeutic ingredient offerings.
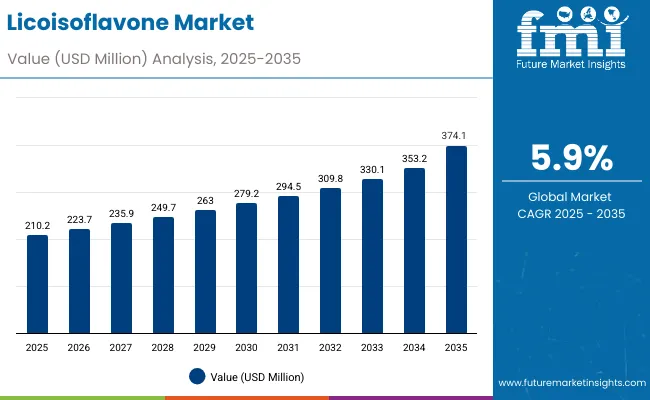
Licoisoflavone Market Key Takeaways
| Metric | Value |
|---|---|
| Market Value (2025) | USD 210.2 million |
| Market Forecast Value (2035) | USD 374.1 million |
| Forecast CAGR (2025 to 2035) | 5.9% |
Europe, particularly Germany and the UK, leads growth due to pharmaceutical research advancement and biotechnology modernization, while Asia Pacific shows steady demand supported by established extraction operations in China and India. Competition in the licoisoflavone market remains moderately consolidated, with key companies such as BioCrick Life Science, Hangzhou Keying Chem, and Givaudan focusing on advanced extraction technologies, purification systems, and pharmaceutical-grade quality capabilities to strengthen market positioning.
Licoisoflavone represents a bioactive isoflavone compound primarily derived from Glycyrrhiza glabra root systems through specialized extraction processes, demonstrating significant therapeutic properties including anti-inflammatory, antioxidant, and estrogenic activity. The compound belongs to the flavonoid class of natural products, containing phenolic structures that contribute to its biological activity and pharmaceutical applications. Natural extraction methods utilize traditional solvent systems and modern chromatographic techniques to achieve pharmaceutical-grade purity levels suitable for medicinal applications.
Chemical synthesis pathways provide alternative production methods through controlled organic reactions that replicate natural biosynthetic processes. Synthetic production enables consistent supply availability and standardized potency levels compared to natural extraction variations. Advanced pharmaceutical manufacturing facilities implement both natural and synthetic approaches based on application requirements, regulatory specifications, and cost optimization parameters.
Pharmaceutical applications dominate licoisoflavone consumption through active pharmaceutical ingredient formulations targeting hormonal regulation, cardiovascular health, and anti-inflammatory treatments. Research studies demonstrate therapeutic efficacy in treating menopausal symptoms, osteoporosis prevention, and cardiovascular risk reduction. Clinical development programs investigate expanded therapeutic applications including cancer prevention, cognitive health, and metabolic disorder management.
Nutraceutical formulations incorporate licoisoflavone into dietary supplement products targeting women's health, bone health, and general wellness applications. Standardized extracts provide consistent dosing and bioavailability characteristics suitable for consumer health products. Quality control systems ensure compound stability, purity verification, and regulatory compliance across different market regions.
Cosmetic applications utilize licoisoflavone's antioxidant properties in anti-aging formulations, skin protection products, and hormonal balance treatments. The compound's ability to interact with estrogen receptors provides unique benefits for mature skin applications and hormonal skincare solutions. Processing technologies enable stable incorporation into various cosmetic delivery systems including creams, serums, and treatment products.
Between 2025 and 2030, the licoisoflavone market is projected to expand from USD 210.2 million to USD 279.2 million, resulting in a value increase of USD 69.0 million, which represents 42.1% of the total forecast growth for the decade. This phase of development will be shaped by rising demand for pharmaceutical applications and natural therapeutic compounds, product innovation in extraction technologies and purification systems, as well as expanding integration with nutraceutical manufacturing and cosmetic applications. Companies are establishing competitive positions through investment in extraction capabilities, advanced purification technologies, and strategic market expansion across pharmaceutical, nutraceutical, and cosmetic applications.
From 2030 to 2035, the market is forecast to grow from USD 279.2 million to USD 374.1 million, adding another USD 94.9 million, which constitutes 57.9% of the overall ten-year expansion. This period is expected to be characterized by the expansion of specialized pharmaceutical applications, including advanced therapeutic formulations and next-generation drug delivery systems tailored for specific health requirements, strategic collaborations between licoisoflavone producers and pharmaceutical companies, and an enhanced focus on high-purity standards and automated processing protocols. The growing emphasis on natural pharmaceutical ingredients and personalized medicine will drive demand for comprehensive licoisoflavone solutions across diverse therapeutic applications.
The licoisoflavone market grows by enabling pharmaceutical manufacturers and nutraceutical companies to optimize product formulations while accessing specialized bioactive compounds without substantial in-house extraction infrastructure investment. Manufacturing companies and healthcare operators face mounting pressure to develop advanced therapeutic formulations and natural health products while managing complex regulatory requirements, with high-purity licoisoflavone typically providing 40-60% performance enhancement compared to conventional alternatives, making pharmaceutical-grade extracts essential for competitive market positioning.
The healthcare industry's need for natural bioactive compounds and application-specific therapeutic capabilities creates demand for comprehensive licoisoflavone solutions that can provide superior efficacy, maintain consistent quality standards, and ensure reliable operation without compromising product safety or regulatory compliance.
Government initiatives promoting natural pharmaceutical ingredients and therapeutic research drive adoption in pharmaceutical manufacturing, nutraceutical production, and cosmetic applications, where compound quality has a direct impact on product performance and clinical outcomes. However, supply complexity constraints during large-scale extraction projects and the expertise requirements for bioactive compound processing may limit accessibility among smaller pharmaceutical companies and developing regions with limited technical infrastructure for advanced extraction systems.
The market is segmented by source, purity, application, form, sales channel, and region. By source, the market is divided into licorice root and synthetic. Based on purity, the market is categorized into ≥98% and <98%. By application, the market includes pharmaceuticals, nutraceuticals, cosmetics & personal care, functional foods & beverages, and research & laboratory use. By form, the market encompasses powder and liquid extract. By sales channel, the market is divided into B2B and B2C. Regionally, the market is divided into North America, Europe, Asia Pacific, Latin America, and Middle East & Africa.
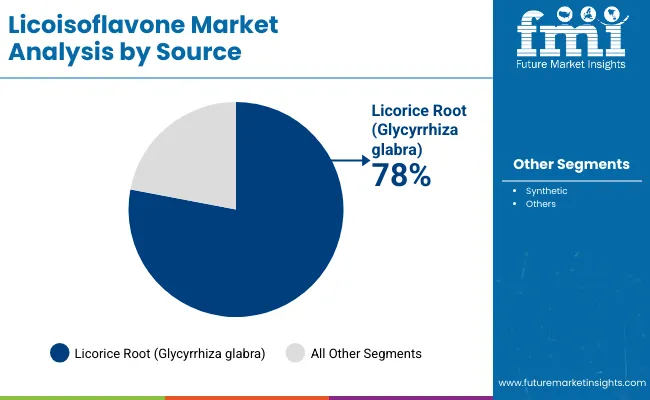
The licorice root segment represents the dominant force in the licoisoflavone market, capturing approximately 78% of total market share in 2025. This established source category encompasses solutions featuring natural extraction processes and specialized botanical applications, including high-performance bioactivity characteristics and enhanced purity profiles that enable superior therapeutic benefits and pharmaceutical outcomes across all healthcare applications. The licorice root segment's market leadership stems from its proven therapeutic capabilities, with extracts capable of addressing diverse health requirements while maintaining consistent bioactivity and processing effectiveness across all manufacturing environments.
The synthetic segment maintains a significant 22.0% market share, serving specialized applications that require consistent compound production with standardized properties for pharmaceutical formulations requiring precise dosing and regulatory compliance.
Key source advantages driving the licorice root segment include:
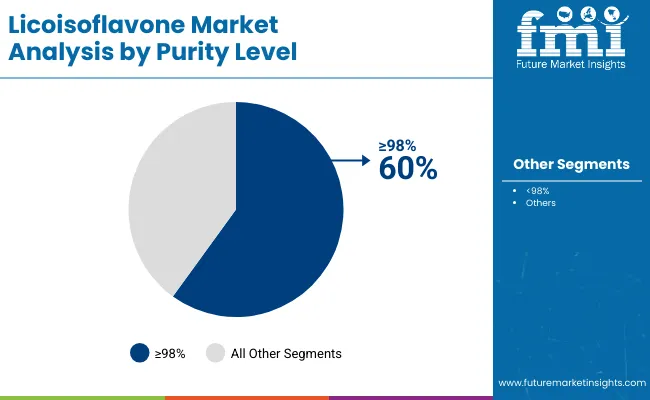
High purity applications dominate the licoisoflavone market with approximately 60% market share in 2025, reflecting the critical role of pharmaceutical-grade compounds in supporting specialized therapeutic formulations and clinical applications worldwide. The ≥98% purity segment's market leadership is reinforced by increasing pharmaceutical quality standards, regulatory compliance requirements, and rising needs for precise dosing capabilities in therapeutic applications across developed and emerging markets.
The <98% purity segment represents a substantial application category, capturing 40.0% market share through nutraceutical applications, cosmetic formulations, and functional food ingredients where moderate purity levels provide sufficient bioactivity for consumer health products.
Key market dynamics supporting purity growth include:
The market is driven by three concrete demand factors tied to healthcare outcomes. First, pharmaceutical development and natural therapeutic compound applications create increasing demand for high-quality licoisoflavone systems, with therapeutic benefit awareness growing 15-25% annually in major pharmaceutical markets worldwide, requiring comprehensive extraction infrastructure.
Second, government initiatives promoting natural medicine research and pharmaceutical innovation drive increased adoption of bioactive compounds, with many countries implementing therapeutic development programs and regulatory frameworks for natural pharmaceutical advancement by 2030. Third, technological advancements in extraction processes and compound purification enable more efficient and effective production methods that improve compound quality while reducing manufacturing costs and processing complexity.
Market restraints include complex extraction requirements and validation costs for licoisoflavone production platforms that can challenge market participants in developing compliant manufacturing capabilities, particularly in regions where regulatory pathways for bioactive compounds remain evolving and uncertain. Technical complexity of purification systems and pharmaceutical grade requirements pose another challenge, as licoisoflavone demands sophisticated extraction methods and quality controls, potentially affecting production costs and operational efficiency. Supply chain constraints from limited licorice cultivation capacity across different regions create additional operational challenges for manufacturers, demanding ongoing investment in sourcing infrastructure and quality assurance programs.
Key trends indicate accelerated adoption in European markets, particularly Germany and France, where pharmaceutical innovation and therapeutic research drive comprehensive licoisoflavone adoption. Technology integration trends toward specialized extraction systems with enhanced purity characteristics, advanced pharmaceutical applications, and integrated processing solutions enable effective manufacturing approaches that optimize production efficiency and minimize quality risks. However, the market thesis could face disruption if advances in synthetic pharmaceutical development or changes in therapeutic regulatory frameworks reduce reliance on natural bioactive compound applications.
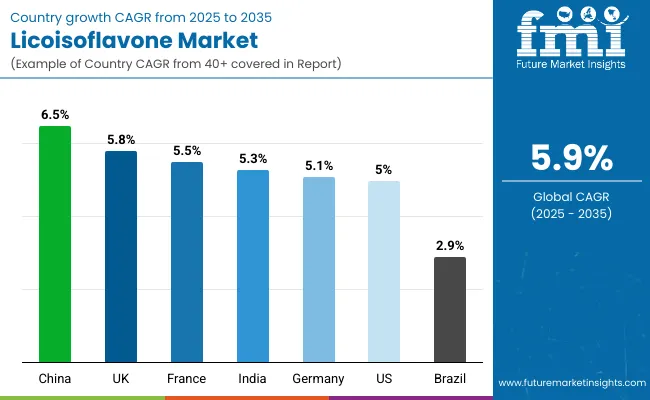
| Countries | CAGR (%) |
|---|---|
| China | 6.5 |
| UK | 5.8 |
| France | 5.5 |
| India | 5.3 |
| Germany | 5.1 |
| USA | 5.0 |
| Brazil | 2.9 |
The global licoisoflavone market is expanding steadily, with China leading at a 6.5% CAGR through 2035, driven by pharmaceutical manufacturing growth, traditional medicine integration, and advanced extraction platforms. UK follows at 5.8%, supported by pharmaceutical research and therapeutic development initiatives. France records 5.5%, reflecting established pharmaceutical infrastructure with growing integration in natural medicine applications. India advances at 5.3%, leveraging traditional medicine expertise and pharmaceutical modernization. Germany post 5.1%, focusing on pharmaceutical research and therapeutic innovation, while Brazil grows at 2.9%, emphasizing traditional herbal applications.
China demonstrates the strongest growth potential in the licoisoflavone sector, advancing at a CAGR of 6.5% through 2035, supported by its large-scale pharmaceutical manufacturing capabilities, integration of traditional Chinese medicine (TCM), and regulatory alignment promoting bioactive compound utilization. The nation’s pharmaceutical innovation hubs, Beijing, Shanghai, Guangzhou, and Shenzhen, are central to this expansion, driving large-scale adoption of licoisoflavone processing systems that enhance therapeutic efficacy and export competitiveness. The integration of bioactive compounds within TCM and modern drug formulations positions China as a global leader in bioactive research and commercialization.
The National Medical Products Administration (NMPA) plays a vital role in supporting modernization and standardization of licoisoflavone applications through comprehensive development programs. Furthermore, China’s focus on digitalization and pharmaceutical automation fosters efficiency in bioactive compound extraction and formulation processes. Collaborative efforts between universities, biotechnology firms, and healthcare providers are expanding innovation pipelines, while cross-border trade agreements enhance the country’s export capacity in pharmaceutical intermediates. Overall, China’s strong policy backing, manufacturing strength, and technological innovation collectively make it the dominant force in the global licoisoflavone ecosystem, with clear potential for sustained leadership in therapeutic bioactive integration and commercialization.
The United Kingdom demonstrates robust potential in the licoisoflavone landscape, expanding at a CAGR of 5.8% through 2035, underpinned by its excellence in pharmaceutical research, advanced biotechnology, and university-led innovation ecosystems. Prominent hubs such as London, Cambridge, Oxford, and Manchester have become epicenters for R&D projects focused on bioactive compound applications in drug discovery and therapeutic enhancement. The country’s focus on natural therapeutic solutions aligns with the growing global preference for plant-based compounds with proven efficacy and safety. British pharmaceutical firms are increasingly deploying intelligent processing systems and digital analytical tools to improve yield, purity, and therapeutic impact of licoisoflavones.
The UK government’s innovation-driven funding programs and strategic partnerships between academic institutions and biotech enterprises have accelerated pharmaceutical modernization, creating consistent demand for advanced extraction and formulation systems. Moreover, the rising influence of nutraceuticals and preventive medicine is enhancing licoisoflavone integration across both pharmaceutical and wellness sectors. With supportive regulatory pathways from the Medicines and Healthcare products Regulatory Agency (MHRA) and expanding collaborations with European research networks, the UK is positioned as a central hub for bioactive compound innovation and commercialization across Europe.
France’s licoisoflavone industry is advancing steadily, registering a CAGR of 5.5% through 2035, driven by its strong pharmaceutical base and government-backed R&D programs. The country’s commitment to advancing natural compound research is evident across key cities such as Paris, Lyon, Marseille, and Toulouse, where biotechnology firms and research institutions are conducting extensive licoisoflavone trials. National pharmaceutical modernization initiatives have promoted therapeutic diversification, creating opportunities for bioactive compounds to support next-generation drug formulations. However, French manufacturers face structural challenges, including complex extraction methodologies and cost-intensive scaling requirements, prompting collaborations with specialized international partners.
The country’s pharmaceutical programs increasingly emphasize the development of natural therapeutics to align with environmental and health sustainability goals. Growing consumer and medical interest in plant-based drug development is strengthening demand for licoisoflavone across multiple therapeutic categories, including oncology, cardiovascular health, and inflammation management. Supported by a comprehensive regulatory framework and research excellence, France continues to solidify its standing as a European hub for biopharmaceutical innovation, with an increasing focus on integrating licoisoflavone-based compounds into mainstream pharmaceutical production and clinical research applications.
India’s licoisoflavone industry exhibits substantial growth potential, expanding at a CAGR of 5.3% through 2035, supported by the convergence of traditional Ayurvedic knowledge and modern pharmaceutical advancement. The country’s leading pharmaceutical clusters, Mumbai, Hyderabad, Bangalore, and Delhi, are increasingly adopting licoisoflavone-based bioactive compounds for advanced therapeutic and nutraceutical applications. India’s traditional medicine systems provide a robust foundation for the study, extraction, and utilization of plant-based compounds, enabling strong synergy between heritage practices and contemporary biotechnology.
Indian companies are investing in intelligent extraction systems, green chemistry methods, and AI-driven quality control to enhance consistency and therapeutic efficacy. The rising global recognition of Ayurvedic products has also created export opportunities, particularly for licoisoflavone formulations in preventive and holistic medicine. Government programs such as AYUSH and national biotechnology initiatives support local research and industrial scalability, positioning India as a strategic center for bioactive compound manufacturing. As the pharmaceutical sector continues to integrate traditional medicinal knowledge with modern drug discovery, India’s leadership in licoisoflavone development reinforces its growing role in global natural therapeutic innovation.
Germany and the United States collectively showcase balanced expansion in the licoisoflavone field, each advancing at a CAGR of 5.0% through 2035, fueled by their strong pharmaceutical research infrastructures and emphasis on precision medicine. In Germany, major innovation hubs such as Bavaria, Baden-Württemberg, and North Rhine-Westphalia serve as focal points for industrial research partnerships, combining academic excellence with biopharmaceutical commercialization. Similarly, USA research hubs in California, Massachusetts, and New Jersey are leading collaborative R&D projects that integrate licoisoflavone into drug development and disease prevention frameworks.
Both nations benefit from sophisticated laboratory environments, world-class talent pools, and stringent regulatory oversight that ensures quality and safety in bioactive compound applications. The presence of advanced research funding, venture-backed biotechnology firms, and data-driven analytical systems enhances efficiency in extraction and compound characterization. As licoisoflavone becomes increasingly relevant in oncology, immunology, and anti-inflammatory treatments, these countries are expected to sustain leadership in bioactive innovation. Their shared focus on translational medicine and sustainable chemical synthesis reinforces their roles as global drivers of research-oriented growth in the pharmaceutical bioactive ecosystem.
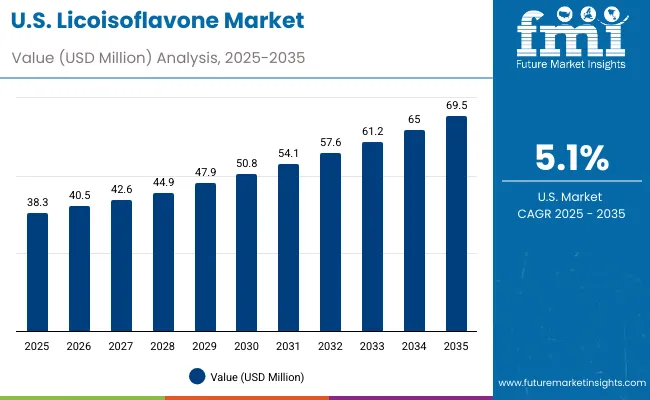
The United States exhibits strong growth in the licoisoflavone landscape, expanding at a CAGR of 5.0% through 2035, supported by its dominant pharmaceutical R&D capabilities and deep biotechnology expertise. Core research regions, including California, Massachusetts, New Jersey, and North Carolina, host leading pharmaceutical corporations and innovation clusters actively integrating licoisoflavone into therapeutic pipelines. The USA Food and Drug Administration (FDA) provides a transparent and structured regulatory framework for bioactive compound approvals, fostering a favorable environment for clinical research and commercialization.
American pharmaceutical firms are focusing on digitalized extraction, nanotechnology-based delivery systems, and biotechnological optimization to enhance licoisoflavone purity and bioavailability. Implementation challenges persist due to high extraction costs and complex regulatory documentation, but ongoing collaborations between research institutions, startups, and pharmaceutical giants mitigate these barriers. The growing shift toward plant-based therapeutics and preventive healthcare aligns well with licoisoflavone’s pharmacological potential, especially in oncology, neuroprotection, and metabolic disorders. With strong research funding, industrial scalability, and high consumer trust in natural compounds, the USA is cementing its position as a global innovation leader in bioactive pharmaceutical development.
Brazil’s licoisoflavone industry is expanding gradually at a CAGR of 2.9% through 2035, reflecting a market rooted in traditional herbal medicine and regional pharmaceutical production. The country’s therapeutic ecosystem remains heavily influenced by its cultural reliance on natural remedies, with licoisoflavone applications primarily centered around herbal formulations and basic medicinal preparations. Major regions such as São Paulo, Rio de Janeiro, and Minas Gerais maintain established networks of traditional producers catering to domestic healthcare and wellness sectors.
While the transition to industrial-scale bioactive compound production is limited, rising awareness of plant-derived therapeutics is prompting academic and governmental interest in research commercialization. Brazil’s pharmaceutical innovation programs, though nascent, aim to strengthen laboratory infrastructure and improve access to advanced extraction technologies. Strategic partnerships with global bioactive suppliers and increased emphasis on phytopharmaceutical education are expected to slowly modernize the sector. Despite moderate growth, Brazil’s long-standing herbal medicine culture and biodiversity richness form a foundational base for future expansion in licoisoflavone-based therapeutics and bioactive compound manufacturing.
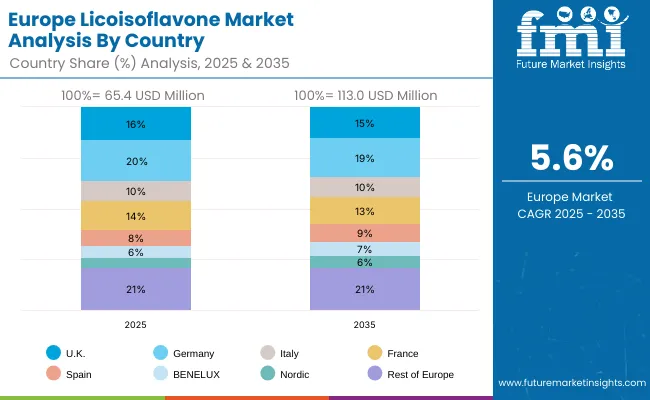
The licoisoflavone market in Europe is projected to grow from USD 65.4 million in 2025 to USD 113.0 million by 2035, registering a CAGR of 5.6% over the forecast period. Germany is expected to maintain its leadership position with a 20.0% market share in 2025, projected to reach 19.0% by 2035, supported by its extensive pharmaceutical infrastructure, advanced research facilities, and comprehensive biotechnology networks serving major European markets.
United Kingdom follows with a 16.0% share in 2025, projected to reach 15.0% by 2035, driven by comprehensive pharmaceutical research programs in major biotechnology regions implementing advanced licoisoflavone systems. France holds a 14.0% share in 2025, expected to reach 13.0% by 2035 through the ongoing development of pharmaceutical facilities and research networks. Italy commands a 10.0% share, maintaining 10.0% through traditional pharmaceutical applications, while Spain accounts for 8.0% in 2025, expected to reach 9.0% by 2035. BENELUX captures 6.0% market share, projected to reach 7.0%, while Nordic countries account for 5.0%, expected to reach 6.0% by 2035. The Rest of Europe region maintains a 21.0% share throughout the forecast period, attributed to increasing licoisoflavone adoption in Eastern European pharmaceutical facilities implementing research programs.
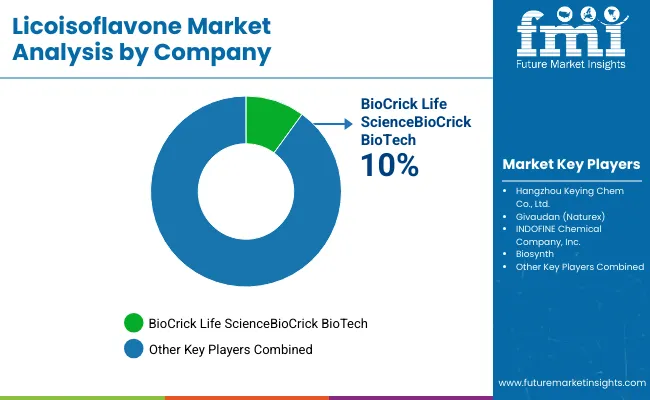
The licoisoflavone market features approximately 15-20 meaningful players with moderate concentration, where the top three companies control roughly 30-40% of global market share through established extraction portfolios and extensive pharmaceutical industry relationships. Competition centers on compound purity, extraction technology, and technical expertise rather than price competition alone.
Market leaders include BioCrick Life Science with a 10.0% market share, Hangzhou Keying Chem Co., Ltd., and Givaudan (Naturex), which maintain competitive advantages through comprehensive licoisoflavone portfolios, advanced extraction capabilities, and deep expertise in the pharmaceutical and nutraceutical sectors, creating high switching costs for customers. These companies leverage established pharmaceutical industry relationships and ongoing research partnerships to defend market positions while expanding into adjacent therapeutic and cosmetic applications.
Challengers encompass INDOFINE Chemical and Biosynth, which compete through specialized extraction technologies and strong presence in key pharmaceutical markets. Chemical specialists focus on specific licoisoflavone applications or vertical markets, offering differentiated capabilities in pharmaceutical synthesis, research applications, and application-specific purification.
Regional players and emerging licoisoflavone companies create competitive pressure through innovative extraction approaches and rapid development capabilities, particularly in high-growth markets including China and India, where local presence provides advantages in cost optimization and regulatory compliance. Market dynamics favor companies that combine advanced extraction technologies with comprehensive pharmaceutical services that address the complete product lifecycle from compound production through ongoing performance assurance and technical support.
Licoisoflavone solutions represent a critical bioactive ingredient that enables pharmaceutical companies, nutraceutical firms, and cosmetic manufacturers to enhance product efficacy and therapeutic outcomes without substantial ongoing compound investment, typically providing 40-60% performance enhancement compared to conventional alternatives while ensuring unprecedented bioactivity and regulatory compliance.
With the market projected to grow from USD 210.2 million in 2025 to USD 374.1 million by 2035 at a 5.9% CAGR, these solutions offer compelling advantages - superior bioactivity, enhanced therapeutic effects, and pharmaceutical capabilities - making them essential for pharmaceuticals applications (35.0% market share), nutraceuticals operations (25.0% share), and diverse therapeutic applications seeking reliable bioactive compound solutions. Scaling market penetration and extraction capabilities requires coordinated action across healthcare policy, pharmaceutical standards, licoisoflavone providers, pharmaceutical companies, and research institutions.
| Items | Values |
|---|---|
| Quantitative Units (2025) | USD 210.2 Million |
| Source | Licorice Root (Glycyrrhiza glabra), Synthetic |
| Purity | ≥98%, <98% |
| Application | Pharmaceuticals, Nutraceuticals, Cosmetics & Personal Care, Functional Foods & Beverages, Research & Laboratory Use |
| Form | Powder, Liquid Extract |
| Sales Channel | B2B (ingredient supply), B2C (finished goods: online retail, health stores) |
| Regions Covered | North America, Europe, Asia Pacific, Latin America, Middle East & Africa |
| Countries Covered | China, India, Germany, France, UK, USA, Brazil, South Korea, Japan, and 40+ countries |
| Key Companies Profiled | BioCrick Life Science, Hangzhou Keying Chem Co., Ltd., Givaudan (Naturex), INDOFINE Chemical Company, Inc., Biosynth |
| Additional Attributes | Dollar sales by source and purity categories, regional adoption trends across Europe, Asia Pacific, and North America, competitive landscape with licoisoflavone providers and pharmaceutical companies, extraction facility requirements and specifications, integration with pharmaceutical initiatives and nutraceutical platforms. |
The global licoisoflavone market is estimated to be valued at USD 210.2 million in 2025.
The market size for the licoisoflavone market is projected to reach USD 374.1 million by 2035.
The licoisoflavone market is expected to grow at a 5.9% CAGR between 2025 and 2035.
The key product types in the licoisoflavone market are licorice root (Glycyrrhiza glabra) and synthetic licoisoflavone.


Our Research Products

The "Full Research Suite" delivers actionable market intel, deep dives on markets or technologies, so clients act faster, cut risk, and unlock growth.

The Leaderboard benchmarks and ranks top vendors, classifying them as Established Leaders, Leading Challengers, or Disruptors & Challengers.

Locates where complements amplify value and substitutes erode it, forecasting net impact by horizon

We deliver granular, decision-grade intel: market sizing, 5-year forecasts, pricing, adoption, usage, revenue, and operational KPIs—plus competitor tracking, regulation, and value chains—across 60 countries broadly.

Spot the shifts before they hit your P&L. We track inflection points, adoption curves, pricing moves, and ecosystem plays to show where demand is heading, why it is changing, and what to do next across high-growth markets and disruptive tech

Real-time reads of user behavior. We track shifting priorities, perceptions of today’s and next-gen services, and provider experience, then pace how fast tech moves from trial to adoption, blending buyer, consumer, and channel inputs with social signals (#WhySwitch, #UX).

Partner with our analyst team to build a custom report designed around your business priorities. From analysing market trends to assessing competitors or crafting bespoke datasets, we tailor insights to your needs.
Supplier Intelligence
Discovery & Profiling
Capacity & Footprint
Performance & Risk
Compliance & Governance
Commercial Readiness
Who Supplies Whom
Scorecards & Shortlists
Playbooks & Docs
Category Intelligence
Definition & Scope
Demand & Use Cases
Cost Drivers
Market Structure
Supply Chain Map
Trade & Policy
Operating Norms
Deliverables
Buyer Intelligence
Account Basics
Spend & Scope
Procurement Model
Vendor Requirements
Terms & Policies
Entry Strategy
Pain Points & Triggers
Outputs
Pricing Analysis
Benchmarks
Trends
Should-Cost
Indexation
Landed Cost
Commercial Terms
Deliverables
Brand Analysis
Positioning & Value Prop
Share & Presence
Customer Evidence
Go-to-Market
Digital & Reputation
Compliance & Trust
KPIs & Gaps
Outputs
Full Research Suite comprises of:
Market outlook & trends analysis
Interviews & case studies
Strategic recommendations
Vendor profiles & capabilities analysis
5-year forecasts
8 regions and 60+ country-level data splits
Market segment data splits
12 months of continuous data updates
DELIVERED AS:
PDF EXCEL ONLINE

Thank you!
You will receive an email from our Business Development Manager. Please be sure to check your SPAM/JUNK folder too.
Chat With
MaRIA