Nucleotide Market Size and Share Forecast Outlook 2025 to 2035

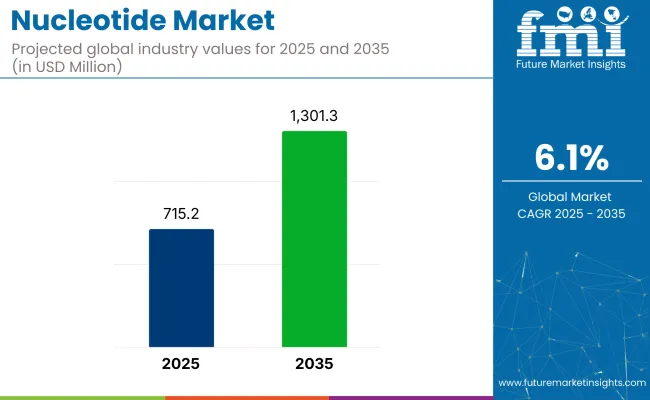
The global nucleotide market is valued at USD 715.2 million in 2025 and is expected to reach USD 1,301.3 million by 2035, reflecting a compound annual growth rate (CAGR) of 6.1%.
Quick Stats - Nucleotide Market

  • Market Value (2025): USD 715.2 million
  • Forecast Value (2035): USD 1,301.3 million
  • Forecast CAGR: 6.1%
  • Leading Technology in 2025: TaqMan Allelic Discrimination (46.8% Market Share)
  • Top Application Segment: Pharmaceuticals (62.6% Market Share)
  • Key Growth Region: Asia Pacific (fastest-growing market in Japan with 7.1% CAGR)

Nucleotide Market

Metric Value
Estimated Size (2025) USD 715.2 million
Projected Value (2035) USD 1,301.3 million
CAGR (2025 to 2035) 6.1%

This growth is attributed to the increasing applications of nucleotides in the pharmaceutical, diagnostics, and food sectors. Technological advancements in nucleotide synthesis and extraction methods are expected to further reduce production costs, making these vital molecules more accessible. The demand for personalized medicine, coupled with advancements in genomics, will continue to drive the market.

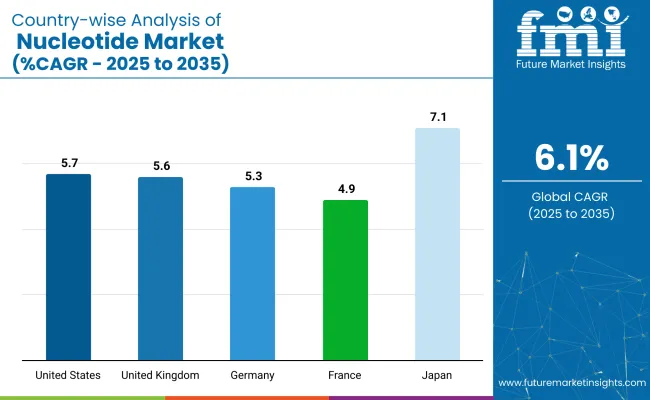
In 2025, the nucleotide market is expected to be predominantly driven by diagnostics research, with this application segment holding a 62.6% share. On the other hand, TaqMan Allelic Discrimination technology accounts for 46.8% market Share in 2025. The USA will remain the largest market, supported by its robust pharmaceutical and research industries, and is anticipated to grow at a CAGR of 5.7%. Meanwhile, Japan and the UK closely follow this growth with significant CAGRs of 7.1% and 5.6% respectively.

The nucleotide market represents a niche but increasingly significant share within its parent markets. It is estimated to account for approximately 3-4% of the global biotechnology market, due to its role in genetic research and synthesis. Within the pharmaceutical ingredients market, it holds around 2%, largely driven by its use in antiviral and cancer therapies.

In the functional food ingredients and animal feed additives segments, it constitutes nearly 1.5%-2% each, as applications continue expanding. In the genomics and molecular diagnostics markets, its share is higher, estimated at 5-6%, due to its critical role in assay development and personalized medicine.

Looking ahead, the market is expected to witness continued innovations, particularly in the synthesis of nucleotides. The integration of next-generation sequencing technologies and advancements in genomics will further fuel the growth of the nucleotide industry. Companies are also likely to expand their operations through strategic partnerships and acquisitions, particularly in high-growth regions like Asia-Pacific and Latin America. These efforts will help meet the rising global demand for high-quality nucleotides in both human and veterinary healthcare, as well as in food technology applications.

Analyzing Nucleotide Market by Top Investment Segments

The global nucleotide market is segmented into application, technology and region. By application, it includes pharmaceuticals, diagnostics research, food & beverage additives, animal feed additives, and others (including cosmetics, nutraceuticals, and clinical nutrition).

By technology, it is segmented into Taqman allelic discrimination, gene chips & microarrays, SNP by pyrosequencing, and others (such as real-time PCR probes, sequencing-by-synthesis methods, and multiplex ligation techniques). By region, it covers North America, Latin America, Western Europe, Eastern Europe, East Asia, South Asia, the Pacific, the Middle East, and Africa.

By Application, the Pharmaceuticals Segment Accounts for 62.6% Market Share

The pharmaceuticals segment dominates the global nucleotide market, holding 62.6% of the market share in 2025 due to the increasing use of nucleotides in drug development, particularly for antiviral and cancer treatments. Diagnostics Research follows as a close second, driven by the need for more efficient molecular diagnostic techniques. Animal Feed Additive is emerging as a lucrative segment, with rising demand for enhanced livestock health.
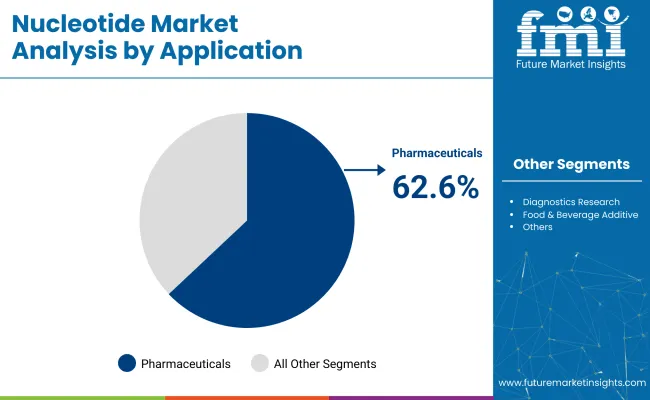
  • Pharmaceuticals lead with the highest market share.
  • Diagnostics Research is expected to maintain substantial growth.
  • Rising interest in Animal Feed Additives is driven by protein demand.
  • Others encompass emerging sectors with niche applications.

Nucleotide Market Analysis By Application

By Technology, TaqMan Allelic Discrimination accounts for 46.8% of the Market Share

TaqMan Allelic Discrimination leads the technology segment with 46.8% market share in 2025, owing to its widespread use in gene sequencing and diagnostics. Gene Chips & Microarrays are also significant and are used extensively in genomic research. SNP by Pyrosequencing is gaining traction for its high accuracy in detecting genetic variations, particularly in personalized medicine.
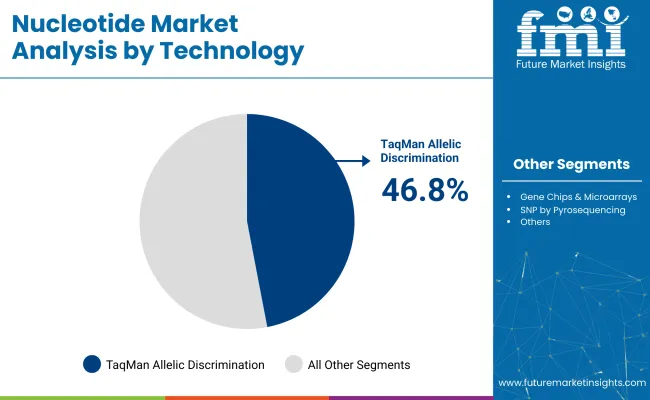
  • TaqMan Allelic Discrimination remains the most lucrative technology.
  • Gene Chips & Microarrays cater to broad research needs.
  • SNP by Pyrosequencing is gaining adoption in genetic studies.
  • Others include technologies with more specialized applications.

Nucleotide Market Analysis By Technology

Top Nucleotide Market Dynamics

Recent Trends in the Nucleotide Market

  • Increasing use of nucleotides in personalized medicine and genomic research.
  • Technological advancements in nucleotide synthesis making production more cost-effective.
  • Rising demand for nucleotides in animal feed additives to enhance livestock health.
  • Expansion of nucleotide applications in the food and beverage sector for flavor enhancement.

Challenges in the Nucleotide Market

  • High production costs in certain nucleotide synthesis methods.
  • Regulatory hurdles in the pharmaceutical industry are limiting faster adoption.
  • Price sensitivity in emerging markets is restricting growth potential.
  • Limited awareness and adoption of advanced nucleotide technologies in developing regions.

Analyzing Top Countries Producing and Supplying the Nucleotide

Nucleotide Market Country Wise Analysis

Among the top five countries in the nucleotide market, Japan is projected to witness the fastest growth, with a CAGR of 7.1% from 2025 to 2035, driven by its leadership in genomic research and strong biotech investments. The USA follows with a CAGR of 5.7%, supported by its robust pharmaceutical infrastructure and personalized medicine initiatives. The UK and Germany show stable expansion at 5.6% and 5.3%, respectively, due to advanced diagnostics and healthcare systems. France, while growing more slowly at 4.9%, remains a significant market due to rising R&D in molecular diagnostics and genomics.

The report covers an in-depth analysis of 40+ countries; five top-performing OECD countries are highlighted below.

USA Nucleotide Market Analysis

The USA nucleotide revenue is projected to grow at a CAGR of 5.7% from 2025 to 2035. The USA remains the largest market for nucleotides, driven by its leading pharmaceutical and biotechnology industries. Major advancements in genomic research, diagnostics, and drug development support the demand for nucleotides. The strong presence of multinational pharmaceutical companies and a well-established healthcare system further boost market expansion. Additionally, the rising focus on personalized medicine and growing healthcare expenditures ensure sustained growth in the market.

  • Strong pharmaceutical and biotechnology industries.
  • High demand for nucleotides in genomic and drug research.
  • Growing investments in personalized medicine.

Nucleotide Demand Analysis in the UK

The revenue from nucleotides in the UK is expected to grow at a CAGR of 5.6% from 2025 to 2035. The country benefits from its well-established pharmaceutical sector and high investments in biomedical research. The UK also plays a significant role in diagnostics, with a rising demand for advanced molecular diagnostic tools. The healthcare sector's focus on improving disease detection methods drives further adoption of nucleotides, especially in genetic research and drug development.

  • Well-established pharmaceutical sector with significant R&D investments.
  • Strong demand for advanced diagnostics technologies.
  • Government initiatives promoting biomedical research.

Nucleotide Demand Analysis in Germany

The nucleotide market in Germany is forecasted to grow at a CAGR of 5.3% from 2025 to 2035. As one of the leading pharmaceutical hubs in Europe, Germany has a strong market for nucleotides, especially in diagnostics and therapeutic applications. The nation's commitment to advancing biomedical research, combined with its highly efficient healthcare infrastructure, ensures the ongoing demand for nucleotides. Furthermore, Germany’s support for innovation and biotechnology is expected to foster continued market growth.

  • Leading pharmaceutical and biotechnology sectors.
  • High adoption of nucleotides in diagnostics and therapeutics.
  • Focus on healthcare innovation and technology.

France Nucleotide Demand Analysis

The sales of nucleotides in France are projected to grow at a CAGR of 4.9% from 2025 to 2035. France has a growing pharmaceutical and biotechnology sector, with increasing investments in research and development. The demand for nucleotides is driven by their application in molecular diagnostics and therapeutic research. Furthermore, France's increasing focus on personalized medicine and genomic research, supported by robust healthcare funding, is propelling the nucleotide market forward.

  • Strong pharmaceutical R&D presence in the country.
  • Growing investments in molecular diagnostics.
  • Increasing adoption of personalized medicine.

Nucleotide Market Analysis in Japan

The revenue from the nucleotide in Japan is expected to grow at a CAGR of 7.1% from 2025 to 2035. Japan has become a leader in advanced genomic research, driving the demand for high-quality nucleotides. The country's pharmaceutical and biotechnology industries are investing heavily in new technologies, creating a strong market for nucleotides. Additionally, the aging population is driving the demand for personalized healthcare solutions, further boosting the market for nucleotides used in drug development and diagnostics.

  • Leading market for genomic research and innovation.
  • Strong investments in the pharmaceutical and biotech industries.
  • Rising demand for personalized healthcare solutions.

Leading Nucleotide Market Suppliers

The market is moderately consolidated, with a few global leaders accounting for a significant share of revenues. Top companies like ThermoFisher Scientific Inc., F. Hoffmann-La Roche Ltd., Agilent Technologies Inc., DSM Nutritional Products Ltd., and Nanjing Bio Together Co., Ltd. are competing based on technological innovation, strategic partnerships, and geographical expansion. These companies focus on developing cutting-edge products in genomics, diagnostics, and therapeutics, using pricing strategies, new product launches, and global collaborations to strengthen their market positions.

These leading companies are heavily investing in R&D to introduce advanced nucleotide solutions and improve production efficiency. Pricing competition remains tight, with firms offering cost-effective products to penetrate emerging markets. Many of these companies also collaborate with research institutions and pharmaceutical firms to further their reach, improve product offerings, and drive demand for nucleotides in diagnostics, personalized medicine, and therapeutics.

Recent Nucleotide Industry News

In February 2025, Thermo Fisher Scientific announced to acquire Solventum’s Purification and Filtration Business to boost its position.

Nucleotide Market Report Scope

Report Attributes Details
Current Total Market Size (2025) USD 715.2 million
Projected Market Size (2035) USD 1,301.3 million
CAGR (2025 to 2035) 6.1%
Base Year for Estimation 2024
Historical Period 2020 to 2024
Projections Period 2025 to 2035
Market Analysis Parameters Revenue in USD millions/Volume in Kilotons
By Application Pharmaceuticals, Diagnostics Research, Food & Beverage Additive, Animal Feed Additive, Others
By Technology TaqMan Allelic Discrimination, Gene Chips & Microarrays, SNP by Pyrosequencing, Others
Regions Covered North America, Latin America, Western Europe, Eastern Europe, East Asia, South Asia, Pacific, Middle East and Africa
Countries Covered United States, Canada, United Kingdom, Germany, France, China, Japan, South Korea, Brazil, Australia
Key Players Nanjing Bio Together Co., Ltd., Affymetrix Inc., DSM Nutritional Products Ltd., F. Hoffmann-La Roche Ltd., ThermoFisher Scientific Inc., CJ CheilJedang Corporation, Agilent Technologies Inc., PR Omega Corporation, Biorigin, Ohly GmbH, Star Lake Bioscience Co., NuEra Nutrition, Lallemand Inc.
Additional Attributes Dollar sales by value, market share analysis by region, and country-wise analysis

Key Segments of the Report

By Application:

As per application, the industry has been categorized into Pharmaceuticals, Food & Beverage Additives, Diagnostics Research, Animal Feed Additives, and Others.

By Technology:

This segment is further categorized into TaqMan allelic discrimination, Gene chips & microarrays, SNP by pyrosequencing, and Others.

By Region:

Industry analysis has been carried out in key countries of North America, Latin America, Europe, East Asia, South Asia, Oceania, and the Middle East & Africa.

Table of Content

  1. Executive Summary
    • Global Market Outlook
    • Demand-side Trends
    • Supply-side Trends
    • Technology Roadmap Analysis
    • Analysis and Recommendations
  2. Market Overview
    • Market Coverage / Taxonomy
    • Market Definition / Scope / Limitations
  3. Market Background
    • Market Dynamics
      • Drivers
      • Restraints
      • Opportunity
      • Trends
    • Scenario Forecast
      • Demand in Optimistic Scenario
      • Demand in Likely Scenario
      • Demand in Conservative Scenario
    • Opportunity Map Analysis
    • Product Life Cycle Analysis
    • Supply Chain Analysis
      • Supply Side Participants and their Roles
        • Producers
        • Mid-Level Participants (Traders/ Agents/ Brokers)
        • Wholesalers and Distributors
      • Value Added and Value Created at Node in the Supply Chain
      • List of Raw Material Suppliers
      • List of Existing and Potential Buyer’s
    • Investment Feasibility Matrix
    • Value Chain Analysis
      • Profit Margin Analysis
      • Wholesalers and Distributors
      • Retailers
    • PESTLE and Porter’s Analysis
    • Regulatory Landscape
      • By Key Regions
      • By Key Countries
    • Regional Parent Market Outlook
    • Production and Consumption Statistics
    • Import and Export Statistics
  4. Global Market Analysis 2020 to 2024 and Forecast, 2025 to 2035
    • Historical Market Size Value (USD Million) & Volume (Kilotons) Analysis, 2020 to 2024
    • Current and Future Market Size Value (USD Million) & Volume (Kilotons) Projections, 2025 to 2035
      • Y-o-Y Growth Trend Analysis
      • Absolute $ Opportunity Analysis
  5. Global Market Pricing Analysis 2020 to 2024 and Forecast 2025 to 2035
  6. Global Market Analysis 2020 to 2024 and Forecast 2025 to 2035, By Application
    • Introduction / Key Findings
    • Historical Market Size Value (USD Million) & Volume (Kilotons) Analysis By Application, 2020 to 2024
    • Current and Future Market Size Value (USD Million) & Volume (Kilotons) Analysis and Forecast By Application, 2025 to 2035
      • Pharmaceuticals
      • Diagnostics Research
      • Food & Beverage Additive
      • Animal Feed Additive
      • Others
    • Y-o-Y Growth Trend Analysis By Application, 2020 to 2024
    • Absolute $ Opportunity Analysis By Application, 2025 to 2035
  7. Global Market Analysis 2020 to 2024 and Forecast 2025 to 2035, By Technology
    • Introduction / Key Findings
    • Historical Market Size Value (USD Million) & Volume (Kilotons) Analysis By Technology, 2020 to 2024
    • Current and Future Market Size Value (USD Million) & Volume (Kilotons) Analysis and Forecast By Technology, 2025 to 2035
      • TaqMan allelic discrimination
      • Gene chips & microarrays
      • SNP by pyrosequencing
      • Others
    • Y-o-Y Growth Trend Analysis By Technology, 2020 to 2024
    • Absolute $ Opportunity Analysis By Technology, 2025 to 2035
  8. Global Market Analysis 2020 to 2024 and Forecast 2025 to 2035, By Region
    • Introduction
    • Historical Market Size Value (USD Million) & Volume (Kilotons) Analysis By Region, 2020 to 2024
    • Current Market Size Value (USD Million) & Volume (Kilotons) Analysis and Forecast By Region, 2025 to 2035
      • North America
      • Latin America
      • Western Europe
      • Eastern Europe
      • East Asia
      • South Asia & Pacific
      • Middle East and Africa
    • Market Attractiveness Analysis By Region
  9. North America Market Analysis 2020 to 2024 and Forecast 2025 to 2035, By Country
    • Historical Market Size Value (USD Million) & Volume (Kilotons) Trend Analysis By Market Taxonomy, 2020 to 2024
    • Market Size Value (USD Million) & Volume (Kilotons) Forecast By Market Taxonomy, 2025 to 2035
      • By Country
        • USA
        • Canada
        • Mexico
      • By Application
      • By Technology
    • Market Attractiveness Analysis
      • By Country
      • By Application
      • By Technology
    • Key Takeaways
  10. Latin America Market Analysis 2020 to 2024 and Forecast 2025 to 2035, By Country
    • Historical Market Size Value (USD Million) & Volume (Kilotons) Trend Analysis By Market Taxonomy, 2020 to 2024
    • Market Size Value (USD Million) & Volume (Kilotons) Forecast By Market Taxonomy, 2025 to 2035
      • By Country
        • Brazil
        • Argentina
        • Rest of LATAM
      • By Application
      • By Technology
    • Market Attractiveness Analysis
      • By Country
      • By Application
      • By Technology
    • Key Takeaways
  11. Western Europe Market Analysis 2020 to 2024 and Forecast 2025 to 2035, By Country
    • Historical Market Size Value (USD Million) & Volume (Kilotons) Trend Analysis By Market Taxonomy, 2020 to 2024
    • Market Size Value (USD Million) & Volume (Kilotons) Forecast By Market Taxonomy, 2025 to 2035
      • By Country
        • Germany
        • Italy
        • France
        • UK
        • Spain
        • BENELUX
        • Nordic
        • Rest of W.Europe
      • By Application
      • By Technology
    • Market Attractiveness Analysis
      • By Country
      • By Application
      • By Technology
    • Key Takeaways
  12. Eastern Europe Market Analysis 2020 to 2024 and Forecast 2025 to 2035, By Country
    • Historical Market Size Value (USD Million) & Volume (Kilotons) Trend Analysis By Market Taxonomy, 2020 to 2024
    • Market Size Value (USD Million) & Volume (Kilotons) Forecast By Market Taxonomy, 2025 to 2035
      • By Country
        • Russia
        • Hungary
        • Poland
        • Balkan & Baltics
        • Rest of E. Europe
      • By Application
      • By Technology
    • Market Attractiveness Analysis
      • By Country
      • By Application
      • By Technology
    • Key Takeaways
  13. East Asia Market Analysis 2020 to 2024 and Forecast 2025 to 2035, By Country
    • Historical Market Size Value (USD Million) & Volume (Kilotons) Trend Analysis By Market Taxonomy, 2020 to 2024
    • Market Size Value (USD Million) & Volume (Kilotons) Forecast By Market Taxonomy, 2025 to 2035
      • By Country
        • China
        • Japan
        • South Korea
      • By Application
      • By Technology
    • Market Attractiveness Analysis
      • By Country
      • By Application
      • By Technology
    • Key Takeaways
  14. South Asia & Pacific Market Analysis 2020 to 2024 and Forecast 2025 to 2035, By Country
    • Historical Market Size Value (USD Million) & Volume (Kilotons) Trend Analysis By Market Taxonomy, 2020 to 2024
    • Market Size Value (USD Million) & Volume (Kilotons) Forecast By Market Taxonomy, 2025 to 2035
      • By Country
        • India
        • Australia & New Zealand
        • ASEAN
        • Rest of SAP
      • By Application
      • By Technology
    • Market Attractiveness Analysis
      • By Country
      • By Application
      • By Technology
    • Key Takeaways
  15. Middle East and Africa Market Analysis 2020 to 2024 and Forecast 2025 to 2035, By Country
    • Historical Market Size Value (USD Million) & Volume (Kilotons) Trend Analysis By Market Taxonomy, 2020 to 2024
    • Market Size Value (USD Million) & Volume (Kilotons) Forecast By Market Taxonomy, 2025 to 2035
      • By Country
        • GCC Countries
        • Northern Africa
        • South Africa
        • Turkiye
        • Rest of MEA
      • By Application
      • By Technology
    • Market Attractiveness Analysis
      • By Country
      • By Application
      • By Technology
    • Key Takeaways
  16. Key Countries Market Analysis
    • USA
      • Pricing Analysis
      • Market Share Analysis, 2024
        • By Application
        • By Technology
    • Canada
      • Pricing Analysis
      • Market Share Analysis, 2024
        • By Application
        • By Technology
    • Brazil
      • Pricing Analysis
      • Market Share Analysis, 2024
        • By Application
        • By Technology
    • Mexico
      • Pricing Analysis
      • Market Share Analysis, 2024
        • By Application
        • By Technology
    • Argentina
      • Pricing Analysis
      • Market Share Analysis, 2024
        • By Application
        • By Technology
  17. Market Structure Analysis
    • Competition Dashboard
    • Competition Benchmarking
    • Market Share Analysis of Top Players
      • By Regional
      • By Application
      • By Technology
  18. Competition Analysis
    • Competition Deep Dive
      • Nanjing Bio Together Co., Ltd.
        • Overview
        • Product Portfolio
        • Profitability by Market Segments (Product/Age /Sales Channel/Region)
        • Sales Footprint
        • Strategy Overview
          • Marketing Strategy
          • Product Strategy
          • Channel Strategy
      • Affymetrix Inc.
        • Overview
        • Product Portfolio
        • Profitability by Market Segments (Product/Age /Sales Channel/Region)
        • Sales Footprint
        • Strategy Overview
          • Marketing Strategy
          • Product Strategy
          • Channel Strategy
      • DSM Nutritional Products Ltd.
        • Overview
        • Product Portfolio
        • Profitability by Market Segments (Product/Age /Sales Channel/Region)
        • Sales Footprint
        • Strategy Overview
          • Marketing Strategy
          • Product Strategy
          • Channel Strategy
      • F. Hoffmann-La Roche Ltd.
        • Overview
        • Product Portfolio
        • Profitability by Market Segments (Product/Age /Sales Channel/Region)
        • Sales Footprint
        • Strategy Overview
          • Marketing Strategy
          • Product Strategy
          • Channel Strategy
      • ThermoFisher Scientific Inc.
        • Overview
        • Product Portfolio
        • Profitability by Market Segments (Product/Age /Sales Channel/Region)
        • Sales Footprint
        • Strategy Overview
          • Marketing Strategy
          • Product Strategy
          • Channel Strategy
      • CJ CheilJedang Corporation
        • Overview
        • Product Portfolio
        • Profitability by Market Segments (Product/Age /Sales Channel/Region)
        • Sales Footprint
        • Strategy Overview
          • Marketing Strategy
          • Product Strategy
          • Channel Strategy
      • Agilent Technologies Inc.
        • Overview
        • Product Portfolio
        • Profitability by Market Segments (Product/Age /Sales Channel/Region)
        • Sales Footprint
        • Strategy Overview
          • Marketing Strategy
          • Product Strategy
          • Channel Strategy
      • PR omega Corporation
        • Overview
        • Product Portfolio
        • Profitability by Market Segments (Product/Age /Sales Channel/Region)
        • Sales Footprint
        • Strategy Overview
          • Marketing Strategy
          • Product Strategy
          • Channel Strategy
      • Biorigin
        • Overview
        • Product Portfolio
        • Profitability by Market Segments (Product/Age /Sales Channel/Region)
        • Sales Footprint
        • Strategy Overview
          • Marketing Strategy
          • Product Strategy
          • Channel Strategy
      • Ohly GmbH
        • Overview
        • Product Portfolio
        • Profitability by Market Segments (Product/Age /Sales Channel/Region)
        • Sales Footprint
        • Strategy Overview
          • Marketing Strategy
          • Product Strategy
          • Channel Strategy
      • Star Lake Bioscience Co.
        • Overview
        • Product Portfolio
        • Profitability by Market Segments (Product/Age /Sales Channel/Region)
        • Sales Footprint
        • Strategy Overview
          • Marketing Strategy
          • Product Strategy
          • Channel Strategy
      • NuEra Nutrition
        • Overview
        • Product Portfolio
        • Profitability by Market Segments (Product/Age /Sales Channel/Region)
        • Sales Footprint
        • Strategy Overview
          • Marketing Strategy
          • Product Strategy
          • Channel Strategy
      • Lallemand Inc.
        • Overview
        • Product Portfolio
        • Profitability by Market Segments (Product/Age /Sales Channel/Region)
        • Sales Footprint
        • Strategy Overview
          • Marketing Strategy
          • Product Strategy
          • Channel Strategy
  19. Assumptions & Acronyms Used
  20. Research Methodology

List of Tables

  • Table 1: Global Market Value (USD Million) Forecast by Region, 2020 to 2035
  • Table 2: Global Market Volume (Kilotons) Forecast by Region, 2020 to 2035
  • Table 3: Global Market Value (USD Million) Forecast by Application, 2020 to 2035
  • Table 4: Global Market Volume (Kilotons) Forecast by Application, 2020 to 2035
  • Table 5: Global Market Value (USD Million) Forecast by Technology, 2020 to 2035
  • Table 6: Global Market Volume (Kilotons) Forecast by Technology, 2020 to 2035
  • Table 7: North America Market Value (USD Million) Forecast by Country, 2020 to 2035
  • Table 8: North America Market Volume (Kilotons) Forecast by Country, 2020 to 2035
  • Table 9: North America Market Value (USD Million) Forecast by Application, 2020 to 2035
  • Table 10: North America Market Volume (Kilotons) Forecast by Application, 2020 to 2035
  • Table 11: North America Market Value (USD Million) Forecast by Technology, 2020 to 2035
  • Table 12: North America Market Volume (Kilotons) Forecast by Technology, 2020 to 2035
  • Table 13: Latin America Market Value (USD Million) Forecast by Country, 2020 to 2035
  • Table 14: Latin America Market Volume (Kilotons) Forecast by Country, 2020 to 2035
  • Table 15: Latin America Market Value (USD Million) Forecast by Application, 2020 to 2035
  • Table 16: Latin America Market Volume (Kilotons) Forecast by Application, 2020 to 2035
  • Table 17: Latin America Market Value (USD Million) Forecast by Technology, 2020 to 2035
  • Table 18: Latin America Market Volume (Kilotons) Forecast by Technology, 2020 to 2035
  • Table 19: Western Europe Market Value (USD Million) Forecast by Country, 2020 to 2035
  • Table 20: Western Europe Market Volume (Kilotons) Forecast by Country, 2020 to 2035
  • Table 21: Western Europe Market Value (USD Million) Forecast by Application, 2020 to 2035
  • Table 22: Western Europe Market Volume (Kilotons) Forecast by Application, 2020 to 2035
  • Table 23: Western Europe Market Value (USD Million) Forecast by Technology, 2020 to 2035
  • Table 24: Western Europe Market Volume (Kilotons) Forecast by Technology, 2020 to 2035
  • Table 25: Eastern Europe Market Value (USD Million) Forecast by Country, 2020 to 2035
  • Table 26: Eastern Europe Market Volume (Kilotons) Forecast by Country, 2020 to 2035
  • Table 27: Eastern Europe Market Value (USD Million) Forecast by Application, 2020 to 2035
  • Table 28: Eastern Europe Market Volume (Kilotons) Forecast by Application, 2020 to 2035
  • Table 29: Eastern Europe Market Value (USD Million) Forecast by Technology, 2020 to 2035
  • Table 30: Eastern Europe Market Volume (Kilotons) Forecast by Technology, 2020 to 2035
  • Table 31: East Asia Market Value (USD Million) Forecast by Country, 2020 to 2035
  • Table 32: East Asia Market Volume (Kilotons) Forecast by Country, 2020 to 2035
  • Table 33: East Asia Market Value (USD Million) Forecast by Application, 2020 to 2035
  • Table 34: East Asia Market Volume (Kilotons) Forecast by Application, 2020 to 2035
  • Table 35: East Asia Market Value (USD Million) Forecast by Technology, 2020 to 2035
  • Table 36: East Asia Market Volume (Kilotons) Forecast by Technology, 2020 to 2035
  • Table 37: South Asia & Pacific Market Value (USD Million) Forecast by Country, 2020 to 2035
  • Table 38: South Asia & Pacific Market Volume (Kilotons) Forecast by Country, 2020 to 2035
  • Table 39: South Asia & Pacific Market Value (USD Million) Forecast by Application, 2020 to 2035
  • Table 40: South Asia & Pacific Market Volume (Kilotons) Forecast by Application, 2020 to 2035
  • Table 41: South Asia & Pacific Market Value (USD Million) Forecast by Technology, 2020 to 2035
  • Table 42: South Asia & Pacific Market Volume (Kilotons) Forecast by Technology, 2020 to 2035
  • Table 43: Middle East and Africa Market Value (USD Million) Forecast by Country, 2020 to 2035
  • Table 44: Middle East and Africa Market Volume (Kilotons) Forecast by Country, 2020 to 2035
  • Table 45: Middle East and Africa Market Value (USD Million) Forecast by Application, 2020 to 2035
  • Table 46: Middle East and Africa Market Volume (Kilotons) Forecast by Application, 2020 to 2035
  • Table 47: Middle East and Africa Market Value (USD Million) Forecast by Technology, 2020 to 2035
  • Table 48: Middle East and Africa Market Volume (Kilotons) Forecast by Technology, 2020 to 2035

List of Figures

  • Figure 1: Global Market Volume (Kilotons) Forecast 2020 to 2035
  • Figure 2: Global Market Pricing Analysis
  • Figure 3: Global Market Value (USD Million) Forecast 2020 to 2035
  • Figure 4: Global Market Value Share and BPS Analysis by Application, 2025 and 2035
  • Figure 5: Global Market Y-o-Y Growth Comparison by Application, 2025 to 2035
  • Figure 6: Global Market Attractiveness Analysis by Application
  • Figure 7: Global Market Value Share and BPS Analysis by Technology, 2025 and 2035
  • Figure 8: Global Market Y-o-Y Growth Comparison by Technology, 2025 to 2035
  • Figure 9: Global Market Attractiveness Analysis by Technology
  • Figure 10: Global Market Value (USD Million) Share and BPS Analysis by Region, 2025 and 2035
  • Figure 11: Global Market Y-o-Y Growth Comparison by Region, 2025 to 2035
  • Figure 12: Global Market Attractiveness Analysis by Region
  • Figure 13: North America Market Incremental $ Opportunity, 2025 to 2035
  • Figure 14: Latin America Market Incremental $ Opportunity, 2025 to 2035
  • Figure 15: Western Europe Market Incremental $ Opportunity, 2025 to 2035
  • Figure 16: Eastern Europe Market Incremental $ Opportunity, 2025 to 2035
  • Figure 17: East Asia Market Incremental $ Opportunity, 2025 to 2035
  • Figure 18: South Asia & Pacific Market Incremental $ Opportunity, 2025 to 2035
  • Figure 19: Middle East and Africa Market Incremental $ Opportunity, 2025 to 2035
  • Figure 20: North America Market Value Share and BPS Analysis by Country, 2025 and 2035
  • Figure 21: North America Market Value Share and BPS Analysis by Application, 2025 and 2035
  • Figure 22: North America Market Y-o-Y Growth Comparison by Application, 2025 to 2035
  • Figure 23: North America Market Attractiveness Analysis by Application
  • Figure 24: North America Market Value Share and BPS Analysis by Technology, 2025 and 2035
  • Figure 25: North America Market Y-o-Y Growth Comparison by Technology, 2025 to 2035
  • Figure 26: North America Market Attractiveness Analysis by Technology
  • Figure 27: Latin America Market Value Share and BPS Analysis by Country, 2025 and 2035
  • Figure 28: Latin America Market Value Share and BPS Analysis by Application, 2025 and 2035
  • Figure 29: Latin America Market Y-o-Y Growth Comparison by Application, 2025 to 2035
  • Figure 30: Latin America Market Attractiveness Analysis by Application
  • Figure 31: Latin America Market Value Share and BPS Analysis by Technology, 2025 and 2035
  • Figure 32: Latin America Market Y-o-Y Growth Comparison by Technology, 2025 to 2035
  • Figure 33: Latin America Market Attractiveness Analysis by Technology
  • Figure 34: Western Europe Market Value Share and BPS Analysis by Country, 2025 and 2035
  • Figure 35: Western Europe Market Value Share and BPS Analysis by Application, 2025 and 2035
  • Figure 36: Western Europe Market Y-o-Y Growth Comparison by Application, 2025 to 2035
  • Figure 37: Western Europe Market Attractiveness Analysis by Application
  • Figure 38: Western Europe Market Value Share and BPS Analysis by Technology, 2025 and 2035
  • Figure 39: Western Europe Market Y-o-Y Growth Comparison by Technology, 2025 to 2035
  • Figure 40: Western Europe Market Attractiveness Analysis by Technology
  • Figure 41: Eastern Europe Market Value Share and BPS Analysis by Country, 2025 and 2035
  • Figure 42: Eastern Europe Market Value Share and BPS Analysis by Application, 2025 and 2035
  • Figure 43: Eastern Europe Market Y-o-Y Growth Comparison by Application, 2025 to 2035
  • Figure 44: Eastern Europe Market Attractiveness Analysis by Application
  • Figure 45: Eastern Europe Market Value Share and BPS Analysis by Technology, 2025 and 2035
  • Figure 46: Eastern Europe Market Y-o-Y Growth Comparison by Technology, 2025 to 2035
  • Figure 47: Eastern Europe Market Attractiveness Analysis by Technology
  • Figure 48: East Asia Market Value Share and BPS Analysis by Country, 2025 and 2035
  • Figure 49: East Asia Market Value Share and BPS Analysis by Application, 2025 and 2035
  • Figure 50: East Asia Market Y-o-Y Growth Comparison by Application, 2025 to 2035
  • Figure 51: East Asia Market Attractiveness Analysis by Application
  • Figure 52: East Asia Market Value Share and BPS Analysis by Technology, 2025 and 2035
  • Figure 53: East Asia Market Y-o-Y Growth Comparison by Technology, 2025 to 2035
  • Figure 54: East Asia Market Attractiveness Analysis by Technology
  • Figure 55: South Asia & Pacific Market Value Share and BPS Analysis by Country, 2025 and 2035
  • Figure 56: South Asia & Pacific Market Value Share and BPS Analysis by Application, 2025 and 2035
  • Figure 57: South Asia & Pacific Market Y-o-Y Growth Comparison by Application, 2025 to 2035
  • Figure 58: South Asia & Pacific Market Attractiveness Analysis by Application
  • Figure 59: South Asia & Pacific Market Value Share and BPS Analysis by Technology, 2025 and 2035
  • Figure 60: South Asia & Pacific Market Y-o-Y Growth Comparison by Technology, 2025 to 2035
  • Figure 61: South Asia & Pacific Market Attractiveness Analysis by Technology
  • Figure 62: Middle East and Africa Market Value Share and BPS Analysis by Country, 2025 and 2035
  • Figure 63: Middle East and Africa Market Value Share and BPS Analysis by Application, 2025 and 2035
  • Figure 64: Middle East and Africa Market Y-o-Y Growth Comparison by Application, 2025 to 2035
  • Figure 65: Middle East and Africa Market Attractiveness Analysis by Application
  • Figure 66: Middle East and Africa Market Value Share and BPS Analysis by Technology, 2025 and 2035
  • Figure 67: Middle East and Africa Market Y-o-Y Growth Comparison by Technology, 2025 to 2035
  • Figure 68: Middle East and Africa Market Attractiveness Analysis by Technology
  • Figure 69: Global Market - Tier Structure Analysis
  • Figure 70: Global Market - Company Share Analysis

Frequently Asked Questions

What is the projected size of the nucleotide market in 2025?

The market size is valued at USD 715.2 million in 2025.

What is the outlook on nucleotide demand by 2035?

The market is forecasted to reach USD 1,301.3 million by 2035, reflecting a CAGR of 6.1%.

Which application segment leads the nucleotide market in 2025?

Pharmaceuticals are expected to lead the market, accounting for a 62.6% share in 2025.

What is the projected share of TaqMan Allelic Discrimination in the technology segment?

TaqMan Allelic Discrimination is expected to account for 46.8% of the market share in 2025.

Which country is projected to have the fastest-growing nucleotide market?

Japan is anticipated to be the fastest-growing market with a CAGR of 7.1% from 2025 to 2035.

Explore Similar Insights

Future Market Insights

Nucleotide Market