Oligonucleotide API Market
Market Insights on Oligonucleotide API covering sales outlook, demand forecast & up-to-date key trends
Oligonucleotide API Market by API, Marketing Status, End User & Region - Forecast 2022-2030
Oligonucleotide API Market Outlook (2022-2030)
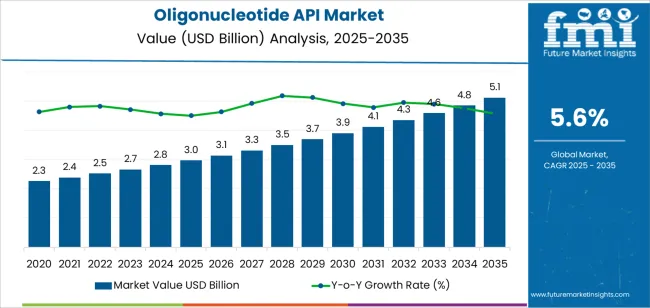
[181 Pages Report] Owing to the growing need for new drug classes, demand for oligonucleotide APIs is projected to rise at a high CAGR of 10.2% from 2022 to 2030. As such, the global oligonucleotide API market is projected to increase from a valuation of US$ 2.46 Bn in 2022 to US$ 5.36 Bn by the end of 2030.
Oligonucleotide API Market Size (2022) |
US$ 2.46 Bn |
Revenue Forecast (2030) |
US$ 5.36 Bn |
Global Market Growth Rate (2022-2030) |
10.2% CAGR |
North America Market Share |
39.9% |
Oligonucleotide APIs currently account for 35.6% share in the global oligonucleotide synthesis market. For the benefit of patients, key producers are concentrating on bringing in high-quality oligonucleotide APIs to the market.
Let us know your requirement to get
100% FREE customization
How The Market Progressed Till June 2022?
Particulars |
Details |
H1, 2021 |
10.12% |
H1, 2022 Projected |
10.19% |
H1, 2022 Outlook |
10.09% |
BPS Change - H1, 2022 (O) – H1, 2022 (P) |
(-) 10 ↓ |
BPS Change – H1, 2022 (O) – H1, 2021 |
(-) 03 ↓ |
According to Future Market Insights' analysis, the global oligonucleotide API market expects to drop by 03 Basis Point Share (BPS) in H1-2022 as compared to H1- 2021. Whereas in comparison to H1-2022 projected value, the market during H1-2022 outlook period will show a dip of 10 BPS.
The market is subject to be influenced by several macro and industrial factors, including GMP guidelines, product licensing, pharmaceutical and drug regulations, and sustainability.
The value in BPS change observes a negative impact owed to the fact that in the current scenario, oligonucleotide production poses a cost and waste burden to the manufacturers. Moreover, oligonucleotide production is an energy intensive process and calls for extensive measures for the treatment of hazardous waste before disposal. These factors hinder the growth of the market and the associated BPS value change.
The market for oligonucleotide API will, however, develop gradually in terms of growth with advancements in large scale production practices, such as the development of an oligonucleotide synthesizer.
Oligonucleotide API Demand Analysis (2015 to 2021) Vs Market Outlook (2022 to 2030)
Oligonucleotides are a new type of medicinal molecule that can be used to treat a wide range of ailments. They're little strands of mutated DNA, usually around 20 nucleotides long. Isolation of the active pharmaceutical ingredient (API) via lyophilization to produce a solid product, which is subsequently dissolved to produce an aqueous formulation, is the most typical method for producing oligonucleotides.
The oligonucleotide API market expanded at an astronomical CAGR of 23.8% from 2015 to 2021. Companies have used oligonucleotide active pharmaceutical ingredients (APIs) in solid solutions (powdered form) and, more recently, in the solution form.
Widespread use of oligonucleotide active pharmaceutical ingredients in the treatment of various ailments is driving the oligonucleotide API industry. Product development has paved the path for new therapeutic techniques in a range of treatment areas, including ophthalmologic indications, neuromuscular illnesses, and vaccine adjuvants.
Micro-RNA, small/short interfering RNA, Antisense oligonucleotides, immunostimulatory oligonucleotides, aptamers, and splice-switching oligonucleotides are some of the most important oligonucleotide classes. Solution stability, viscosity, concentration, end-to-end manufacturing, and packaging are some of the variables that have enhanced the trend of oligonucleotide APIs in solution.
The market for oligonucleotide APIs is looking brighter because of significant advancements achieved in the industry associations discussing CMC (chemistry, manufacturing, and control) techniques. Demand for novel drug classes for chronic obstructive pulmonary disease and asthma is increasing, opening up new market opportunities.
Sales of oligonucleotide APIs are expected to progress at a CAGR of 10.2% from 2022 to 2030, with the global market predicted to reach a valuation of US$ 5.36 Bn by 2030.
Which Factors are Boosting the Sales Growth of the Oligonucleotide API Market?
“Increasing Investments in R&D to Boost Oligonucleotide API Demand”
Increasing number of oligonucleotide active pharmaceutical ingredients in medication pipelines around the world is a major driver of market growth. Pharma businesses have benefited from the ongoing trend toward harmonization of oligonucleotide development and marketing over the last 10–15 years.
The European Pharma Oligonucleotide Consortium (EPOC) has made concentrated efforts with pharmaceutical businesses all over the world in this respect. The development of oligonucleotide therapies has been aided by a growing number of science-based suggestions. Increased research in biological treatments has bolstered Pharma companies’ medication pipelines in the oligonucleotide API market.
A comparison study of the solution versus powder API has helped market participants. The numerous advantages of powder API produced by the lyophilization process have enhanced its popularity. Several studies on retaining the stability of various oligonucleotide classes have aided the growth of the oligonucleotide API market.
Pharma businesses have benefited from advances in technologies for the concentration of oligonucleotide API solutions. Furthermore, the market for oligonucleotide active pharmaceutical ingredients is being boosted by the increasing usage of sophisticated chromatographic purification.
“Growing Fear of Cancer & Alzheimer Driving Development of Advanced Testing Procedures”
Due to the sheer rising number of cancer cases, the demand for innovative diagnostics is expected to rise. Oligonucleotide APIs pave the way for a brand-new class of nucleic acid probes known as "aptamers," which are outperforming monoclonal antibodies.
Personalized treatments are also needed for neurodegenerative diseases. During the projected timeframe, this trend is likely to have an impact on the oligonucleotide API market.
Degenerated nerves are more common in the elderly population. "Alzheimer's disease" is one of the most frequent neurodegenerative conditions. On this front, conventional medicine has several limits. As a result, a substantial study is being done on the use of oligonucleotide APIs in this field.
- For example, LMTX, an anti-tau chemical, has been claimed to have the potential to improve cognitive capacities in Alzheimer's patients. The chemical was tested on mice, which produced tau protein that acted as an inhibitor of tau protein aggregation, slowing the progression of Alzheimer disease in mice.
Such kinds of discoveries are bound to persuade healthcare providers to use oligonucleotide APIs for other chronic diseases as well.
Find your sweet spots for generating winning opportunities in this market.
Talk to AnalystWhich Regional Markets are Set to Be Lucrative for Oligonucleotide API Vendors?
“Increasing Funding in Drug Discovery to Boost Sales Growth of North America & Europe Oligonucleotide API Market”
The global oligonucleotide API market has been studied across North America, Latin America, Europe, East Asia, South Asia & Pacific, and the Middle East & Africa (MEA).
North America is expected to hold 39.9% of the global market share, in 2022. The oligonucleotide API market is dominated by North America. This is due to its major presence in drug development, diagnostic screening, cancer, proteomics, and genomics.
Because Europe is home to the majority of the world's geriatric population, substantial research on the use of oligonucleotide APIs in treating disorders connected to ageing is being conducted. At present, Europe is predicted to account for 39.6% of the global market share.
Rise in revenue in the global API market can be ascribed to the rise in commercially authorised oligonucleotide therapies in North America and Europe. Latin America is set to account for 7.4% of the global market share in 2022.
In 2022, East Asia, South Asia and Oceania together are likely to hold 12% of the global market share. The Asia Pacific is a healthy regional market due to its growing funding for healthcare facilities.
The MEA region's oligonucleotide API market is likely to grow at a slower pace than other regions, however, this trend is expected to reverse by the end of the projected period. The MEA market is expected to account for 1.1% of the global market share in 2022.
Country-wise Analysis
How is the Oligonucleotide API Market Growing in the U.S.?
“Improved Healthcare Facilities Driving Oligonucleotide API Market Growth in the U.S.”
The United States is one of the top countries driving the oligonucleotide API market. According to the US FDA's Center for Drug Evaluation and Research, over 28% of API manufacturing facilities for the US market are located in the United States. The remaining 59 percent are based in other regions of the world, including 13 percent situated in China.
Thus, the country’s advanced healthcare infrastructure is helping in the expansion of the oligonucleotide API market. The U.S. is also focusing on larger investments in drug discovery programs.
Which Factors are Fueling Sales Growth of the China Oligonucleotide API Market?
“Massive Investments in Life Scientific Activities Make China a Prospective Market for Oligonucleotide APIs”
Due to significant spending on healthcare infrastructural development, the market for oligonucleotide active pharmaceutical ingredients is predicted to grow fast in the country.
Presence of various biopharmaceutical contractual research organisations in China, as well as the relocation of drug manufacturing plants by multinational manufacturers, are estimated to expand the market's optimistic growth prospects through 2030.

A unified Market Research Subscription Platform, built for today's disparate research needs.
Category-wise Analysis
Which API Type is in Most Demand?
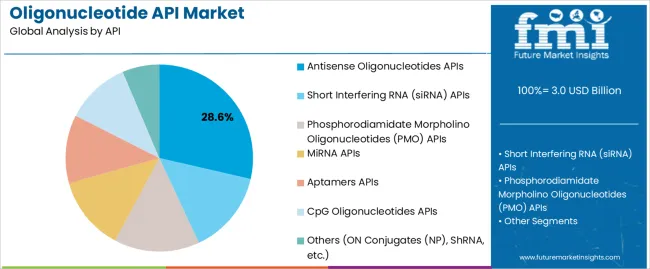
“Antisense Oligonucleotides APIs Gaining Popularity Due to Their Effective Results”
The manufacture of oligonucleotides has always revolved around separating API and lyophilizing it to create a solid product. Following its dissolution, an aqueous formulation is generated.
In today's world, however, API manufacturers do not always need to isolate solid API before therapeutic product formulation. The European Pharma Oligonucleotide Consortium has partnered with many pharmaceutical companies to share CMC (chemical, manufacturing, and control) practices to harmonise oligonucleotide commercialization and development.
The "antisense" oligonucleotide class is gaining popularity. In the year 2016, they were certified for commercial use. Spinraza, Tegsedi, and Waylivra are some among them.
The advantage of solution APIs over powder APIs is that they place a greater emphasis on microbial control. Furthermore, the elimination of compounding and dissolution processes ensures improved efficiency.
COVID-19 Impact on Market
The COVID-19 pandemic harmed the production of oligonucleotide APIs. The COVID-19 outbreak momentarily dented the oligonucleotide API market, as production slowed due to partial/total lockdowns around the globe.
The market is predicted to recover over the coming years. Players will most likely invest more in oligonucleotide APIs in order to find long-term solutions to pandemics like this one.
Competitive Landscape
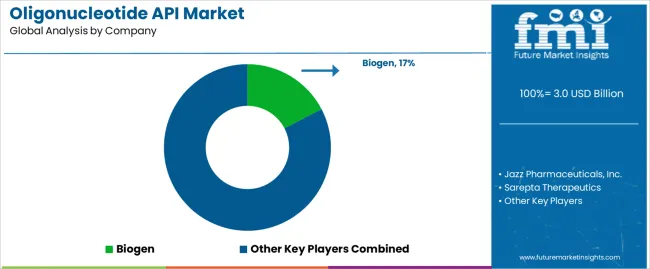
Sarepta Therapeutics, Akcea Therapeutics, Jazz Pharmaceuticals, Inc., Biogen, and Dynavax Technologies are the top participants in the oligonucleotide API industry. Through inorganic expansion methods, market players are focusing on expanding their global and regional presence in enterprise solutions.
The oligonucleotide active pharmaceutical ingredient market is predicted to grow due to tactical partnerships and new product introductions by key industry competitors. To maintain a presence in the oligonucleotide API market, organisations with creative work abilities and innovative capacity will be in place.
Increasing research on gene therapy and attractive reimbursement scenario is crucial for the growth of the market at an outstanding rate, with North America and Europe owning a considerable share of the global oligonucleotide API market.
Oligonucleotide API Industry Report Scope
Attribute |
Details |
Forecast Period |
2022-2030 |
Historical Data Available for |
2015-2021 |
Market Analysis |
US$ Bn for Value |
Key Regions Covered |
|
Key Countries Covered |
|
Key Market Segments Covered |
|
Key Companies Profiled |
|
Pricing |
Available upon Request |
Key Segments of Oligonucleotide API Industry Survey
Oligonucleotide API Market by API:
- Antisense Oligonucleotides APIs
- Short Interfering RNA (siRNA) APIs
- Phosphorodiamidate Morpholino Oligonucleotides (PMO) APIs
- MiRNA APIs
- Aptamers APIs
- CpG Oligonucleotides APIs
- Others (ON Conjugates (NP), ShRNA, etc.)
Oligonucleotide API Market by Marketing Status:
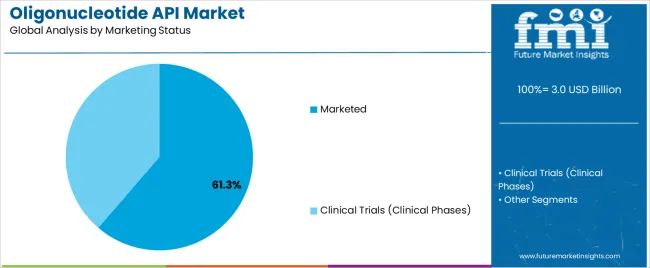
- Marketed
- Clinical Trials (Clinical Phases)
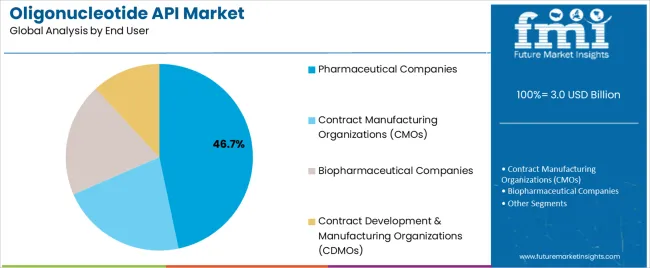
Oligonucleotide API Market by End User:
- Contract Manufacturing Organizations (CMOs)
- Pharmaceutical Companies
- Biopharmaceutical Companies
- Contract Development & Manufacturing Organizations (CDMOs)
Oligonucleotide API Market by Region:
- North America Oligonucleotide API Market
- Latin America Oligonucleotide API Market
- Europe Oligonucleotide API Market
- East Asia Oligonucleotide API Market
- South Asia & Pacific Oligonucleotide API Market
- Middle East & Africa (MEA) Oligonucleotide API Market
Frequently Asked Questions
What is the predicted growth rate of the global oligonucleotide API market in the approaching years?
Through 2030, the global oligonucleotide API market is expected to expand at a CAGR of 10.2%.
The global market for oligonucleotide APIs is valued at US$ 2.46 Bn at present.
By 2030, the global oligonucleotide active pharmaceutical ingredient market is expected to reach a value of US$ 5.36 Bn.
The North America oligonucleotide API market currently holds 39.9% share in the global market.
In North America and Europe, increased gene therapy research and a favourable reimbursement landscape are driving the market's rapid expansion.
Some of the key oligonucleotide active pharmaceutical ingredient providers are Jazz Pharmaceuticals, Inc., Sarepta Therapeutics, Biogen, Dynavax Technologies, Akcea Therapeutics., and Alnylam Pharmaceuticals, Inc.
Table of Content
1. Executive Summary
1.1. Global Market Outlook
1.2. Demand Side Trends
1.3. Supply Side Trends
1.4. Technology Assessment
1.5. Analysis and Recommendations
2. Market Overview
2.1. Market Coverage / Taxonomy
2.2. Market Definition / Scope / Limitations
2.3. Inclusions and Exclusions
3. Key Market Trends
3.1. Key Trends Impacting the Market
3.2. Product Innovation / Development Trends
4. Market Background
4.1. Macro-Economic Factors
4.1.1. Global GDP Growth Outlook
4.1.2. Global Healthcare Outlook
4.2. Forecast Factors - Relevance & Impact
4.2.1. Research and Developmental Activities
4.2.2. Product Formulation Advancement
4.2.3. Key Players Historical Growth
4.2.4. Market Consolidation Activities
4.2.5. Growing Investment by Key Players in Product Development
4.3. Current COVID19 Statistics and Probable Future Impact
4.3.1. Current GDP Projection and Probable Impact
4.3.2. Current Economic Projection as compared to 2008 financial analysis
4.3.3. COVID19 and Impact Analysis
4.3.4. 2022 Market Scenario
4.3.5. Recovery Scenario – Short term, Midterm and Long Term Impact
4.4. Market Dynamics
4.4.1. Drivers
4.4.2. Restraints
4.4.3. Opportunities
5. Market Context
5.1. Product USPs/ Features
5.2. Product Adoption / Usage Analysis
5.3. Regulatory Scenario
5.4. Opportunity Analysis For The Products Under Late Stage Clinical Trial
5.5. Revenue Breakdown by Region by Approved Market Products
5.6. Supply-Chain Analysis
5.7. Value Chain Analysis
6. Oligonucleotide API Market Volume (in Kg/Tons) Analysis 2015-2021 and Forecast, 2022-2030
6.1. Historical Market Volume (Kg/Tons) Analysis, 2015-2021
6.2. Current and Future Market Volume (Kg/Tons) Projections, 2022-2030
6.2.1. Y-o-Y Growth Trend Analysis
6.2.2. Absolute $ Opportunity Analysis
7. Global Oligonucleotide API Market Value (US$ Mn) Analysis 2015-2021 and Forecast, 2022-2030
7.1. Historical Market Value (US$ Mn) Analysis, 2015-2021
7.2. Current and Future Market Value (US$ Mn) Projections, 2022-2030
7.2.1. Y-o-Y Growth Trend Analysis
7.2.2. Opportunity Analysis, 2022-2030
8. Global Oligonucleotide API Market Analysis 2015-2021 and Forecast 2022-2030, By API Type
8.1. Introduction / Key Findings
8.2. Historical Market Size (US$ Mn) & Volume (Kg/Tons) Analysis By API Type, 2015-2021
8.3. Current and Future Market Size (US$ Mn) & Volume (Kg/Tons) Analysis and Forecast By API Type, 2022-2030
8.3.1. Antisense Oligonucleotides API
8.3.2. Short Interfering RNA (siRNA) API
8.3.3. Phosphorodiamidate Morpholino Oligonucleotides (PMO) API
8.3.4. MiRNA API
8.3.5. Aptamers API
8.3.6. CpG Oligonucleotides API
8.3.7. Others (ON Conjugates (NP), ShRNA, etc.)
8.4. Market Attractiveness Analysis By API Type
9. Global Oligonucleotide API Market Analysis 2015-2021 and Forecast 2022-2030, By Marketing Status
9.1. Introduction / Key Findings
9.2. Historical Market Size (US$ Mn) Analysis By Marketing Status, 2015-2021
9.3. Current and Future Market Size (US$ Mn) Analysis and Forecast By Marketing Status, 2022-2030
9.3.1. Marketed
9.3.2. Clinical Trials (Clinical Phase)
9.4. Market Attractiveness Analysis By Marketing Status
10. Global Oligonucleotide API Market Analysis 2015-2021 and Forecast 2022-2030, by End User
10.1. Introduction / Key Findings
10.2. Historical Market Size (US$ Mn) Analysis By End User, 2015-2021
10.3. Current and Future Market Size (US$ Mn) Analysis and Forecast By End User, 2022-2030
10.3.1. Contract Manufacturing Organizations (CMOs)
10.3.2. Pharmaceutical & Biopharmaceutical Companies
10.3.3. Contract Development & Manufacturing Organizations (CDMOs)
10.4. Market Attractiveness Analysis By End User
11. Global Oligonucleotide API Market Analysis 2015-2021 and Forecast 2022-2030, by Region
11.1. Introduction / Key Findings
11.2. Historical Market Size (US$ Mn) Analysis By Region, 2015-2021
11.3. Current and Future Market Size (US$ Mn) Analysis and Forecast By Region, 2022-2030
11.3.1. North America
11.3.2. Latin America
11.3.3. Europe
11.3.4. East Asia
11.3.5. South Asia
11.3.6. Oceania
11.3.7. Middle East and Africa
11.4. Market Attractiveness Analysis By Region
12. North America Oligonucleotide API Market Analysis 2015-2021 and Forecast 2022-2030
12.1. Introduction
12.2. Historical Market Size (US$ Mn) Analysis By Market Taxonomy, 2015-2021
12.3. Current and Future Market Size (US$ Mn) Analysis and Forecast By Market Taxonomy, 2022-2030
12.3.1.By Country
12.3.1.1. U.S.
12.3.1.2. Canada
12.3.2. By API Type
12.3.3. By Marketing Status
12.3.4. By End User
12.4. Market Attractiveness Analysis
12.5. Key Market Participants - Intensity Mapping
12.6. Drivers and Restraints - Impact Analysis
13. Latin America Oligonucleotide API Market Analysis 2015-2021 and Forecast 2022-2030
13.1. Introduction
13.2. Historical Market Size (US$ Mn) Analysis By Market Taxonomy, 2015-2021
13.3. Current and Future Market Size (US$ Mn) Analysis and Forecast By Market Taxonomy, 2022-2030
13.3.1.By Country
13.3.1.1. Brazil
13.3.1.2. Mexico
13.3.1.3. Argentina
13.3.1.4. Rest of Latin America
13.3.2. By API Type
13.3.3. By Marketing Status
13.3.4. By End User
13.4. Market Attractiveness Analysis
13.5. Key Market Participants - Intensity Mapping
13.6. Drivers and Restraints - Impact Analysis
14. Europe Oligonucleotide API Market Analysis 2015-2021 and Forecast 2022-2030
14.1. Introduction
14.2. Historical Market Size (US$ Mn) Analysis By Market Taxonomy, 2015-2021
14.3. Current and Future Market Size (US$ Mn) Analysis and Forecast By Market Taxonomy, 2022-2030
14.3.1.By Country
14.3.1.1. Germany
14.3.1.2. Italy
14.3.1.3. France
14.3.1.4. U.K.
14.3.1.5. Spain
14.3.1.6. BENELUX
14.3.1.7. Russia
14.3.1.8. Rest of Europe
14.3.2. By API Type
14.3.3. By Marketing Status
14.3.4. By End User
14.4. Market Attractiveness Analysis
14.5. Key Market Participants - Intensity Mapping
14.6. Drivers and Restraints - Impact Analysis
15. South Asia Oligonucleotide API Market Analysis 2015-2021 and Forecast 2022-2030
15.1. Introduction
15.2. Historical Market Size (US$ Mn) Analysis By Market Taxonomy, 2015-2021
15.3. Current and Future Market Size (US$ Mn) Analysis and Forecast By Market Taxonomy, 2022-2030
15.3.1.By Country
15.3.1.1. India
15.3.1.2. Thailand
15.3.1.3. Indonesia
15.3.1.4. Malaysia
15.3.1.5. Rest of South Asia
15.3.2. By API Type
15.3.3. By Marketing Status
15.3.4. By End User
15.4. Market Attractiveness Analysis
15.5. Key Market Participants - Intensity Mapping
15.6. Drivers and Restraints - Impact Analysis
16. East Asia Oligonucleotide API Market Analysis 2015-2021 and Forecast 2022-2030
16.1. Introduction
16.2. Historical Market Size (US$ Mn) Analysis By Market Taxonomy, 2015-2021
16.3. Current and Future Market Size (US$ Mn) Analysis and Forecast By Market Taxonomy, 2022-2030
16.3.1. By Country
16.3.1.1. China
16.3.1.2. Japan
16.3.1.3. South Korea
16.3.2. By API Type
16.3.3. By Marketing Status
16.3.4. By End User
16.4. Market Attractiveness Analysis
16.5. Key Market Participants - Intensity Mapping
16.6. Drivers and Restraints - Impact Analysis
17. Oceania Oligonucleotide API Market Analysis 2015-2021 and Forecast 2022-2030
17.1. Introduction
17.2. Historical Market Size (US$ Mn) Analysis By Market Taxonomy, 2015-2021
17.3. Current and Future Market Size (US$ Mn) Analysis and Forecast By Market Taxonomy, 2022-2030
17.3.1.By Country
17.3.1.1. Australia
17.3.1.2. New Zealand
17.3.2. By API Type
17.3.3. By Marketing Status
17.3.4. By End User
17.4. Market Attractiveness Analysis
17.5. Key Market Participants - Intensity Mapping
17.6. Drivers and Restraints - Impact Analysis
18. Middle East and Africa Oligonucleotide API Market Analysis 2015-2021 and Forecast 2022-2030
18.1. Introduction
18.2. Historical Market Size (US$ Mn) Analysis By Market Taxonomy, 2015-2021
18.3. Current and Future Market Size (US$ Mn) Analysis and Forecast By Market Taxonomy, 2022-2030
18.3.1. By Country
18.3.1.1. GCC Countries
18.3.1.2. Turkey
18.3.1.3. South Africa
18.3.1.4. Rest of Middle East and Africa
18.3.2. By API Type
18.3.3. By Marketing Status
18.3.4. By End User
18.4. Market Attractiveness Analysis
18.5. Key Market Participants - Intensity Mapping
18.6. Drivers and Restraints - Impact Analysis
19. Key and Emerging Countries Oligonucleotide API Market Analysis 2015-2021 and Forecast 2022-2030
19.1. Introduction
19.1.1. Market Value Proportion Analysis, By Key Countries
19.1.2. Global Vs. Country Growth Comparison
19.2. U.S. Oligonucleotide API Market Analysis
19.2.1. By API Type
19.2.2. By Marketing Status
19.2.3. By End User
19.3. Canada Oligonucleotide API Market Analysis
19.3.1. By API Type
19.3.2. By Marketing Status
19.3.3. By End User
19.4. Mexico Oligonucleotide API Market Analysis
19.4.1. By API Type
19.4.2. By Marketing Status
19.4.3. By End User
19.5. Brazil Oligonucleotide API Market Analysis
19.5.1. By API Type
19.5.2. By Marketing Status
19.5.3. By End User
19.6. U.K. Oligonucleotide API Market Analysis
19.6.1. By API Type
19.6.2. By Marketing Status
19.6.3. By End User
19.7. Germany Oligonucleotide API Market Analysis
19.7.1. By API Type
19.7.2. By Marketing Status
19.7.3. By End User
19.8. France Oligonucleotide API Market Analysis
19.8.1. By API Type
19.8.2. By Marketing Status
19.8.3. By End User
19.9. Italy Oligonucleotide API Market Analysis
19.9.1. By API Type
19.9.2. By Marketing Status
19.9.3. By End User
19.10. Spain Oligonucleotide API Market Analysis
19.10.1. By API Type
19.10.2. By Marketing Status
19.10.3. By End User
19.11. BENELUX Oligonucleotide API Market Analysis
19.11.1. By API Type
19.11.2. By Marketing Status
19.11.3. By End User
19.12. Russia Oligonucleotide API Market Analysis
19.12.1. By API Type
19.12.2. By Marketing Status
19.12.3. By End User
19.13. China Oligonucleotide API Market Analysis
19.13.1. By API Type
19.13.2. By Marketing Status
19.13.3. By End User
19.14. Japan Oligonucleotide API Market Analysis
19.14.1. By API Type
19.14.2. By Marketing Status
19.14.3. By End User
19.15. South Korea Oligonucleotide API Market Analysis
19.15.1. By API Type
19.15.2. By Marketing Status
19.15.3. By End User
19.16. India Oligonucleotide API Market Analysis
19.16.1. By API Type
19.16.2. By Marketing Status
19.16.3. By End User
19.17. ASEAN Oligonucleotide API Market Analysis
19.17.1. By API Type
19.17.2. By Marketing Status
19.17.3. By End User
19.18. Australia Oligonucleotide API Market Analysis
19.18.1. By API Type
19.18.2. By Marketing Status
19.18.3. By End User
19.19. New Zealand Oligonucleotide API Market Analysis
19.19.1. By API Type
19.19.2. By Marketing Status
19.19.3. By End User
19.20. GCC Countries Oligonucleotide API Market Analysis
19.20.1. By API Type
19.20.2. By Marketing Status
19.20.3. By End User
19.21. Turkey Oligonucleotide API Market Analysis
19.21.1. By API Type
19.21.2. By Marketing Status
19.21.3. By End User
19.22. South Africa Oligonucleotide API Market Analysis
19.22.1. By API Type
19.22.2. By Marketing Status
19.22.3. By End User
20. Market Structure Analysis
20.1. Market Analysis by Tier of Companies
20.2. Market Share Analysis of Top Players
20.3. Market Presence Analysis
20.3.1. Regional Footprint by Players
20.3.2. Product Foot print by Players
20.3.3. Channel Foot Print by Players
21. Competition Analysis
21.1. Competition Dashboard
21.2. Competition Benchmarking
21.3. Competition Deep Dive (Tentative List)
21.3.1. Agilent Technologies, Inc.
21.3.1.1. Overview
21.3.1.2. Product Portfolio
21.3.1.3. Profitability by Market Segments (Product/Channel/Region)
21.3.1.4. Sales Footprint
21.3.1.5. Strategy Overview
21.3.1.5.1. Marketing Strategy
21.3.1.5.2. Product Strategy
21.3.1.5.3. Channel Strategy
21.3.2. Bachem Holding AG
21.3.2.1. Overview
21.3.2.2. Product Portfolio
21.3.2.3. Profitability by Market Segments (Product/Channel/Region)
21.3.2.4. Sales Footprint
21.3.2.5. Strategy Overview
21.3.2.5.1. Marketing Strategy
21.3.2.5.2. Product Strategy
21.3.2.5.3. Channel Strategy
21.3.3. CordenPharma International
21.3.3.1. Overview
21.3.3.2. Product Portfolio
21.3.3.3. Profitability by Market Segments (Product/Channel/Region)
21.3.3.4. Sales Footprint
21.3.3.5. Strategy Overview
21.3.3.5.1. Marketing Strategy
21.3.3.5.2. Product Strategy
21.3.3.5.3. Channel Strategy
21.3.4. Integrated DNA Technologies, Inc. (Danaher Corporation)
21.3.4.1. Overview
21.3.4.2. Product Portfolio
21.3.4.3. Profitability by Market Segments (Product/Channel/Region)
21.3.4.4. Sales Footprint
21.3.4.5. Strategy Overview
21.3.4.5.1. Marketing Strategy
21.3.4.5.2. Product Strategy
21.3.4.5.3. Channel Strategy
21.3.5. Eurofins Scientific
21.3.5.1. Overview
21.3.5.2. Product Portfolio
21.3.5.3. Profitability by Market Segments (Product/Channel/Region)
21.3.5.4. Sales Footprint
21.3.5.5. Strategy Overview
21.3.5.5.1. Marketing Strategy
21.3.5.5.2. Product Strategy
21.3.5.5.3. Channel Strategy
21.3.6. GE Healthcare
21.3.6.1. Overview
21.3.6.2. Product Portfolio
21.3.6.3. Profitability by Market Segments (Product/Channel/Region)
21.3.6.4. Sales Footprint
21.3.6.5. Strategy Overview
21.3.6.5.1. Marketing Strategy
21.3.6.5.2. Product Strategy
21.3.6.5.3. Channel Strategy
21.3.7. Merck KGaA
21.3.7.1. Overview
21.3.7.2. Product Portfolio
21.3.7.3. Profitability by Market Segments (Product/Channel/Region)
21.3.7.4. Sales Footprint
21.3.7.5. Strategy Overview
21.3.7.5.1. Marketing Strategy
21.3.7.5.2. Product Strategy
21.3.7.5.3. Channel Strategy
21.3.8. Thermo Fisher Scientific
21.3.8.1. Overview
21.3.8.2. Product Portfolio
21.3.8.3. Profitability by Market Segments (Product/Channel/Region)
21.3.8.4. Sales Footprint
21.3.8.5. Strategy Overview
21.3.8.5.1. Marketing Strategy
21.3.8.5.2. Product Strategy
21.3.8.5.3. Channel Strategy
21.3.9. RiBoBio Co.
21.3.9.1. Overview
21.3.9.2. Product Portfolio
21.3.9.3. Profitability by Market Segments (Product/Channel/Region)
21.3.9.4. Sales Footprint
21.3.9.5. Strategy Overview
21.3.9.5.1. Marketing Strategy
21.3.9.5.2. Product Strategy
21.3.9.5.3. Channel Strategy
21.3.10. LGC Biosearch Technologies
21.3.10.1. Overview
21.3.10.2. Product Portfolio
21.3.10.3. Profitability by Market Segments (Product/Channel/Region)
21.3.10.4. Sales Footprint
21.3.10.5. Strategy Overview
21.3.10.5.1. Marketing Strategy
21.3.10.5.2. Product Strategy
21.3.10.5.3. Channel Strategy
21.3.11. ST Pharm
21.3.11.1. Overview
21.3.11.2. Product Portfolio
21.3.11.3. Profitability by Market Segments (Product/Channel/Region)
21.3.11.4. Sales Footprint
21.3.11.5. Strategy Overview
21.3.11.5.1. Marketing Strategy
21.3.11.5.2. Product Strategy
21.3.11.5.3. Channel Strategy
21.3.12. Kaneka Eurogentec S.A.
21.3.12.1. Overview
21.3.12.2. Product Portfolio
21.3.12.3. Profitability by Market Segments (Product/Channel/Region)
21.3.12.4. Sales Footprint
21.3.12.5. Strategy Overview
21.3.12.5.1. Marketing Strategy
21.3.12.5.2. Product Strategy
21.3.12.5.3. Channel Strategy
21.3.13. Ajinomoto Co., Inc.
21.3.13.1. Overview
21.3.13.2. Product Portfolio
21.3.13.3. Profitability by Market Segments (Product/Channel/Region)
21.3.13.4. Sales Footprint
21.3.13.5. Strategy Overview
21.3.13.5.1. Marketing Strategy
21.3.13.5.2. Product Strategy
21.3.13.5.3. Channel Strategy
21.3.14. Bio-synthesis Inc.
21.3.14.1. Overview
21.3.14.2. Product Portfolio
21.3.14.3. Profitability by Market Segments (Product/Channel/Region)
21.3.14.4. Sales Footprint
21.3.14.5. Strategy Overview
21.3.14.5.1. Marketing Strategy
21.3.14.5.2. Product Strategy
21.3.14.5.3. Channel Strategy
21.3.15. STA Pharmaceutical Co., Ltd.
21.3.15.1. Overview
21.3.15.2. Product Portfolio
21.3.15.3. Profitability by Market Segments (Product/Channel/Region)
21.3.15.4. Sales Footprint
21.3.15.5. Strategy Overview
21.3.15.5.1. Marketing Strategy
21.3.15.5.2. Product Strategy
21.3.15.5.3. Channel Strategy
21.3.16. BioSpring GmbH
21.3.16.1. Overview
21.3.16.2. Product Portfolio
21.3.16.3. Profitability by Market Segments (Product/Channel/Region)
21.3.16.4. Sales Footprint
21.3.16.5. Strategy Overview
21.3.16.5.1. Marketing Strategy
21.3.16.5.2. Product Strategy
21.3.16.5.3. Channel Strategy
22. Assumptions and Acronyms Used
23. Research Methodology
Let us know your requirement to get
100% FREE customization
List of Tables
Table 01: Global Oligonucleotide API Market Size (US$ Mn) Analysis 2015-2021 and Forecast 2022-2030, by API Type
Table 02: Global Oligonucleotide API Market Size (US$ Mn) Analysis 2015-2021 and Forecast 2022-2030, By Marketing Status
Table 03: Global Oligonucleotide API Market Size (US$ Mn) Analysis 2015-2021 and Forecast 2022-2030, by End User
Table 04: Global Oligonucleotide API Market Size (US$ Mn) Analysis 2015-2021 and Forecast 2022-2030, By Region
Table 05: North America Oligonucleotide API Market Size (US$ Mn) Analysis 2015-2021 and Forecast 2022-2030, By Country
Table 06: North America Oligonucleotide API Market Size (US$ Mn) Analysis 2015-2021 and Forecast 2022-2030, by API Type
Table 07: North America Oligonucleotide API Market Size (US$ Mn) Analysis 2015-2021 and Forecast 2022-2030, By Marketing Status
Table 08: North America Oligonucleotide API Market Size (US$ Mn) Analysis 2015-2021 and Forecast 2022-2030, by End User
Table 09: Latin America Oligonucleotide API Market Size (US$ Mn) Analysis 2015-2021 and Forecast 2022-2030, By Country
Table 10: Latin America Oligonucleotide API Market Size (US$ Mn) Analysis 2015-2021 and Forecast 2022-2030, by API Type
Table 11: Latin America Oligonucleotide API Market Size (US$ Mn) Analysis 2015-2021 and Forecast 2022-2030, By Marketing Status
Table 12: Latin America Oligonucleotide API Market Size (US$ Mn) Analysis 2015-2021 and Forecast 2022-2030, by End User
Table 13: Europe Oligonucleotide API Market Size (US$ Mn) Analysis 2015-2021 and Forecast 2022-2030, By Country
Table 14: Europe Oligonucleotide API Market Size (US$ Mn) Analysis 2015-2021 and Forecast 2022-2030, by API Type
Table 15: Europe Oligonucleotide API Market Size (US$ Mn) Analysis 2015-2021 and Forecast 2022-2030, By Marketing Status
Table 16: Europe Oligonucleotide API Market Size (US$ Mn) Analysis 2015-2021 and Forecast 2022-2030, by End User
Table 17: East Asia Oligonucleotide API Market Size (US$ Mn) Analysis 2015-2021 and Forecast 2022-2030, By Country
Table 18: East Asia Oligonucleotide API Market Size (US$ Mn) Analysis 2015-2021 and Forecast 2022-2030, by API Type
Table 19: East Asia Oligonucleotide API Market Size (US$ Mn) Analysis 2015-2021 and Forecast 2022-2030, By Marketing Status
Table 20: East Asia Oligonucleotide API Market Size (US$ Mn) Analysis 2015-2021 and Forecast 2022-2030, by End User
Table 21: South Asia Oligonucleotide API Market Size (US$ Mn) Analysis 2015-2021 and Forecast 2022-2030, By Country
Table 22: South Asia Oligonucleotide API Market Size (US$ Mn) Analysis 2015-2021 and Forecast 2022-2030, by API Type
Table 23: South Asia Oligonucleotide API Market Size (US$ Mn) Analysis 2015-2021 and Forecast 2022-2030, By Marketing Status
Table 24: South Asia Oligonucleotide API Market Size (US$ Mn) Analysis 2015-2021 and Forecast 2022-2030, by End User
Table 25: Oceania Oligonucleotide API Market Size (US$ Mn) Analysis 2015-2021 and Forecast 2022-2030, By Country
Table 26: Oceania Oligonucleotide API Market Size (US$ Mn) Analysis 2015-2021 and Forecast 2022-2030, by API Type
Table 27: Oceania Oligonucleotide API Market Size (US$ Mn) Analysis 2015-2021 and Forecast 2022-2030, By Marketing Status
Table 28: Oceania Oligonucleotide API Market Size (US$ Mn) Analysis 2015-2021 and Forecast 2022-2030, by End User
Table 29: MEA Oligonucleotide API Market Size (US$ Mn) Analysis 2015-2021 and Forecast 2022-2030, By Country
Table 30: MEA Oligonucleotide API Market Size (US$ Mn) Analysis 2015-2021 and Forecast 2022-2030, by API Type
Table 31: MEA Oligonucleotide API Market Size (US$ Mn) Analysis 2015-2021 and Forecast 2022-2030, By Marketing Status
Table 32: MEA Oligonucleotide API Market Size (US$ Mn) Analysis 2015-2021 and Forecast 2022-2030, by End User
Find your sweet spots for generating winning opportunities in this market.
Talk to AnalystList of Charts
Figure 01: Global Oligonucleotide API Market Size (US$ Mn) Analysis, 2015–2021
Figure 02: Global Oligonucleotide API Market Size (US$ Mn) & Y-o-Y Growth (%) Analysis, 2021–2030
Figure 03: Global Oligonucleotide API Market Absolute $ Opportunity Analysis, 2021–2030
Figure 04: Global Oligonucleotide API Market Analysis by API Type –2021 & 2030
Figure 05: Global Oligonucleotide API Market Y-o-Y Growth Projections by API Type, 2021 – 2030
Figure 06: Global Oligonucleotide API Market Attractiveness Analysis By API Type, 2021-2030,
Figure 07: Global Oligonucleotide API Market Analysis by Marketing Status –2021 & 2030
Figure 08: Global Oligonucleotide API Market Y-o-Y Growth Projections by Marketing Status, 2021 – 2030
Figure 09: Global Oligonucleotide API Market Size (US$ Mn) Analysis 2015-2021 and Forecast 2021-2030, by Marketing Status
Figure 10: Global Oligonucleotide API Market Analysis by End User –2021 & 2030
Figure 11: Global Oligonucleotide API Market Y-o-Y Growth Projections by End User, 2021 – 2030
Figure 12: Global Oligonucleotide API Market Attractiveness Analysis 2021-2030, By End User
Figure 13: Global Oligonucleotide API Market Share Analysis (%) By Region, 2021 & 2030
Figure 14: Global Oligonucleotide API Market Y-o-Y Growth (%) By Region, 2021–2030
Figure 15: Global Oligonucleotide API Market Attractiveness Analysis 2021-2030, By Region
Figure 16: North America Oligonucleotide API Market Size (US$ Mn) Analysis, 2015-2021
Figure 17: North America Oligonucleotide API Market Size (US$ Mn) & Y-o-Y Growth (%), 2021–2030
Figure 18: North America Oligonucleotide API Market Size (US$ Mn) Analysis 2015-2021 and Forecast 2021-2030, by Country
Figure 19: North America Oligonucleotide API Market Size (US$ Mn) Analysis 2015-2021 and Forecast 2021-2030, by API Type
Figure 20: North America Oligonucleotide API Market Size (US$ Mn) Analysis 2015-2021 and Forecast 2021-2030, Marketing Status
Figure 21: North America Oligonucleotide API Market Size (US$ Mn) Analysis 2015-2021 and Forecast 2021-2030, by End User
Figure 22: Latin America Oligonucleotide API Market Size (US$ Mn) Analysis, 2015-2021
Figure 23: Latin America Oligonucleotide API Market Size (US$ Mn) & Y-o-Y Growth (%), 2021–2030
Figure 24: Latin America Medical America Oligonucleotide API Market Size (US$ Mn) Analysis 2015-2021 and Forecast 2021-2030, by Country
Figure 25: Latin America Medical America Oligonucleotide API Market Size (US$ Mn) Analysis 2015-2021 and Forecast 2021-2030, by API Type
Figure 26: Latin America Medical America Oligonucleotide API Market Size (US$ Mn) Analysis 2015-2021 and Forecast 2021-2030, Marketing Status
Figure 27: Latin America Medical America Oligonucleotide API Market Size (US$ Mn) Analysis 2015-2021 and Forecast 2021-2030, by End User
Figure 28: Europe Oligonucleotide API Market Size (US$ Mn) Analysis, 2015-2021
Figure 29: Europe Oligonucleotide API Market Size (US$ Mn) & Y-o-Y Growth (%), 2021–2030
Figure 30: Europe Oligonucleotide API Market Size (US$ Mn) Analysis 2015-2021 and Forecast 2021-2030, by Country
Figure 31: Europe Oligonucleotide API Market Size (US$ Mn) Analysis 2015-2021 and Forecast 2021-2030, by API Type
Figure 32: Europe Oligonucleotide API Market Size (US$ Mn) Analysis 2015-2021 and Forecast 2021-2030, Marketing Status
Figure 33: Europe Oligonucleotide API Market Size (US$ Mn) Analysis 2015-2021 and Forecast 2021-2030, by End User
Figure 34: East Asia Oligonucleotide API Market Size (US$ Mn) Analysis, 2015-2021
Figure 35: East Asia Oligonucleotide API Market Size (US$ Mn) & Y-o-Y Growth (%), 2021–2030
Figure 36: East Asia Oligonucleotide API Market Size (US$ Mn) Analysis 2015-2021 and Forecast 2021-2030, by Country
Figure 37: East Asia Oligonucleotide API Market Size (US$ Mn) Analysis 2015-2021 and Forecast 2021-2030, by API Type
Figure 38: East Asia Oligonucleotide API Market Size (US$ Mn) Analysis 2015-2021 and Forecast 2021-2030, Marketing Status
Figure 39: East Asia Oligonucleotide API Market Size (US$ Mn) Analysis 2015-2021 and Forecast 2021-2030, by End User
Figure 40: South Asia Oligonucleotide API Market Size (US$ Mn) Analysis, 2015-2021
Figure 41: South Asia Oligonucleotide API Market Size (US$ Mn) & Y-o-Y Growth (%), 2021–2030
Figure 42: South Asia Oligonucleotide API Market Size (US$ Mn) Analysis 2015-2021 and Forecast 2021-2030, by Country
Figure 43: South Asia Oligonucleotide API Market Size (US$ Mn) Analysis 2015-2021 and Forecast 2021-2030, by API Type
Figure 44: South Asia Oligonucleotide API Market Size (US$ Mn) Analysis 2015-2021 and Forecast 2021-2030, Marketing Status
Figure 45: South Asia Oligonucleotide API Market Size (US$ Mn) Analysis 2015-2021 and Forecast 2021-2030, by End User
Figure 46: Oceania Oligonucleotide API Market Size (US$ Mn) Analysis, 2015-2021
Figure 47: Oceania Oligonucleotide API Market Size (US$ Mn) & Y-o-Y Growth (%), 2021–2030
Figure 48: Oceania Oligonucleotide API Market Size (US$ Mn) Analysis 2015-2021 and Forecast 2021-2030, by Country
Figure 49: Oceania Oligonucleotide API Market Size (US$ Mn) Analysis 2015-2021 and Forecast 2021-2030, by API Type
Figure 50: Oceania Oligonucleotide API Market Size (US$ Mn) Analysis 2015-2021 and Forecast 2021-2030, Marketing Status
Figure 51: Oceania Oligonucleotide API Market Size (US$ Mn) Analysis 2015-2021 and Forecast 2021-2030, by End User
Figure 52: MEA Oligonucleotide API Market Size (US$ Mn) Analysis, 2015-2021
Figure 53: MEA Oligonucleotide API Market Size (US$ Mn) & Y-o-Y Growth (%), 2021–2030
Figure 54: MEA Oligonucleotide API Market Size (US$ Mn) Analysis 2015-2021 and Forecast 2021-2030, by Country
Figure 55: MEA Oligonucleotide API Market Size (US$ Mn) Analysis 2015-2021 and Forecast 2021-2030, by API Type
Figure 56: MEA Oligonucleotide API Market Size (US$ Mn) Analysis 2015-2021 and Forecast 2021-2030, Marketing Status
Figure 57: MEA Oligonucleotide API Market Size (US$ Mn) Analysis 2015-2021 and Forecast 2021-2030, by End User
Figure 58: China Market Value Proportion Analysis, 2021
Figure 59: China Oligonucleotide API Market Share Analysis (%) By API Type, 2021 & 2030
Figure 60: China. Oligonucleotide API Market Share Analysis (%) By Marketing Status, 2021 & 2030
Figure 61: China. Oligonucleotide API Market Share Analysis (%) By End User, 2021 & 2030
Figure 62: Global Vs. China Growth Comparison
Figure 63: India Market Value Proportion Analysis, 2021
Figure 64: India. Oligonucleotide API Market Share Analysis (%) By API Type, 2021 & 2030
Figure 65: India. Oligonucleotide API Market Share Analysis (%) By Marketing Status, 2021 & 2030
Figure 66: India. Oligonucleotide API Market Share Analysis (%) By End User, 2021 & 2030
Figure 67: Global Vs. India Growth Comparison
Figure 68: Brazil Market Value Proportion Analysis, 2021
Figure 69: Brazil. Oligonucleotide API Market Share Analysis (%) By API Type, 2021 & 2030
Figure 70: Brazil. Oligonucleotide API Market Share Analysis (%) By Marketing Status, 2021 & 2030
Figure 71: Brazil. Oligonucleotide API Market Share Analysis (%) By End User, 2021 & 2030
Figure 72: Global Vs. Brazil Growth Comparison
Figure 73: U.S Market Value Proportion Analysis, 2021
Figure 74: U.S. Oligonucleotide API Market Share Analysis (%) By API Type, 2021 & 2030
Figure 75: U.S. Oligonucleotide API Market Share Analysis (%) By Marketing Status, 2021 & 2030
Figure 76: U.S. Oligonucleotide API Market Share Analysis (%) By End User, 2021 & 2030
Figure 77: Global Vs. U.S Growth Comparison
Figure 78: Canada Market Value Proportion Analysis, 2021
Figure 79: Canada Oligonucleotide API Market Share Analysis (%) By API Type, 2021 & 2030
Figure 80: Canada Oligonucleotide API Market Share Analysis (%) By Marketing Status, 2021 & 2030
Figure 81: Canada Oligonucleotide API Market Share Analysis (%) By End User, 2021 & 2030
Figure 82: Global Vs. Canada Growth Comparison
Figure 83: Mexico Market Value Proportion Analysis, 2021
Figure 84: Mexico Oligonucleotide API Market Share Analysis (%) By API Type, 2021 & 2030
Figure 85: Mexico Oligonucleotide API Market Share Analysis (%) By Marketing Status, 2021 & 2030
Figure 86: Mexico Oligonucleotide API Market Share Analysis (%) By End User, 2021 & 2030
Figure 87: Global Vs. Mexico Growth Comparison
Figure 88: Argentina Market Value Proportion Analysis, 2021
Figure 89: Argentina Oligonucleotide API Market Share Analysis (%) By API Type, 2021 & 2030
Figure 90: Argentina Oligonucleotide API Market Share Analysis (%) By Marketing Status, 2021 & 2030
Figure 91: Argentina Oligonucleotide API Market Share Analysis (%) By End User, 2021 & 2030
Figure 92: Global Vs. Argentina Growth Comparison
Figure 93: U.K. Market Value Proportion Analysis, 2021
Figure 94: U.K. Oligonucleotide API Market Share Analysis (%) By API Type, 2021 & 2030
Figure 95: U.K. Oligonucleotide API Market Share Analysis (%) By Marketing Status, 2021 & 2030
Figure 96: U.K. Oligonucleotide API Market Share Analysis (%) By End User, 2021 & 2030
Figure 97: Global Vs. U.K Growth Comparison
Figure 98: Germany Market Value Proportion Analysis, 2021
Figure 99: Germany Oligonucleotide API Market Share Analysis (%) By API Type, 2021 & 2030
Figure 100: Germany Oligonucleotide API Market Share Analysis (%) By Marketing Status, 2021 & 2030
Figure 101: Germany Oligonucleotide API Market Share Analysis (%) By End User, 2021 & 2030
Figure 102: Global Vs. Germany Growth Comparison
Figure 103: France Market Value Proportion Analysis, 2021
Figure 104: France Oligonucleotide API Market Share Analysis (%) By API Type, 2021 & 2030
Figure 105: France Oligonucleotide API Market Share Analysis (%) By Marketing Status, 2021 & 2030
Figure 106: France Oligonucleotide API Market Share Analysis (%) By End User, 2021 & 2030
Figure 107: Global Vs. France Growth Comparison
Figure 108: Italy Market Value Proportion Analysis, 2021
Figure 109: Italy Oligonucleotide API Market Share Analysis (%) By API Type, 2021 & 2030
Figure 110: Italy Oligonucleotide API Market Share Analysis (%) By Marketing Status, 2021 & 2030
Figure 111: Italy Oligonucleotide API Market Share Analysis (%) By End User, 2021 & 2030
Figure 112: Global Vs. Italy Growth Comparison
Figure 113: Spain Market Value Proportion Analysis, 2021
Figure 114: Spain Oligonucleotide API Market Share Analysis (%) By API Type, 2021 & 2030
Figure 115: Spain Oligonucleotide API Market Share Analysis (%) By Marketing Status, 2021 & 2030
Figure 116: Spain Oligonucleotide API Market Share Analysis (%) By End User, 2021 & 2030
Figure 117: Global Vs. Spain Growth Comparison
Figure 118: Russia Market Value Proportion Analysis, 2021
Figure 119: Russia Oligonucleotide API Market Share Analysis (%) By API Type, 2021 & 2030
Figure 120: Russia Oligonucleotide API Market Share Analysis (%) By Marketing Status, 2021 & 2030
Figure 121: Russia Oligonucleotide API Market Share Analysis (%) By End User, 2021 & 2030
Figure 122: Global Vs. Russia Growth Comparison
Figure 123: Japan Market Value Proportion Analysis, 2021
Figure 124: Japan Oligonucleotide API Market Share Analysis (%) By API Type, 2021 & 2030
Figure 125: Japan Oligonucleotide API Market Share Analysis (%) By Marketing Status, 2021 & 2030
Figure 126: Japan Oligonucleotide API Market Share Analysis (%) By End User, 2021 & 2030
Figure 127: Global Vs. Japan Growth Comparison
Figure 128: South Korea Market Value Proportion Analysis, 2021
Figure 129: South Korea Oligonucleotide API Market Share Analysis (%) By API Type, 2021 & 2030
Figure 130: South Korea Oligonucleotide API Market Share Analysis (%) By Marketing Status, 2021 & 2030
Figure 131: South Korea Oligonucleotide API Market Share Analysis (%) By End User, 2021 & 2030
Figure 132: Global Vs. South Korea Growth Comparison
Figure 133: Indonesia Market Value Proportion Analysis, 2021
Figure 134: Indonesia Oligonucleotide API Market Share Analysis (%) By API Type, 2021 & 2030
Figure 135: Indonesia Oligonucleotide API Market Share Analysis (%) By Marketing Status, 2021 & 2030
Figure 136: Indonesia Oligonucleotide API Market Share Analysis (%) By End User, 2021 & 2030
Figure 137: Global Vs. Indonesia Growth Comparison
Figure 138: Malaysia Market Value Proportion Analysis, 2021
Figure 139: Malaysia Oligonucleotide API Market Share Analysis (%) By API Type, 2021 & 2030
Figure 140: Malaysia Oligonucleotide API Market Share Analysis (%) By Marketing Status, 2021 & 2030
Figure 141: Malaysia Oligonucleotide API Market Share Analysis (%) By End User, 2021 & 2030
Figure 142: Global Vs. Malaysia Growth Comparison
Figure 143: Thailand Market Value Proportion Analysis, 2021
Figure 144: Thailand Oligonucleotide API Market Share Analysis (%) By API Type, 2021 & 2030
Figure 145: Thailand Oligonucleotide API Market Share Analysis (%) By Marketing Status, 2021 & 2030
Figure 146: Thailand Oligonucleotide API Market Share Analysis (%) By End User, 2021 & 2030
Figure 147: Global Vs. Thailand Growth Comparison
Figure 148: Australia Market Value Proportion Analysis, 2021
Figure 149: Australia Oligonucleotide API Market Share Analysis (%) By API Type, 2021 & 2030
Figure 150: Australia Oligonucleotide API Market Share Analysis (%) By Marketing Status, 2021 & 2030
Figure 151: Australia Oligonucleotide API Market Share Analysis (%) By End User, 2021 & 2030
Figure 152: Global Vs. Australia Growth Comparison
Figure 153: New Zealand Market Value Proportion Analysis, 2021
Figure 154: New Zealand Oligonucleotide API Market Share Analysis (%) By API Type, 2021 & 2030
Figure 155: New Zealand Oligonucleotide API Market Share Analysis (%) By Marketing Status, 2021 & 2030
Figure 156: New Zealand Oligonucleotide API Market Share Analysis (%) By End User, 2021 & 2030
Figure 157: Global Vs. New Zealand Growth Comparison
Figure 158: South Africa Market Value Proportion Analysis, 2021
Figure 159: South Africa Oligonucleotide API Market Share Analysis (%) By API Type, 2021 & 2030
Figure 160: South Africa Oligonucleotide API Market Share Analysis (%) By Marketing Status, 2021 & 2030
Figure 161: South Africa Oligonucleotide API Market Share Analysis (%) By End User, 2021 & 2030
Figure 162: Global Vs. South Africa Growth Comparison
Figure 163: GCC Countries Market Value Proportion Analysis, 2021
Figure 164: GCC Countries Oligonucleotide API Market Share Analysis (%) By API Type, 2021 & 2030
Figure 165: GCC Countries Oligonucleotide API Market Share Analysis (%) By Marketing Status, 2021 & 2030
Figure 166: GCC Countries Oligonucleotide API Market Share Analysis (%) By End User, 2021 & 2030
Figure 167: Global Vs. GCC Countries Growth Comparison
Need specific information?
Request CustomizationExplore Healthcare Insights
View Reports