Oxytocic Pharmaceuticals Market Size, Share, and Forecast Outlook 2025 to 2035

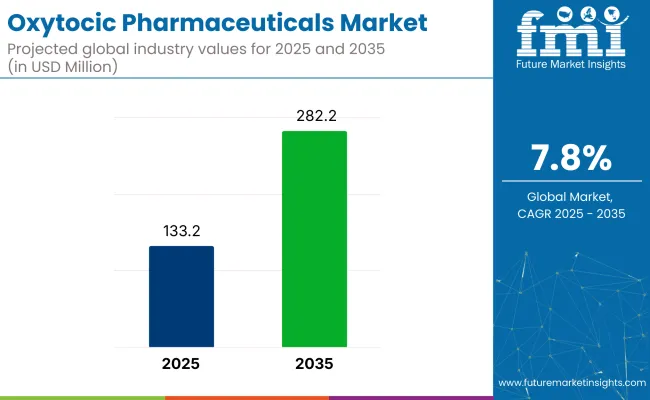
The oxytocic pharmaceuticals market is expected to grow significantly, nearly doubling in size from USD 133.2 million in 2025 to USD 282.2 million by 2035 at a CAGR of 7.8% during the forecast period. This growth is primarily driven by the increasing number of childbirths requiring medical intervention and global efforts to reduce maternal mortality. There is a notable rise in institutional births, particularly in regions such as South Asia and Sub-Saharan Africa, which is increasing the demand for uterotonic drugs essential for maternal care protocols.
Quick Stats of the Oxytocic Pharmaceuticals Market

  • Market Value (2025): USD 133.2 million
  • Forecast Value (2035): USD 282.2 million
  • CAGR: 7.8%
  • Leading Segment in 2035: Synthetic oxytocin (89.3% share)
  • Key Growth Region: Asia (India, China)
  • Key Players: Pfizer Inc., Ferring Pharmaceuticals, Fresenius Kabi AG, Novartis AG, Teva Pharmaceutical Industries Ltd.

Oxytocic Pharmaceuticals Market

Injectable oxytocics, like oxytocin, remain the standard treatment for preventing postpartum hemorrhage (PPH), the leading cause of maternal deaths globally. The use of these agents is supported by World Health Organization (WHO) guidelines, which recommend active management of the third stage of labor. Furthermore, the increasing prevalence of high-risk pregnancies and cesarean deliveries further amplifies the need for safe and effective uterotonics.

The market is also undergoing innovation, particularly in drug formulation and delivery. In November 2024, Insud Pharma secured a USD 2.7 million grant from the Bill & Melinda Gates Foundation to fund Phase II clinical trials for a thermostable sublingual oxytocin tablet. This development aims to eliminate cold chain dependency, a significant barrier in low-resource settings, offering a more accessible solution for maternal care.

North America and Europe continue to be key markets due to their advanced healthcare infrastructure, while regions like Asia Pacific and Latin America experience the fastest growth, driven by public health reforms and expanding access to maternal healthcare services.

Analyzing Oxytocic Pharmaceuticals Market by Top Investment Segments

Synthetic oxytocin will lead the industry in 2025 due to quick action and clinical reliability, holding 89.3% share. Postpartum hemorrhage management will dominate applications with 42.5% share, driven by global maternal health priorities, rising cesarean rates, WHO recommendations, and expanded access through public health programs and product innovations.

Synthetic Oxytocin Dominates the Oxytocic Pharmaceuticals Market with Proven Efficacy and Global Acceptance

Synthetic oxytocin is expected to dominate the industry in 2025, accounting for 89.3% of the total revenue.

  • Demand is attributed to its proven efficacy, cost-effectiveness, and widespread clinical acceptance in obstetric care. Known for its rapid onset and predictable pharmacokinetics, synthetic oxytocin is preferred for inducing labor and preventing postpartum hemorrhage. Its inclusion in the WHO’s List of Essential Medicines ensures availability in both developed and emerging economies.
  • Global standardization of manufacturing practices and regulatory approvals have reinforced trust in synthetic oxytocin, while innovations like heat-stable formulations have increased accessibility in low-resource regions. This combination of affordability, reliability, and support from maternal health initiatives has made synthetic oxytocin the most widely used option in clinical practice worldwide.

PPH Management to Dominate Oxytocic Market Applications in 2025

Postpartum hemorrhage (PPH) management is expected to capture 42.5% of the industry in 2025, making it the leading application segment.
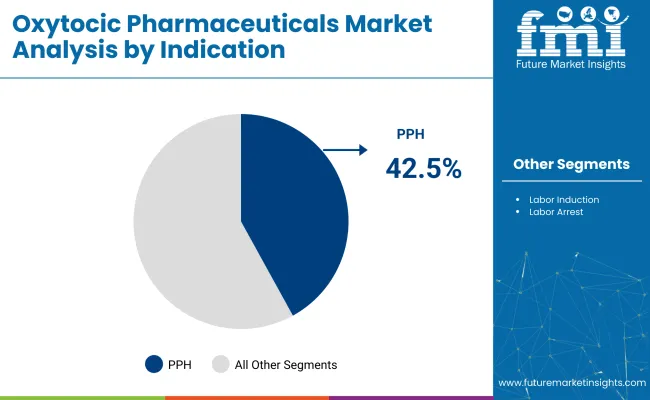
  • PPH is a major contributor to maternal mortality, especially in low- and middle-income countries. Oxytocic agents like oxytocin, carbetocin, and misoprostol are central to global treatment protocols and are recommended by WHO. The increase in cesarean deliveries has further elevated demand for effective hemorrhage control.
  • National healthcare programs in countries like India, Ethiopia, and Brazil are expanding oxytocic access through public health systems. Companies such as Novartis and Gland Pharma are strengthening supply chains to meet this demand. Additionally, innovations like auto-injectors and transdermal patches are improving administration in low-infrastructure settings.

Oxytocic Pharmaceuticals Market Analysis By Indication

Intravenous Infusion/Injection dominates route of administration

Intravenous infusion/injection will continue to lead the route of administration segment, accounting for 60% of the industry in 2025.

  • Intravenous infusion method is preferred in clinical settings due to its rapid onset of action and precise control over dosage. Major players like Fresenius Kabi and Pfizer are innovating their formulations to enhance stability and reduce side effects.
  • Ongoing R&D efforts are focused on improving the shelf life and ease of use of injectable oxytocin, especially in labor induction and postpartum hemorrhage. As global maternal health standards rise, intravenous infusion will remain the most trusted and effective method for administering oxytocin in hospitals.

Hospitals dominate end-user demand

Hospitals will remain the largest end-user segment, accounting for 75% of industry demand in 2025.

  • Demand from hospital is driven by the high volume of oxytocin used for obstetric care in labor and delivery wards. Ferring Pharmaceuticals and Teva Pharmaceuticals lead the way in providing oxytocin formulations for hospital use.
  • As maternal health care becomes more regulated, hospitals continue to invest in more efficient, safe, and accessible oxytocin administration methods. With global healthcare infrastructure improving and increasing maternal care awareness, hospitals will maintain a dominant position in the industry for oxytocic pharmaceuticals.

Top Oxytocic Pharmaceuticals Market Dynamics

Heightened Childbirth Complications Drive Advanced Uterotonic Demand

Globally, the incidence of high-risk pregnancies is rising, with more deliveries taking place in hospitals due to public health reforms. Oxytocin and carbetocin are increasingly used in institutional births. WHO trials in Kenya and Nigeria have proven heat-stable carbetocin’s efficacy in low-resource settings. Ferring Pharmaceuticals launched pre-filled oxytocin injectables. With rising labor induction rates in the USA and India, demand for safer uterotonics is reinforced by WHO guidelines, and cesarean delivery rates surpass 30% globally.

Cold Chain Limitations and Adverse Effects Challenge Market Expansion

Oxytocin requires storage between 2-8°C, posing challenges in rural clinics without cold chain infrastructure. Traditional formulations degrade quickly under heat, reducing therapeutic efficacy. Regulatory bodies remain cautious about approving analogs due to risks like uterine rupture from incorrect dosing. WHO issued warnings on overuse during community births in 2023. Poor access in Tier 3 towns is caused by logistical gaps, while high costs and training barriers limit the rollout of newer variants. Misoprostol’s adverse reactions further slow industry expansion.

Analyzing the Top Countries That Formulate, Distribute, and Supply Oxytocic Pharmaceuticals

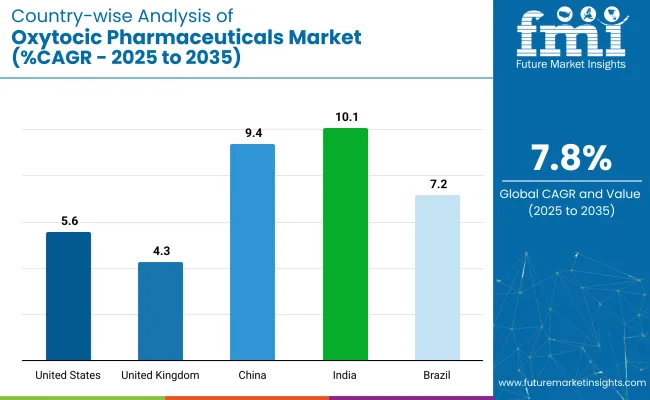
The industry is expanding across key countries, driven by rising institutional births, government healthcare initiatives, and adoption of heat stable formulations. India leads with the highest growth, followed by China and Brazil. Public sector engagement, local manufacturing, and digital healthcare integration are fueling global industry momentum.
Country Wise Analysis Of Oxytocic Pharmaceuticals Market

Country CAGR (2025 to 2035)
United States 5.6%
United Kingdom 4.3%
China 9.4%
India 10.1%
Brazil 7.2%

United States Oxytocic Pharmaceuticals Market Growth

The United States industry is set to grow at a CAGR of 5.6% from 2025 to 2035.

  • Over 98% of births occur in hospitals, supporting steady demand for labor-inducing drugs like Pitocin. FDA approval of heat stable oxytocin in 2024 has expanded access in rural and emergency settings. Leading firms such as Pfizer and Baxter drive industry leadership through established supply networks.
  • Prefilled syringes and simplified delivery formats improve clinical safety. Medicaid and Medicare coverage ensures widespread usage. Digital labor monitoring systems support accurate dosing. Regulatory backing and strong infrastructure make the USA a consistent performer in the global industry.

United Kingdom Oxytocic Pharmaceuticals Market Drivers

The United Kingdom industry is expected to grow at a CAGR of 4.3% between 2025 and 2035.

  • Oxytocin is standard in NHS hospitals for labor induction and postpartum hemorrhage treatment. Ferring’s Syntocinon is widely adopted. A trained midwifery network ensures consistent use across regions. Technological advancements, including fetal monitoring systems, enhance labor care.
  • Centralized NHS procurement ensures uniform drug availability and cost control. Rising birth rates among migrant populations are broadening demand. Government focus on reducing maternal morbidity further strengthens industry stability. With structured healthcare delivery, policy support, and proven clinical protocols, the UK remains a key player in the oxytocic space.

China Oxytocic Pharmaceuticals Market Analysis

The industry in China is projected to grow at a CAGR of 9.4% from 2025 to 2035.

  • Under Healthy China 2030, maternal health infrastructure is expanding across urban and rural regions. Cesarean rates near 36% are increasing oxytocin and carbetocin demand. Domestic firms like Changzhou Siyao are scaling up production. Heat stable formulations are addressing cold chain challenges. Government health programs are supporting institutional delivery expansion.
  • E commerce and digital drug distribution are improving last mile access. Automated hospital dispensing systems are being deployed in major cities. With robust public funding, policy reform, and digital penetration, China is emerging as a strong growth industry for oxytocics.

India Oxytocic Pharmaceuticals Market Expansion

The industry in India is forecast to grow at a CAGR of 10.1% from 2025 to 2035, the highest among major markets.

  • Programs like Janani Suraksha Yojana and LaQshya are boosting institutional births. Cipla and Gland Pharma are leading local manufacturers of heat stable oxytocin for use in regions lacking refrigeration. Government policy ensures oxytocin is listed as essential, supporting national supply chains.
  • High birth rate states such as Uttar Pradesh and Bihar are targeted for distribution. WHO guidelines and trained auxiliary nurses are ensuring proper use. Combined with public sector investment and efficient delivery networks, India leads global oxytocic industry expansion.

Brazil Oxytocic Pharmaceuticals Market Overview

The Brazil industry is expected to grow at a CAGR of 7.2% from 2025 to 2035.

  • Oxytocin is available in over 90% of maternity hospitals through the Sistema Unico de Saude public health system. Usage is high for labor induction and PPH prevention. Urban hospitals are equipped to administer injectables. Domestic firms are increasing production while partnering with multinationals to introduce new formulations.
  • National procurement systems streamline distribution and pricing. Training programs are improving safe drug use. Government-backed maternal mortality reduction campaigns are also contributing to demand. Brazil’s public policy and urban healthcare capacity make it a strong industry for oxytocic drugs.

Leading Oxytocic Pharmaceuticals Suppliers

The global industry is characterized by dominant players, key players, and emerging players. Dominant players such as Pfizer Inc., Ferring Pharmaceuticals, and Novartis AG lead the industry with extensive product portfolios, strong R&D capabilities, and robust distribution networks across maternal healthcare sectors.

Key players including Hikma Pharmaceuticals, Sun Pharmaceutical, Teva Pharmaceuticals, Cipla Ltd., and Mylan N.V. offer specialized oxytocic formulations, catering to regional markets and specific therapeutic needs. Emerging players like Fresenius Kabi and Baxter International focus on innovative delivery systems and cost-effective solutions, expanding their presence in the global industry.

Recent Oxytocic Pharmaceuticals Industry News

  • The official release by Unitaid states, the World Health Organization, in collaboration with Ferring Pharmaceuticals and Unitaid, launched the REACH trial in 2023 to evaluate heat-stable carbetocin (HSC) for the treatment of postpartum hemorrhage (PPH). Unlike oxytocin, HSC does not require refrigeration, making it ideal for low-resource settings.
  • In 2025, a sublingual oxytocin tablet formulation designed to prevent postpartum hemorrhage is being developed in collaboration with Insud Pharma. The formulation is thermostable, eliminating the need for refrigeration. Clinical trials for this product are expected to begin in early 2025.

Leading Oxytocic Pharmaceuticals Market Players

  • Pfizer Inc.
  • Ferring Pharmaceuticals
  • Novartis AG
  • Hikma Pharmaceuticals
  • Sun Pharmaceutical
  • Teva Pharmaceuticals
  • Cipla Ltd.
  • Mylan N.V.
  • Fresenius Kabi
  • Baxter International

Report Scope - Oxytocic Pharmaceuticals Market

Report Attributes Details
Industry Size (2025) USD 133.2 million
Projected Industry Size (2035) USD 282.2 million
CAGR (2025 to 2035) 7.8%
Base Year for Estimation 2024
Historical Period 2020 to 2024
Projections Period 2025 to 2035
Quantitative Units USD million for value and thousand units for volume
Product Types Analyzed (Segment 1) Natural Oxytocin, Synthetic Oxytocin
Indications Analyzed (Segment 2) Abortion Induced Incomplete, Inevitable Abortion, Postpartum Hemorrhage , Labor Induction, Labor Arrest
Routes of Administration Analyzed (Segment 3) Intravenous Infusion/Injection, Intramuscular Injection
End Users Analyzed (Segment 4) Hospitals, Maternity Clinics
Regions Covered North America; Latin America; Western Europe; Eastern Europe; East Asia; South Asia & Pacific; Middle East & Africa
Countries Covered United States, Canada, Brazil, Mexico, Germany, France, United Kingdom, Italy, Spain, China, India, Japan, South Korea, Australia, GCC Countries, South Africa
Key Players influencing the Industry Pfizer Inc., Ferring Pharmaceuticals, Novartis AG, Hikma Pharmaceuticals, Sun Pharmaceutical, Teva Pharmaceuticals, Cipla Ltd., Mylan N.V., Fresenius Kabi , Baxter International, Others
Additional Attributes Dollar sales by product type (natural vs. synthetic), Demand trends in labor induction and PPH treatment, Hospital vs. maternity clinic adoption, Regional gaps in oxytocic availability, Intravenous vs. intramuscular efficacy landscape, Role of oxytocics in maternal care programs

Key Segments Studied in the Oxytocic Pharmaceuticals Market

By Product Type:

The industry is segmented into natural oxytocin and synthetic oxytocin.

By Indication:

The industry is segmented into abortion induced incomplete, inevitable abortion, postpartum hemorrhage, labor induction, and labor arrest.

By Route of Administration:

The industry is segmented into intravenous infusion or injection and intramuscular injection.

By End User:

The industry is segmented into hospitals and maternity clinics.

By Region:

The industry is segmented into North America, Latin America, Western Europe, Eastern Europe, East Asia, South Asia and Pacific, and Middle East and Africa.

Table of Content

  1. Executive Summary
    • Global Market Outlook
    • Demand-side Trends
    • Supply-side Trends
    • Technology Roadmap Analysis
    • Analysis and Recommendations
  2. Market Overview
    • Market Coverage / Taxonomy
    • Market Definition / Scope / Limitations
  3. Market Background
    • Market Dynamics
      • Drivers
      • Restraints
      • Opportunity
      • Trends
    • Scenario Forecast
      • Demand in Optimistic Scenario
      • Demand in Likely Scenario
      • Demand in Conservative Scenario
    • Opportunity Map Analysis
    • Product Life Cycle Analysis
    • Supply Chain Analysis
      • Supply Side Participants and their Roles
        • Producers
        • Mid-Level Participants (Traders/ Agents/ Brokers)
        • Wholesalers and Distributors
      • Value Added and Value Created at Node in the Supply Chain
      • List of Raw Material Suppliers
      • List of Existing and Potential Buyer’s
    • Investment Feasibility Matrix
    • Value Chain Analysis
      • Profit Margin Analysis
      • Wholesalers and Distributors
      • Retailers
    • PESTLE and Porter’s Analysis
    • Regulatory Landscape
      • By Key Regions
      • By Key Countries
    • Regional Parent Market Outlook
    • Production and Consumption Statistics
    • Import and Export Statistics
  4. Global Market Analysis 2020 to 2024 and Forecast, 2025 to 2035
    • Historical Market Size Value (USD Million) & Volume (Thousand units) Analysis, 2020 to 2024
    • Current and Future Market Size Value (USD Million) & Volume (Thousand units) Projections, 2025 to 2035
      • Y-o-Y Growth Trend Analysis
      • Absolute $ Opportunity Analysis
  5. Global Market Pricing Analysis 2020 to 2024 and Forecast 2025 to 2035
  6. Global Market Analysis 2020 to 2024 and Forecast 2025 to 2035, By Product Type
    • Introduction / Key Findings
    • Historical Market Size Value (USD Million) & Volume (Thousand units) Analysis By Product Type, 2020 to 2024
    • Current and Future Market Size Value (USD Million) & Volume (Thousand units) Analysis and Forecast By Product Type, 2025 to 2035
      • Natural Oxytocin
      • Synthetic Oxytocin
    • Y-o-Y Growth Trend Analysis By Product Type, 2020 to 2024
    • Absolute $ Opportunity Analysis By Product Type, 2025 to 2035
  7. Global Market Analysis 2020 to 2024 and Forecast 2025 to 2035, By Indication
    • Introduction / Key Findings
    • Historical Market Size Value (USD Million) & Volume (Thousand units) Analysis By Indication, 2020 to 2024
    • Current and Future Market Size Value (USD Million) & Volume (Thousand units) Analysis and Forecast By Indication, 2025 to 2035
      • Abortion Induced Incomplete
      • Inevitable Abortion
      • Postpartum Haemorrhage
      • Labor Induction
      • Labor Arrest
    • Y-o-Y Growth Trend Analysis By Indication, 2020 to 2024
    • Absolute $ Opportunity Analysis By Indication, 2025 to 2035
  8. Global Market Analysis 2020 to 2024 and Forecast 2025 to 2035, By Route of Administration
    • Introduction / Key Findings
    • Historical Market Size Value (USD Million) & Volume (Thousand units) Analysis By Route of Administration, 2020 to 2024
    • Current and Future Market Size Value (USD Million) & Volume (Thousand units) Analysis and Forecast By Route of Administration, 2025 to 2035
      • Intravenous Infusion/Injection
      • Intramuscular Injection
    • Y-o-Y Growth Trend Analysis By Route of Administration, 2020 to 2024
    • Absolute $ Opportunity Analysis By Route of Administration, 2025 to 2035
  9. Global Market Analysis 2020 to 2024 and Forecast 2025 to 2035, By End User
    • Introduction / Key Findings
    • Historical Market Size Value (USD Million) & Volume (Thousand units) Analysis By End User, 2020 to 2024
    • Current and Future Market Size Value (USD Million) & Volume (Thousand units) Analysis and Forecast By End User, 2025 to 2035
      • Hospitals
      • Maternity Clinics
    • Y-o-Y Growth Trend Analysis By End User, 2020 to 2024
    • Absolute $ Opportunity Analysis By End User, 2025 to 2035
  10. Global Market Analysis 2020 to 2024 and Forecast 2025 to 2035, By Region
    • Introduction
    • Historical Market Size Value (USD Million) & Volume (Thousand units) Analysis By Region, 2020 to 2024
    • Current Market Size Value (USD Million) & Volume (Thousand units) Analysis and Forecast By Region, 2025 to 2035
      • North America
      • Latin America
      • Western Europe
      • Eastern Europe
      • East Asia
      • South Asia & Pacific
      • Middle East and Africa
    • Market Attractiveness Analysis By Region
  11. North America Market Analysis 2020 to 2024 and Forecast 2025 to 2035, By Country
    • Historical Market Size Value (USD Million) & Volume (Thousand units) Trend Analysis By Market Taxonomy, 2020 to 2024
    • Market Size Value (USD Million) & Volume (Thousand units) Forecast By Market Taxonomy, 2025 to 2035
      • By Country
        • USA
        • Canada
        • Mexico
      • By Product Type
      • By Indication
      • By Route of Administration
      • By End User
    • Market Attractiveness Analysis
      • By Country
      • By Product Type
      • By Indication
      • By Route of Administration
      • By End User
    • Key Takeaways
  12. Latin America Market Analysis 2020 to 2024 and Forecast 2025 to 2035, By Country
    • Historical Market Size Value (USD Million) & Volume (Thousand units) Trend Analysis By Market Taxonomy, 2020 to 2024
    • Market Size Value (USD Million) & Volume (Thousand units) Forecast By Market Taxonomy, 2025 to 2035
      • By Country
        • Brazil
        • Argentina
        • Rest of LATAM
      • By Product Type
      • By Indication
      • By Route of Administration
      • By End User
    • Market Attractiveness Analysis
      • By Country
      • By Product Type
      • By Indication
      • By Route of Administration
      • By End User
    • Key Takeaways
  13. Western Europe Market Analysis 2020 to 2024 and Forecast 2025 to 2035, By Country
    • Historical Market Size Value (USD Million) & Volume (Thousand units) Trend Analysis By Market Taxonomy, 2020 to 2024
    • Market Size Value (USD Million) & Volume (Thousand units) Forecast By Market Taxonomy, 2025 to 2035
      • By Country
        • Germany
        • Italy
        • France
        • UK
        • Spain
        • BENELUX
        • Nordic
        • Rest of W.Europe
      • By Product Type
      • By Indication
      • By Route of Administration
      • By End User
    • Market Attractiveness Analysis
      • By Country
      • By Product Type
      • By Indication
      • By Route of Administration
      • By End User
    • Key Takeaways
  14. Eastern Europe Market Analysis 2020 to 2024 and Forecast 2025 to 2035, By Country
    • Historical Market Size Value (USD Million) & Volume (Thousand units) Trend Analysis By Market Taxonomy, 2020 to 2024
    • Market Size Value (USD Million) & Volume (Thousand units) Forecast By Market Taxonomy, 2025 to 2035
      • By Country
        • Russia
        • Hungary
        • Poland
        • Balkan & Baltics
        • Rest of E. Europe
      • By Product Type
      • By Indication
      • By Route of Administration
      • By End User
    • Market Attractiveness Analysis
      • By Country
      • By Product Type
      • By Indication
      • By Route of Administration
      • By End User
    • Key Takeaways
  15. East Asia Market Analysis 2020 to 2024 and Forecast 2025 to 2035, By Country
    • Historical Market Size Value (USD Million) & Volume (Thousand units) Trend Analysis By Market Taxonomy, 2020 to 2024
    • Market Size Value (USD Million) & Volume (Thousand units) Forecast By Market Taxonomy, 2025 to 2035
      • By Country
        • China
        • Japan
        • South Korea
      • By Product Type
      • By Indication
      • By Route of Administration
      • By End User
    • Market Attractiveness Analysis
      • By Country
      • By Product Type
      • By Indication
      • By Route of Administration
      • By End User
    • Key Takeaways
  16. South Asia & Pacific Market Analysis 2020 to 2024 and Forecast 2025 to 2035, By Country
    • Historical Market Size Value (USD Million) & Volume (Thousand units) Trend Analysis By Market Taxonomy, 2020 to 2024
    • Market Size Value (USD Million) & Volume (Thousand units) Forecast By Market Taxonomy, 2025 to 2035
      • By Country
        • India
        • Australia & New Zealand
        • ASEAN
        • Rest of SAP
      • By Product Type
      • By Indication
      • By Route of Administration
      • By End User
    • Market Attractiveness Analysis
      • By Country
      • By Product Type
      • By Indication
      • By Route of Administration
      • By End User
    • Key Takeaways
  17. Middle East and Africa Market Analysis 2020 to 2024 and Forecast 2025 to 2035, By Country
    • Historical Market Size Value (USD Million) & Volume (Thousand units) Trend Analysis By Market Taxonomy, 2020 to 2024
    • Market Size Value (USD Million) & Volume (Thousand units) Forecast By Market Taxonomy, 2025 to 2035
      • By Country
        • GCC Countries
        • Northern Africa
        • South Africa
        • Turkiye
        • Rest of MEA
      • By Product Type
      • By Indication
      • By Route of Administration
      • By End User
    • Market Attractiveness Analysis
      • By Country
      • By Product Type
      • By Indication
      • By Route of Administration
      • By End User
    • Key Takeaways
  18. Key Countries Market Analysis
    • USA
      • Pricing Analysis
      • Market Share Analysis, 2024
        • By Product Type
        • By Indication
        • By Route of Administration
        • By End User
    • Canada
      • Pricing Analysis
      • Market Share Analysis, 2024
        • By Product Type
        • By Indication
        • By Route of Administration
        • By End User
    • Brazil
      • Pricing Analysis
      • Market Share Analysis, 2024
        • By Product Type
        • By Indication
        • By Route of Administration
        • By End User
    • Mexico
      • Pricing Analysis
      • Market Share Analysis, 2024
        • By Product Type
        • By Indication
        • By Route of Administration
        • By End User
    • Argentina
      • Pricing Analysis
      • Market Share Analysis, 2024
        • By Product Type
        • By Indication
        • By Route of Administration
        • By End User
  19. Market Structure Analysis
    • Competition Dashboard
    • Competition Benchmarking
    • Market Share Analysis of Top Players
      • By Regional
      • By Product Type
      • By Indication
      • By Route of Administration
      • By End User
  20. Competition Analysis
    • Competition Deep Dive
      • Pfizer Inc.
        • Overview
        • Product Portfolio
        • Profitability by Market Segments (Product/Age /Sales Channel/Region)
        • Sales Footprint
        • Strategy Overview
          • Marketing Strategy
          • Product Strategy
          • Channel Strategy
      • Ferring Pharmaceuticals
        • Overview
        • Product Portfolio
        • Profitability by Market Segments (Product/Age /Sales Channel/Region)
        • Sales Footprint
        • Strategy Overview
          • Marketing Strategy
          • Product Strategy
          • Channel Strategy
      • Novartis AG
        • Overview
        • Product Portfolio
        • Profitability by Market Segments (Product/Age /Sales Channel/Region)
        • Sales Footprint
        • Strategy Overview
          • Marketing Strategy
          • Product Strategy
          • Channel Strategy
      • Hikma Pharmaceuticals
        • Overview
        • Product Portfolio
        • Profitability by Market Segments (Product/Age /Sales Channel/Region)
        • Sales Footprint
        • Strategy Overview
          • Marketing Strategy
          • Product Strategy
          • Channel Strategy
      • Sun Pharmaceutical
        • Overview
        • Product Portfolio
        • Profitability by Market Segments (Product/Age /Sales Channel/Region)
        • Sales Footprint
        • Strategy Overview
          • Marketing Strategy
          • Product Strategy
          • Channel Strategy
      • Teva Pharmaceuticals
        • Overview
        • Product Portfolio
        • Profitability by Market Segments (Product/Age /Sales Channel/Region)
        • Sales Footprint
        • Strategy Overview
          • Marketing Strategy
          • Product Strategy
          • Channel Strategy
      • Cipla Ltd.
        • Overview
        • Product Portfolio
        • Profitability by Market Segments (Product/Age /Sales Channel/Region)
        • Sales Footprint
        • Strategy Overview
          • Marketing Strategy
          • Product Strategy
          • Channel Strategy
      • Mylan N.V.
        • Overview
        • Product Portfolio
        • Profitability by Market Segments (Product/Age /Sales Channel/Region)
        • Sales Footprint
        • Strategy Overview
          • Marketing Strategy
          • Product Strategy
          • Channel Strategy
      • Fresenius Kabi
        • Overview
        • Product Portfolio
        • Profitability by Market Segments (Product/Age /Sales Channel/Region)
        • Sales Footprint
        • Strategy Overview
          • Marketing Strategy
          • Product Strategy
          • Channel Strategy
      • Baxter International
        • Overview
        • Product Portfolio
        • Profitability by Market Segments (Product/Age /Sales Channel/Region)
        • Sales Footprint
        • Strategy Overview
          • Marketing Strategy
          • Product Strategy
          • Channel Strategy
  21. Assumptions & Acronyms Used
  22. Research Methodology

List of Tables

  • Table 1: Global Market Value (USD Million) Forecast by Region, 2020 to 2035
  • Table 2: Global Market Volume (Thousand units) Forecast by Region, 2020 to 2035
  • Table 3: Global Market Value (USD Million) Forecast by Product Type, 2020 to 2035
  • Table 4: Global Market Volume (Thousand units) Forecast by Product Type, 2020 to 2035
  • Table 5: Global Market Value (USD Million) Forecast by Indication, 2020 to 2035
  • Table 6: Global Market Volume (Thousand units) Forecast by Indication, 2020 to 2035
  • Table 7: Global Market Value (USD Million) Forecast by Route of Administration, 2020 to 2035
  • Table 8: Global Market Volume (Thousand units) Forecast by Route of Administration, 2020 to 2035
  • Table 9: Global Market Value (USD Million) Forecast by End User, 2020 to 2035
  • Table 10: Global Market Volume (Thousand units) Forecast by End User, 2020 to 2035
  • Table 11: North America Market Value (USD Million) Forecast by Country, 2020 to 2035
  • Table 12: North America Market Volume (Thousand units) Forecast by Country, 2020 to 2035
  • Table 13: North America Market Value (USD Million) Forecast by Product Type, 2020 to 2035
  • Table 14: North America Market Volume (Thousand units) Forecast by Product Type, 2020 to 2035
  • Table 15: North America Market Value (USD Million) Forecast by Indication, 2020 to 2035
  • Table 16: North America Market Volume (Thousand units) Forecast by Indication, 2020 to 2035
  • Table 17: North America Market Value (USD Million) Forecast by Route of Administration, 2020 to 2035
  • Table 18: North America Market Volume (Thousand units) Forecast by Route of Administration, 2020 to 2035
  • Table 19: North America Market Value (USD Million) Forecast by End User, 2020 to 2035
  • Table 20: North America Market Volume (Thousand units) Forecast by End User, 2020 to 2035
  • Table 21: Latin America Market Value (USD Million) Forecast by Country, 2020 to 2035
  • Table 22: Latin America Market Volume (Thousand units) Forecast by Country, 2020 to 2035
  • Table 23: Latin America Market Value (USD Million) Forecast by Product Type, 2020 to 2035
  • Table 24: Latin America Market Volume (Thousand units) Forecast by Product Type, 2020 to 2035
  • Table 25: Latin America Market Value (USD Million) Forecast by Indication, 2020 to 2035
  • Table 26: Latin America Market Volume (Thousand units) Forecast by Indication, 2020 to 2035
  • Table 27: Latin America Market Value (USD Million) Forecast by Route of Administration, 2020 to 2035
  • Table 28: Latin America Market Volume (Thousand units) Forecast by Route of Administration, 2020 to 2035
  • Table 29: Latin America Market Value (USD Million) Forecast by End User, 2020 to 2035
  • Table 30: Latin America Market Volume (Thousand units) Forecast by End User, 2020 to 2035
  • Table 31: Western Europe Market Value (USD Million) Forecast by Country, 2020 to 2035
  • Table 32: Western Europe Market Volume (Thousand units) Forecast by Country, 2020 to 2035
  • Table 33: Western Europe Market Value (USD Million) Forecast by Product Type, 2020 to 2035
  • Table 34: Western Europe Market Volume (Thousand units) Forecast by Product Type, 2020 to 2035
  • Table 35: Western Europe Market Value (USD Million) Forecast by Indication, 2020 to 2035
  • Table 36: Western Europe Market Volume (Thousand units) Forecast by Indication, 2020 to 2035
  • Table 37: Western Europe Market Value (USD Million) Forecast by Route of Administration, 2020 to 2035
  • Table 38: Western Europe Market Volume (Thousand units) Forecast by Route of Administration, 2020 to 2035
  • Table 39: Western Europe Market Value (USD Million) Forecast by End User, 2020 to 2035
  • Table 40: Western Europe Market Volume (Thousand units) Forecast by End User, 2020 to 2035
  • Table 41: Eastern Europe Market Value (USD Million) Forecast by Country, 2020 to 2035
  • Table 42: Eastern Europe Market Volume (Thousand units) Forecast by Country, 2020 to 2035
  • Table 43: Eastern Europe Market Value (USD Million) Forecast by Product Type, 2020 to 2035
  • Table 44: Eastern Europe Market Volume (Thousand units) Forecast by Product Type, 2020 to 2035
  • Table 45: Eastern Europe Market Value (USD Million) Forecast by Indication, 2020 to 2035
  • Table 46: Eastern Europe Market Volume (Thousand units) Forecast by Indication, 2020 to 2035
  • Table 47: Eastern Europe Market Value (USD Million) Forecast by Route of Administration, 2020 to 2035
  • Table 48: Eastern Europe Market Volume (Thousand units) Forecast by Route of Administration, 2020 to 2035
  • Table 49: Eastern Europe Market Value (USD Million) Forecast by End User, 2020 to 2035
  • Table 50: Eastern Europe Market Volume (Thousand units) Forecast by End User, 2020 to 2035
  • Table 51: East Asia Market Value (USD Million) Forecast by Country, 2020 to 2035
  • Table 52: East Asia Market Volume (Thousand units) Forecast by Country, 2020 to 2035
  • Table 53: East Asia Market Value (USD Million) Forecast by Product Type, 2020 to 2035
  • Table 54: East Asia Market Volume (Thousand units) Forecast by Product Type, 2020 to 2035
  • Table 55: East Asia Market Value (USD Million) Forecast by Indication, 2020 to 2035
  • Table 56: East Asia Market Volume (Thousand units) Forecast by Indication, 2020 to 2035
  • Table 57: East Asia Market Value (USD Million) Forecast by Route of Administration, 2020 to 2035
  • Table 58: East Asia Market Volume (Thousand units) Forecast by Route of Administration, 2020 to 2035
  • Table 59: East Asia Market Value (USD Million) Forecast by End User, 2020 to 2035
  • Table 60: East Asia Market Volume (Thousand units) Forecast by End User, 2020 to 2035
  • Table 61: South Asia & Pacific Market Value (USD Million) Forecast by Country, 2020 to 2035
  • Table 62: South Asia & Pacific Market Volume (Thousand units) Forecast by Country, 2020 to 2035
  • Table 63: South Asia & Pacific Market Value (USD Million) Forecast by Product Type, 2020 to 2035
  • Table 64: South Asia & Pacific Market Volume (Thousand units) Forecast by Product Type, 2020 to 2035
  • Table 65: South Asia & Pacific Market Value (USD Million) Forecast by Indication, 2020 to 2035
  • Table 66: South Asia & Pacific Market Volume (Thousand units) Forecast by Indication, 2020 to 2035
  • Table 67: South Asia & Pacific Market Value (USD Million) Forecast by Route of Administration, 2020 to 2035
  • Table 68: South Asia & Pacific Market Volume (Thousand units) Forecast by Route of Administration, 2020 to 2035
  • Table 69: South Asia & Pacific Market Value (USD Million) Forecast by End User, 2020 to 2035
  • Table 70: South Asia & Pacific Market Volume (Thousand units) Forecast by End User, 2020 to 2035
  • Table 71: Middle East and Africa Market Value (USD Million) Forecast by Country, 2020 to 2035
  • Table 72: Middle East and Africa Market Volume (Thousand units) Forecast by Country, 2020 to 2035
  • Table 73: Middle East and Africa Market Value (USD Million) Forecast by Product Type, 2020 to 2035
  • Table 74: Middle East and Africa Market Volume (Thousand units) Forecast by Product Type, 2020 to 2035
  • Table 75: Middle East and Africa Market Value (USD Million) Forecast by Indication, 2020 to 2035
  • Table 76: Middle East and Africa Market Volume (Thousand units) Forecast by Indication, 2020 to 2035
  • Table 77: Middle East and Africa Market Value (USD Million) Forecast by Route of Administration, 2020 to 2035
  • Table 78: Middle East and Africa Market Volume (Thousand units) Forecast by Route of Administration, 2020 to 2035
  • Table 79: Middle East and Africa Market Value (USD Million) Forecast by End User, 2020 to 2035
  • Table 80: Middle East and Africa Market Volume (Thousand units) Forecast by End User, 2020 to 2035

List of Figures

  • Figure 1: Global Market Volume (Thousand units) Forecast 2020 to 2035
  • Figure 2: Global Market Pricing Analysis
  • Figure 3: Global Market Value (USD Million) Forecast 2020 to 2035
  • Figure 4: Global Market Value Share and BPS Analysis by Product Type, 2025 and 2035
  • Figure 5: Global Market Y-o-Y Growth Comparison by Product Type, 2025 to 2035
  • Figure 6: Global Market Attractiveness Analysis by Product Type
  • Figure 7: Global Market Value Share and BPS Analysis by Indication, 2025 and 2035
  • Figure 8: Global Market Y-o-Y Growth Comparison by Indication, 2025 to 2035
  • Figure 9: Global Market Attractiveness Analysis by Indication
  • Figure 10: Global Market Value Share and BPS Analysis by Route of Administration, 2025 and 2035
  • Figure 11: Global Market Y-o-Y Growth Comparison by Route of Administration, 2025 to 2035
  • Figure 12: Global Market Attractiveness Analysis by Route of Administration
  • Figure 13: Global Market Value Share and BPS Analysis by End User, 2025 and 2035
  • Figure 14: Global Market Y-o-Y Growth Comparison by End User, 2025 to 2035
  • Figure 15: Global Market Attractiveness Analysis by End User
  • Figure 16: Global Market Value (USD Million) Share and BPS Analysis by Region, 2025 and 2035
  • Figure 17: Global Market Y-o-Y Growth Comparison by Region, 2025 to 2035
  • Figure 18: Global Market Attractiveness Analysis by Region
  • Figure 19: North America Market Incremental $ Opportunity, 2025 to 2035
  • Figure 20: Latin America Market Incremental $ Opportunity, 2025 to 2035
  • Figure 21: Western Europe Market Incremental $ Opportunity, 2025 to 2035
  • Figure 22: Eastern Europe Market Incremental $ Opportunity, 2025 to 2035
  • Figure 23: East Asia Market Incremental $ Opportunity, 2025 to 2035
  • Figure 24: South Asia & Pacific Market Incremental $ Opportunity, 2025 to 2035
  • Figure 25: Middle East and Africa Market Incremental $ Opportunity, 2025 to 2035
  • Figure 26: North America Market Value Share and BPS Analysis by Country, 2025 and 2035
  • Figure 27: North America Market Value Share and BPS Analysis by Product Type, 2025 and 2035
  • Figure 28: North America Market Y-o-Y Growth Comparison by Product Type, 2025 to 2035
  • Figure 29: North America Market Attractiveness Analysis by Product Type
  • Figure 30: North America Market Value Share and BPS Analysis by Indication, 2025 and 2035
  • Figure 31: North America Market Y-o-Y Growth Comparison by Indication, 2025 to 2035
  • Figure 32: North America Market Attractiveness Analysis by Indication
  • Figure 33: North America Market Value Share and BPS Analysis by Route of Administration, 2025 and 2035
  • Figure 34: North America Market Y-o-Y Growth Comparison by Route of Administration, 2025 to 2035
  • Figure 35: North America Market Attractiveness Analysis by Route of Administration
  • Figure 36: North America Market Value Share and BPS Analysis by End User, 2025 and 2035
  • Figure 37: North America Market Y-o-Y Growth Comparison by End User, 2025 to 2035
  • Figure 38: North America Market Attractiveness Analysis by End User
  • Figure 39: Latin America Market Value Share and BPS Analysis by Country, 2025 and 2035
  • Figure 40: Latin America Market Value Share and BPS Analysis by Product Type, 2025 and 2035
  • Figure 41: Latin America Market Y-o-Y Growth Comparison by Product Type, 2025 to 2035
  • Figure 42: Latin America Market Attractiveness Analysis by Product Type
  • Figure 43: Latin America Market Value Share and BPS Analysis by Indication, 2025 and 2035
  • Figure 44: Latin America Market Y-o-Y Growth Comparison by Indication, 2025 to 2035
  • Figure 45: Latin America Market Attractiveness Analysis by Indication
  • Figure 46: Latin America Market Value Share and BPS Analysis by Route of Administration, 2025 and 2035
  • Figure 47: Latin America Market Y-o-Y Growth Comparison by Route of Administration, 2025 to 2035
  • Figure 48: Latin America Market Attractiveness Analysis by Route of Administration
  • Figure 49: Latin America Market Value Share and BPS Analysis by End User, 2025 and 2035
  • Figure 50: Latin America Market Y-o-Y Growth Comparison by End User, 2025 to 2035
  • Figure 51: Latin America Market Attractiveness Analysis by End User
  • Figure 52: Western Europe Market Value Share and BPS Analysis by Country, 2025 and 2035
  • Figure 53: Western Europe Market Value Share and BPS Analysis by Product Type, 2025 and 2035
  • Figure 54: Western Europe Market Y-o-Y Growth Comparison by Product Type, 2025 to 2035
  • Figure 55: Western Europe Market Attractiveness Analysis by Product Type
  • Figure 56: Western Europe Market Value Share and BPS Analysis by Indication, 2025 and 2035
  • Figure 57: Western Europe Market Y-o-Y Growth Comparison by Indication, 2025 to 2035
  • Figure 58: Western Europe Market Attractiveness Analysis by Indication
  • Figure 59: Western Europe Market Value Share and BPS Analysis by Route of Administration, 2025 and 2035
  • Figure 60: Western Europe Market Y-o-Y Growth Comparison by Route of Administration, 2025 to 2035
  • Figure 61: Western Europe Market Attractiveness Analysis by Route of Administration
  • Figure 62: Western Europe Market Value Share and BPS Analysis by End User, 2025 and 2035
  • Figure 63: Western Europe Market Y-o-Y Growth Comparison by End User, 2025 to 2035
  • Figure 64: Western Europe Market Attractiveness Analysis by End User
  • Figure 65: Eastern Europe Market Value Share and BPS Analysis by Country, 2025 and 2035
  • Figure 66: Eastern Europe Market Value Share and BPS Analysis by Product Type, 2025 and 2035
  • Figure 67: Eastern Europe Market Y-o-Y Growth Comparison by Product Type, 2025 to 2035
  • Figure 68: Eastern Europe Market Attractiveness Analysis by Product Type
  • Figure 69: Eastern Europe Market Value Share and BPS Analysis by Indication, 2025 and 2035
  • Figure 70: Eastern Europe Market Y-o-Y Growth Comparison by Indication, 2025 to 2035
  • Figure 71: Eastern Europe Market Attractiveness Analysis by Indication
  • Figure 72: Eastern Europe Market Value Share and BPS Analysis by Route of Administration, 2025 and 2035
  • Figure 73: Eastern Europe Market Y-o-Y Growth Comparison by Route of Administration, 2025 to 2035
  • Figure 74: Eastern Europe Market Attractiveness Analysis by Route of Administration
  • Figure 75: Eastern Europe Market Value Share and BPS Analysis by End User, 2025 and 2035
  • Figure 76: Eastern Europe Market Y-o-Y Growth Comparison by End User, 2025 to 2035
  • Figure 77: Eastern Europe Market Attractiveness Analysis by End User
  • Figure 78: East Asia Market Value Share and BPS Analysis by Country, 2025 and 2035
  • Figure 79: East Asia Market Value Share and BPS Analysis by Product Type, 2025 and 2035
  • Figure 80: East Asia Market Y-o-Y Growth Comparison by Product Type, 2025 to 2035
  • Figure 81: East Asia Market Attractiveness Analysis by Product Type
  • Figure 82: East Asia Market Value Share and BPS Analysis by Indication, 2025 and 2035
  • Figure 83: East Asia Market Y-o-Y Growth Comparison by Indication, 2025 to 2035
  • Figure 84: East Asia Market Attractiveness Analysis by Indication
  • Figure 85: East Asia Market Value Share and BPS Analysis by Route of Administration, 2025 and 2035
  • Figure 86: East Asia Market Y-o-Y Growth Comparison by Route of Administration, 2025 to 2035
  • Figure 87: East Asia Market Attractiveness Analysis by Route of Administration
  • Figure 88: East Asia Market Value Share and BPS Analysis by End User, 2025 and 2035
  • Figure 89: East Asia Market Y-o-Y Growth Comparison by End User, 2025 to 2035
  • Figure 90: East Asia Market Attractiveness Analysis by End User
  • Figure 91: South Asia & Pacific Market Value Share and BPS Analysis by Country, 2025 and 2035
  • Figure 92: South Asia & Pacific Market Value Share and BPS Analysis by Product Type, 2025 and 2035
  • Figure 93: South Asia & Pacific Market Y-o-Y Growth Comparison by Product Type, 2025 to 2035
  • Figure 94: South Asia & Pacific Market Attractiveness Analysis by Product Type
  • Figure 95: South Asia & Pacific Market Value Share and BPS Analysis by Indication, 2025 and 2035
  • Figure 96: South Asia & Pacific Market Y-o-Y Growth Comparison by Indication, 2025 to 2035
  • Figure 97: South Asia & Pacific Market Attractiveness Analysis by Indication
  • Figure 98: South Asia & Pacific Market Value Share and BPS Analysis by Route of Administration, 2025 and 2035
  • Figure 99: South Asia & Pacific Market Y-o-Y Growth Comparison by Route of Administration, 2025 to 2035
  • Figure 100: South Asia & Pacific Market Attractiveness Analysis by Route of Administration
  • Figure 101: South Asia & Pacific Market Value Share and BPS Analysis by End User, 2025 and 2035
  • Figure 102: South Asia & Pacific Market Y-o-Y Growth Comparison by End User, 2025 to 2035
  • Figure 103: South Asia & Pacific Market Attractiveness Analysis by End User
  • Figure 104: Middle East and Africa Market Value Share and BPS Analysis by Country, 2025 and 2035
  • Figure 105: Middle East and Africa Market Value Share and BPS Analysis by Product Type, 2025 and 2035
  • Figure 106: Middle East and Africa Market Y-o-Y Growth Comparison by Product Type, 2025 to 2035
  • Figure 107: Middle East and Africa Market Attractiveness Analysis by Product Type
  • Figure 108: Middle East and Africa Market Value Share and BPS Analysis by Indication, 2025 and 2035
  • Figure 109: Middle East and Africa Market Y-o-Y Growth Comparison by Indication, 2025 to 2035
  • Figure 110: Middle East and Africa Market Attractiveness Analysis by Indication
  • Figure 111: Middle East and Africa Market Value Share and BPS Analysis by Route of Administration, 2025 and 2035
  • Figure 112: Middle East and Africa Market Y-o-Y Growth Comparison by Route of Administration, 2025 to 2035
  • Figure 113: Middle East and Africa Market Attractiveness Analysis by Route of Administration
  • Figure 114: Middle East and Africa Market Value Share and BPS Analysis by End User, 2025 and 2035
  • Figure 115: Middle East and Africa Market Y-o-Y Growth Comparison by End User, 2025 to 2035
  • Figure 116: Middle East and Africa Market Attractiveness Analysis by End User
  • Figure 117: Global Market - Tier Structure Analysis
  • Figure 118: Global Market - Company Share Analysis

Frequently Asked Questions

What is the size of the oxytocic pharmaceuticals market in 2025?

It is expected to be valued at USD 133.2 million.

How fast is the oxytocic pharmaceuticals market growing?

It is projected to grow at a CAGR of 7.8% from 2025 to 2035.

Which segment leads the industry by product type?

Synthetic oxytocin accounts for 89.3% of the industry in 2025.

Which application has the largest share?

Postpartum hemorrhage (PPH) management, with 42.5% of industry value in 2025.

Who is the leading player in the oxytocic pharmaceuticals market?

The leading player in the industry is Pfizer Inc. with a 15% industry share.

Explore Similar Insights

Future Market Insights

Oxytocic Pharmaceuticals Market