Phosphorothioic Trichloride Market Forecast and Outlook 2025 to 2035

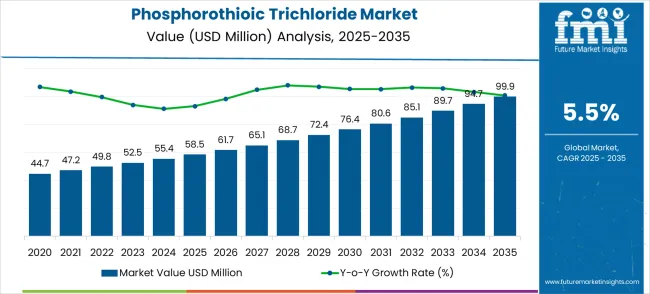
The phosphorothioic trichloride market, valued at USD 58.5 million in 2025, is set to reach USD 99.9 million by 2035, with a CAGR of 5.5%. From 2021 to 2025, the market experiences gradual growth, moving from USD 44.7 million in 2021 to USD 58.5 million in 2025.

Annual increments in this phase reflect steady demand, with the market reaching USD 47.2 million in 2022, USD 49.8 million in 2023, USD 52.5 million in 2024, and USD 55.4 million in 2025. This early phase of growth is driven by the increasing use of phosphorothioic trichloride in agrochemicals, particularly in crop protection, and in pharmaceuticals. The market remains stable as its applications continue to expand within the chemical synthesis sector.
Quick Stats for Phosphorothioic Trichloride Market

  • Phosphorothioic Trichloride Market Value (2025): USD 58.5 million
  • Phosphorothioic Trichloride Market Forecast Value (2035): USD 100 million
  • Phosphorothioic Trichloride Market Forecast CAGR: 5.5%
  • Leading Segment in Phosphorothioic Trichloride Market: Organic Synthesis (52.3%)
  • Key Growth Regions in Phosphorothioic Trichloride Market: Asia Pacific, North America, and Europe
  • Top Key Players in Phosphorothioic Trichloride Market: Lanxess, BHAGWATI CHEMICALS, Anhui Jinquan Biotechnology, Xinyi Yijin Chemical, Jiangsu Kuaida Agrochemical, Zhejiang Jiahua Energy Chemical

Phosphorothioic Trichloride Market Market Value Analysis

The second phase, starting around 2026, marks a significant acceleration in market growth, moving from USD 58.5 million in 2025 to USD 76.4 million in 2030. This period witnesses increased adoption in specialized chemical applications, especially in manufacturing pesticides, herbicides, and other agricultural chemicals.

The inflection point occurs as industries recognize the enhanced performance offered by phosphorothioic trichloride in chemical processing. By 2035, the market is expected to reach USD 99.9 million, with values passing through USD 89.7 million and USD 94.7 million in intermediate years. The steady growth during this phase reflects broadening industrial applications and increasing demand, driven by both global agricultural needs and new chemical innovations.

Phosphorothioic Trichloride Market Key Takeaways

The chemical manufacturing market is the largest contributor, accounting for around 40-45%, as phosphorothioic trichloride is used in the production of pesticides, flame retardants, and other specialty chemicals. The agrochemical market follows with a contribution of approximately 20-25%, as phosphorothioic trichloride is an important intermediate in the synthesis of organophosphate insecticides and herbicides, which are crucial in crop protection and pest control.

The pharmaceutical market represents about 10-12%, as phosphorothioic trichloride is used in the production of certain drugs, including those with anti-inflammatory and antimicrobial properties. The plastics and polymers market contributes around 8-10%, as the compound is used in the manufacture of various flame retardants that are incorporated into plastics for enhanced safety in electrical and electronic applications.

The water treatment market accounts for approximately 5-7%, as phosphorothioic trichloride is employed in water purification processes to remove heavy metals and other contaminants.

Metric Value
Estimated Value in (2025E) USD 58.5 million
Forecast Value in (2035F) USD 100 million
Forecast CAGR (2025 to 2035) 5.5%

Why is the Phosphorothioic Trichloride Market Growing?

Market expansion is being supported by the increasing demand for specialized chemical intermediates in pesticide manufacturing and the corresponding need for high-purity phosphorothioic trichloride in pharmaceutical synthesis applications. Modern agricultural practices require effective crop protection chemicals that depend on sophisticated intermediates like phosphorothioic trichloride for their production. The compound's unique chemical properties and reactivity make it an essential reagent for various organophosphorus synthesis processes used in agrochemical and pharmaceutical formulations.

The growing emphasis on pharmaceutical research and specialty chemical manufacturing is driving demand for phosphorothioic trichloride derived from reliable production processes with consistent quality standards. Industrial preference for high-purity chemical intermediates that provide enhanced reaction efficiency and product yield is creating opportunities for specialized formulations. The rising influence of regulatory compliance requirements and quality assurance standards is contributing to increased adoption of premium phosphorothioic trichloride across different industrial applications and manufacturing processes.

Segmental Analysis

The market is segmented by purity, application, and region. By purity, the market is divided into 98% purity and >98% purity. By application, the market is categorized into organic synthesis, pesticide intermediates, and matrix fine chemicals. Regionally, the market is divided into North America, Europe, East Asia, South Asia & Pacific, Latin America, and Middle East & Africa.
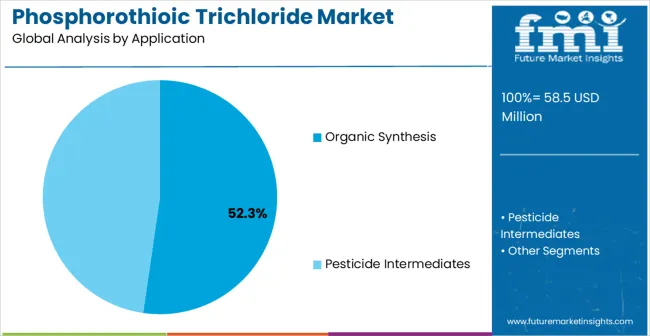
By Application, Organic Synthesis Segment Accounts for 52.3% Market Share

Phosphorothioic Trichloride Market Analysis By Application

The organic synthesis application is projected to account for 52.3% of the phosphorothioic trichloride market in 2025, reaffirming its position as the category's primary use case. Chemical manufacturers increasingly understand the importance of phosphorothioic trichloride in creating complex organophosphorus compounds used in various industrial applications. The compound's well-documented reactivity and selectivity directly address synthesis requirements by enabling precise chemical transformations, supporting reaction efficiency, and maintaining product quality standards.

This application forms the foundation of most industrial positioning, as it represents the most versatile and chemistry-validated use of phosphorothioic trichloride in manufacturing. Research institutions and chemical companies continue to strengthen reliance on phosphorothioic trichloride formulations. With industrial processes requiring more sophisticated chemical intermediates, organic synthesis aligns with both efficiency and innovation goals. Its broad applicability across chemical sectors ensures steady dominance, making it the central growth driver of phosphorothioic trichloride demand.
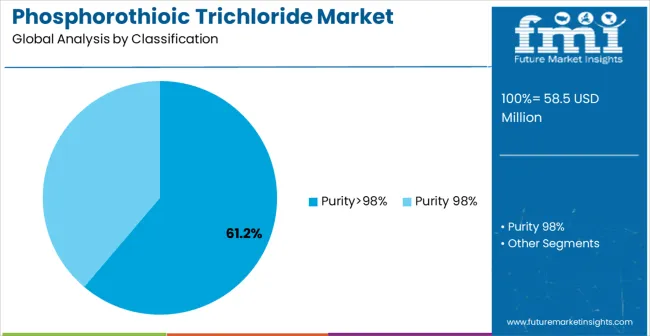
By Purity, >98% Purity Segment Accounts for 61.2% Market Share

Phosphorothioic Trichloride Market Analysis By Classification

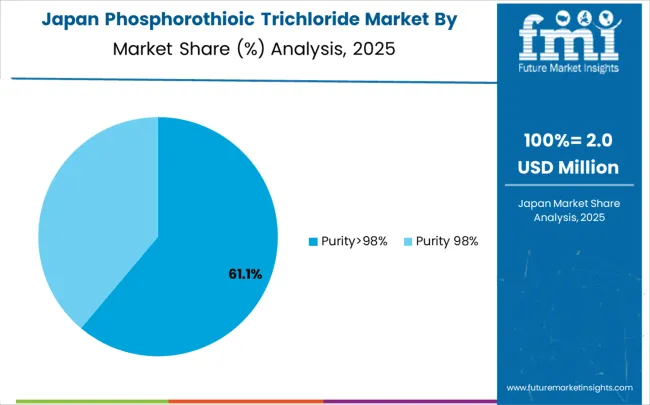
High-purity phosphorothioic trichloride (>98% purity) is projected to represent 61.2% of market demand in 2025, underscoring its role as the preferred grade for critical chemical applications. Industrial users gravitate toward high-purity grades for their enhanced reaction performance, reduced impurity interference, and ability to meet stringent quality specifications required in pharmaceutical and specialty chemical manufacturing. Positioned as premium, specialized reagents, high-purity grades offer both superior chemical performance and regulatory compliance benefits.

The segment is supported by the rising demand for quality-controlled manufacturing processes, where high-purity phosphorothioic trichloride plays a central role in production strategies. Companies are increasingly combining high-purity phosphorothioic trichloride with advanced handling protocols and quality assurance systems, enhancing reliability and justifying premium pricing. As quality-conscious manufacturers prioritize performance and compliance, high-purity phosphorothioic trichloride will continue to dominate demand, reinforcing its premium positioning within the specialty chemicals market.

What are the Drivers, Restraints, and Key Trends of the Phosphorothioic Trichloride Market?

The phosphorothioic trichloride market is advancing steadily due to increasing demand for specialty chemical intermediates and growing applications in pharmaceutical synthesis processes. The market faces challenges including regulatory compliance requirements, handling safety protocols, and competition from alternative chemical reagents. Innovation in manufacturing technologies and green production practices continue to influence product development and market expansion patterns.

Expansion of Pharmaceutical and Fine Chemicals Manufacturing

The growing adoption of advanced pharmaceutical synthesis is enabling companies to develop more sophisticated drug compounds and specialty chemical products. Pharmaceutical applications offer enhanced reaction capabilities, specialized chemical transformations, and advanced manufacturing processes that influence development decisions. Research and development investments are driving innovation and product advancement, particularly among pharmaceutical companies who prioritize chemical intermediate quality and regulatory compliance in manufacturing operations.

Integration of Advanced Production Systems and Quality Technologies

Modern phosphorothioic trichloride manufacturers are incorporating advanced production systems such as continuous processing, automated quality control, and real-time monitoring to enhance product consistency and manufacturing efficiency. These technologies improve the reliability of phosphorothioic trichloride while reducing production costs and providing better quality assurance. Advanced manufacturing techniques enable specialized products that deliver enhanced chemical performance and regulatory compliance in industrial applications.
Analysis of Phosphorothioic Trichloride Market by Key Country

Phosphorothioic Trichloride Market Cagr Analysis By Country

Country CAGR (2025 to 2035)
China 7.4%
India 6.9%
Germany 6.3%
Brazil 5.8%
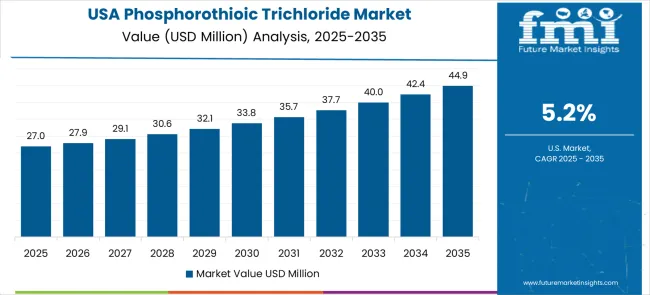
USA 5.2%
UK 4.7%
Japan 4.1%

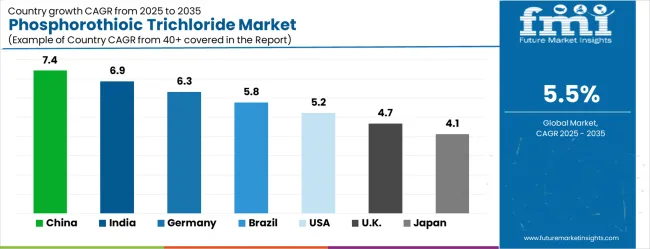
The phosphorothioic trichloride market is experiencing solid growth globally, with China leading at a 7.4% CAGR through 2035, driven by extensive pesticide manufacturing, expanding pharmaceutical industry, and growing chemical synthesis activities. India follows at 6.9%, supported by agricultural modernization, increasing crop protection needs, and expanding pharmaceutical manufacturing capabilities.

Germany records 6.3%, focusing on high-purity applications and advanced chemical manufacturing standards. Brazil shows 5.8% growth, driven by agricultural chemical demand and expanding industrial chemistry sector. The USA demonstrates 5.2% growth, emphasizing regulatory compliance and specialty applications. The UK and Japan show steady growth at 4.7% and 4.1% respectively, focusing on high-value applications and technological innovation.

The report covers an in-depth analysis of 40+ countries with top-performing countries highlighted below.

China Leads Global Market Growth with Industrial Chemical Expansion

The phosphorothioic trichloride market in China is projected to exhibit the highest growth rate with a CAGR of 7.4%, driven by extensive pesticide manufacturing activities and expanding pharmaceutical intermediate production. The country’s large agricultural base, which requires advanced crop protection products, is fueling demand for chemical intermediates.

China’s rising pharmaceutical output and diversified chemical sector further boost consumption of phosphorothioic trichloride. Major domestic players are enhancing large-scale production facilities to supply both domestic and export markets, reflecting the country’s dominant role in the global chemical value chain.

Strategic collaborations, technology transfer programs, and supportive government policies toward agricultural modernization are enabling China to expand its foothold in premium chemical intermediates. Increasing adoption of high-purity grades in pharmaceuticals and industrial chemicals is strengthening growth prospects, making China the largest contributor to global market expansion.

  • Government support for agricultural modernization and chemical industry development is driving demand for advanced pesticide intermediates and specialty chemical products throughout major industrial regions.
  • Manufacturing infrastructure expansion and technological advancement programs are enhancing production capabilities for high-purity phosphorothioic trichloride meeting international quality standards.

India Demonstrates Strong Market Potential with Agricultural Development

Revenue from phosphorothioic trichloride in India is expanding at a CAGR of 6.9%, supported by rising agricultural chemical demand and the growth of pharmaceutical manufacturing. India’s reliance on agriculture and its focus on improving crop productivity are pushing higher adoption of effective pesticide intermediates.

With government-backed initiatives promoting agricultural modernization, farmers are increasingly adopting crop protection solutions, creating a strong base for phosphorothioic trichloride usage. The growing pharmaceutical sector, particularly generic drug manufacturing, demands high-quality chemical intermediates meeting global regulatory standards. Indian manufacturers are developing production capacities to serve the fast-expanding domestic market while exploring exports to neighboring countries.

Cost competitiveness, availability of skilled workforce, and ongoing investments in chemical manufacturing infrastructure position India as one of the fastest-growing markets globally. This combination of agriculture-led demand and pharmaceutical expansion is driving substantial opportunities for market players.

  • Agricultural modernization initiatives and increasing pesticide adoption are creating opportunities for specialized chemical intermediate suppliers serving crop protection manufacturers across rural and agricultural regions.
  • Pharmaceutical industry growth and generic drug manufacturing are supporting demand for high-quality chemical intermediates meeting stringent regulatory requirements and international quality standards.

Germany Focuses on High-Purity Applications and Technical Excellence

Demand for phosphorothioic trichloride in Germany is projected to grow at a CAGR of 6.3%, underpinned by the country’s advanced chemical sector and its emphasis on specialty chemicals. Germany has a reputation for producing premium-grade chemical intermediates, and manufacturers are investing in purification technologies to deliver high-purity phosphorothioic trichloride for pharmaceutical and specialty applications.

The market is characterized by a focus on environmental responsibility, regulatory compliance, and technical innovation. German firms are leveraging R&D to enhance product quality and efficiency, aligning with strict EU chemical regulations.

This strong focus on precision and technical excellence ensures that German manufacturers remain competitive in high-value applications such as pharmaceuticals, specialty chemicals, and research sectors. With increasing emphasis on environmentally responsible production, Germany is also setting standards for green chemical intermediate manufacturing.

  • Chemical industry investments are prioritizing advanced production technologies and quality assurance systems that meet stringent European regulatory standards for chemical intermediate manufacturing.
  • Research and development programs are enhancing technical expertise and production efficiency, enabling specialized applications in pharmaceutical synthesis and high-value chemical manufacturing.

Brazil Maintains Steady Growth with Agricultural Chemical Development

The phosphorothioic trichloride in Brazil is expanding at a CAGR of 5.8%, supported by its vast agricultural base and increasing demand for crop protection chemicals. As one of the largest global exporters of agricultural products, Brazil’s reliance on effective pest management solutions directly fuels demand for phosphorothioic trichloride.

Local chemical manufacturers are expanding production capacity to support domestic pesticide companies and ensure reliable supply chains. Brazil’s agricultural modernization, coupled with rising adoption of advanced crop protection practices, continues to strengthen demand for pesticide intermediates.

Government initiatives to enhance industrial production capabilities and attract foreign investment in chemicals are also aiding market development. By balancing agricultural requirements with domestic chemical manufacturing growth, Brazil is ensuring steady market expansion. Competitive pricing strategies and local supply advantages position Brazilian producers strongly in both domestic and regional markets.
  • Agricultural expansion and modern farming practices are facilitating increased pesticide usage, driving demand for chemical intermediates supporting crop protection product manufacturing across major agricultural regions.
  • Industrial development programs and chemical manufacturing investments are enhancing local production capabilities for agricultural chemical intermediates meeting domestic and regional market requirements.

United States Emphasizes Regulatory Compliance and Specialty Applications

Phosphorothioic Trichloride Market Country Value Analysis

The USA market for phosphorothioic trichloride is expected to expand at a CAGR of 5.2%, shaped by stringent environmental and safety regulations alongside strong demand for high-purity chemical intermediates. American manufacturers are focusing on compliance with EPA and FDA requirements while catering to specialized needs in pharmaceuticals and advanced chemical research. The USA benefits from a robust pharmaceutical industry, which increasingly requires ultra-pure intermediates for drug synthesis.

The advanced R&D capabilities allow for innovative applications in specialty chemicals and biopharmaceuticals. The country’s established quality assurance systems, coupled with technological leadership, provide a competitive edge in producing premium-grade phosphorothioic trichloride. Growing emphasis on eco-responsibility, safety, and precision in chemical manufacturing aligns with broader regulatory and market trends, ensuring long-term stability for USA producers.

  • Regulatory compliance requirements are driving demand for high-purity phosphorothioic trichloride meeting EPA and FDA standards for chemical intermediate applications in pesticide and pharmaceutical manufacturing.
  • Research and development activities in pharmaceutical and specialty chemical sectors are creating opportunities for innovative applications requiring premium-grade chemical intermediates with enhanced purity specifications.

United Kingdom Strengthens Market with Specialty Chemical Focus

Revenue from phosphorothioic trichloride in the UK is anticipated to grow at a CAGR of 4.7%, driven by the country’s specialty chemical manufacturing sector and research-oriented applications. The UK is focusing on niche, high-value applications in pharmaceuticals and advanced chemical synthesis.

Manufacturers are emphasizing innovation, regulatory compliance, and eco-conscious practices to remain competitive in premium segments. With significant investments in R&D and collaborations with research institutes, the UK market is increasingly oriented toward producing high-purity intermediates for specialized uses.

The emphasis on quality and customization supports pharmaceutical companies and research laboratories requiring precision chemical intermediates. Growing export opportunities also contribute to market growth, with UK producers targeting international markets for specialty-grade products.
  • Specialty chemical manufacturing and pharmaceutical research activities are driving demand for high-purity phosphorothioic trichloride supporting advanced synthesis applications and custom chemical manufacturing services.
  • Quality standards and regulatory requirements are encouraging manufacturers to invest in advanced purification technologies and quality assurance systems for premium chemical intermediate production.

Japan Maintains Leadership with Advanced Chemical Technology

Phosphorothioic Trichloride Market Japan Market Share Analysis By Classification

Demand for phosphorothioic trichloride in Japan is forecasted to grow at a CAGR of 4.1%, underpinned by advanced chemical manufacturing capabilities and technical excellence. Japan’s manufacturers emphasize ultra-high purity standards, catering to demanding applications in pharmaceuticals, specialty chemicals, and electronic intermediates.

Strong research and development collaborations between industry and academia support innovation and ensure consistent product quality. Japan’s established regulatory framework and long-standing focus on precision manufacturing give it a leadership role in producing premium-grade phosphorothioic trichloride.

Technological sophistication, combined with expertise in eco-friendly and efficient production methods, provides a strong competitive advantage. Although the growth rate is relatively moderate, Japan’s focus on high-value, specialized applications ensures strong profitability and market stability.
  • Advanced manufacturing technologies and quality control systems are supporting production of ultra-pure phosphorothioic trichloride meeting stringent specifications for pharmaceutical and specialty chemical applications.
  • Research collaboration between chemical manufacturers and academic institutions is enhancing technical expertise and product development capabilities for innovative chemical intermediate applications.

Europe Market Split by Country

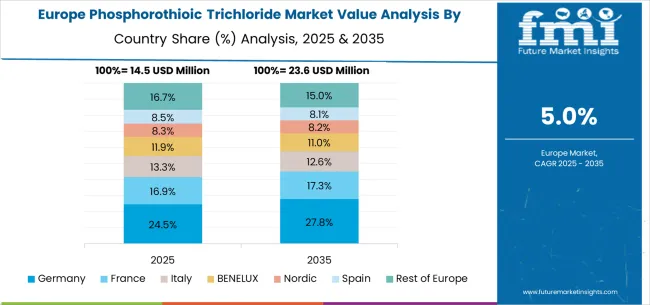
Phosphorothioic Trichloride Market Europe Country Market Share Analysis, 2025 & 2035

The phosphorothioic trichloride market in Europe demonstrates mature development across major chemical manufacturing regions with Germany showing strong presence through its scientific approach to specialty chemical production and industrial appreciation for high-quality intermediate compounds, supported by companies leveraging chemical engineering expertise to develop effective phosphorothioic trichloride formulations that serve pharmaceutical synthesis and agrochemical manufacturing applications with enhanced purity and performance characteristics.

France represents a significant market driven by its chemical industry heritage and sophisticated understanding of organophosphorus chemistry, with companies like Rhodia and Arkema pioneering specialty phosphorothioic trichloride products that combine French chemical innovation with advanced manufacturing systems for enhanced product quality and industrial application benefits. The UK exhibits considerable growth through its embrace of pharmaceutical manufacturing and chemical intermediate production, with companies focusing on high-purity phosphorothioic trichloride formulations and comprehensive quality assurance systems.

Italy and Spain show expanding interest in agrochemical applications, particularly in premium phosphorothioic trichloride formulations targeting pesticide intermediate production and specialty chemical manufacturing. BENELUX countries contribute through their focus on chemical industry innovation and green manufacturing practices, while Eastern Europe and Nordic regions display growing potential driven by increasing chemical manufacturing capabilities and expanding access to specialty chemical intermediates across diverse industrial applications.

Competitive Landscape of Phosphorothioic Trichloride Market

The phosphorothioic trichloride market is characterized by competition among established chemical manufacturers, specialty chemical companies, and emerging industrial players. Companies are investing in advanced manufacturing technologies, quality control systems, regulatory compliance protocols, and supply chain optimization to deliver effective, reliable, and accessible specialty chemical solutions. Product positioning, manufacturing innovation, and market expansion are central to strengthening product portfolios and market presence.

Lanxess, Germany-based, leads the market with 12.3% global value share, offering high-quality phosphorothioic trichloride formulations with a focus on manufacturing excellence and industrial applications. BHAGWATI CHEMICALS, India, provides cost-effective, high-concentration phosphorothioic trichloride products with transparent quality documentation and competitive pricing. Anhui Jinquan Biotechnology, China, delivers science-backed formulations with emphasis on product purity and industrial education. Xinyi Yijin Chemical, China, focuses on reliable, effective formulations that combine phosphorothioic trichloride with complementary quality assurance systems.

Jiangsu Kuaida Agrochemical and Zhejiang Jiahua Energy Chemical, operating regionally, provide comprehensive phosphorothioic trichloride product ranges across multiple industrial sectors and distribution channels. Regional suppliers emphasize specialized applications and manufacturing reliability with premium positioning. Industrial distributors offer quality-controlled products with regulatory compliance and comprehensive documentation. Specialty chemical manufacturers provide specialized solutions with focus on specific industrial requirements and customer preferences.

Global Phosphorothioic Trichloride Market - Stakeholder Contribution Framework

Phosphorothioic trichloride (PSCl₃) represents a specialized segment within the fine chemicals industry, serving as a critical intermediate in organophosphorus synthesis, particularly for pesticide manufacturing and advanced chemical processing. With a market valued at USD 58.5 million and growing at 5.5% annually, this niche chemical faces unique challenges around regulatory compliance, specialized handling requirements, and concentrated production capabilities. The market's growth depends on coordinated efforts across regulatory bodies, specialized chemical manufacturers, safety technology providers, and targeted investment in process innovation.

How Governments Could Enable Safe Production and Trade?

  • Regulatory Harmonization: Establish consistent classification and handling standards for PSCl₃ across major markets (China, India, Germany, Brazil, USA, UK, Japan) to reduce compliance complexity for manufacturers operating internationally and streamline cross-border trade approvals.
  • Chemical Safety Infrastructure: Invest in specialized hazmat transportation networks, emergency response capabilities, and inspector training programs to support safe handling of reactive organophosphorus compounds throughout the supply chain.
  • Strategic Chemical Security: Develop controlled-access frameworks that balance legitimate commercial use in pesticide intermediates and fine chemical synthesis with security concerns, particularly for dual-use chemical precursors.
  • Manufacturing Incentives: Provide targeted support for domestic PSCl₃ production facilities through tax credits for specialized safety equipment, environmental controls, and waste treatment systems required for compliant operations.
  • R&D Partnerships: Fund collaborative research on safer synthesis routes, process intensification, and waste minimization technologies that could improve the economics and environmental profile of PSCl₃ manufacturing.

How Industry Bodies Could Strengthen Market Standards?

  • Purity Specifications: Establish rigorous analytical protocols for 98%, >98%, and 99.9% purity grades that ensure consistent quality for downstream applications in pesticide synthesis and fine chemical manufacturing, reducing customer qualification time.
  • Safety Best Practices: Develop comprehensive handling, storage, and transportation guidelines specific to PSCl₃'s reactive properties, including compatibility matrices with common solvents and reaction conditions used in organophosphorus chemistry.
  • Supply Chain Certification: Create vendor qualification standards that verify manufacturers' technical capabilities, safety systems, and regulatory compliance across major producing regions, particularly China and India where cost pressures are highest.
  • Application Development: Facilitate technical workshops connecting PSCl₃ suppliers with pesticide formulators and specialty chemical developers to identify new synthetic applications and optimize existing processes.

How Technology and Equipment Providers Could Advance the Ecosystem?

  • Process Safety Systems: Develop automated monitoring and control systems specifically designed for PSCl₃ synthesis and handling, including real-time moisture detection, temperature control, and emergency shutdown capabilities critical for managing its hydrolytic instability.
  • Purification Technology: Provide specialized distillation and purification equipment capable of achieving >98% and 99.9% purity levels while managing the corrosive nature of PSCl₃ and its synthesis by-products.
  • Containment Solutions: Engineer specialized storage vessels, transfer systems, and packaging designed for PSCl₃'s chemical compatibility requirements and regulatory shipping classifications.
  • Environmental Controls: Supply advanced scrubbing and waste treatment systems that neutralize PSCl₃ hydrolysis products and manage off-gases from production processes to meet increasingly stringent environmental standards.

How Suppliers Could Navigate Market Complexities?

  • Quality Assurance Systems: Implement rigorous batch-to-batch consistency protocols that ensure purity specifications (98%, >98%, 99.9%) meet customer requirements for critical applications in pesticide intermediate synthesis where impurities can affect final product efficacy.
  • Customer Technical Support: Provide specialized application support for organic synthesis applications, including reaction optimization guidance, compatibility studies, and troubleshooting assistance for pesticide intermediate and fine chemical customers.
  • Supply Security: Develop resilient production and distribution networks that can maintain supply continuity despite regulatory changes, environmental compliance requirements, and the concentrated nature of both suppliers and customers in this specialty market.
  • Regional Market Development: Build localized distribution and technical service capabilities in key markets (China 7.4%, India 6.9%, Germany 6.3%) to reduce logistics complexity and provide responsive customer support for time-sensitive chemical synthesis applications.

How Investors Could Support Market Evolution?

  • Specialized Manufacturing Capacity: Finance construction of modern PSCl₃ production facilities with advanced safety systems, environmental controls, and flexible purification capabilities to serve diverse purity requirements while meeting evolving regulatory standards.
  • Technology Innovation: Back development of next-generation synthesis routes, continuous manufacturing processes, and digital process control systems that could improve yield, reduce waste, and enhance safety in PSCl₃ production.
  • Supply Chain Integration: Support vertical integration opportunities linking raw material suppliers (phosphorus compounds, chlorinating agents) with PSCl₃ manufacturers and downstream customers to improve supply security and margin capture.
  • Geographic Diversification: Fund establishment of PSCl₃ manufacturing capabilities in regions with growing pesticide and specialty chemical industries but limited local production, reducing dependence on concentrated Asian suppliers and improving supply chain resilience for global customers.

Key Players in the Phosphorothioic Trichloride Market

  • Lanxess
  • BHAGWATI CHEMICALS
  • Anhui Jinquan Biotechnology
  • Xinyi Yijin Chemical
  • Jiangsu Kuaida Agrochemical
  • Zhejiang Jiahua Energy Chemical
  • Hubei Xianlin Chemical
  • Shandong Mingxin Chemical
  • Gujarat Organics Limited
  • Nantong Yongsheng Chemical

Scope of the Report

Items Values
Quantitative Units (2025) USD 58.5 million
Purity 98% purity, >98% purity
Application Organic synthesis, Pesticide intermediates, Matrix fine chemicals
Regions Covered North America, Europe, East Asia, South Asia & Pacific, Latin America, Middle East & Africa
Countries Covered United States, Germany, China, India, United Kingdom, Japan, Brazil, France, Italy, Spain and 40+ countries
Key Companies Profiled Lanxess, BHAGWATI CHEMICALS, Anhui Jinquan Biotechnology, Xinyi Yijin Chemical, Jiangsu Kuaida Agrochemical, Zhejiang Jiahua Energy Chemical, Hubei Xianlin Chemical, Shandong Mingxin Chemical, Gujarat Organics Limited, and Nantong Yongsheng Chemical
Additional Attributes Dollar sales by purity level and application type, regional demand trends across North America, Europe, and Asia-Pacific, competitive landscape with established manufacturers and emerging suppliers, buyer preferences for quality versus cost considerations, integration with regulatory compliance and safety protocols, innovations in manufacturing processes, purification technologies

Phosphorothioic Trichloride Market by Segments

Purity:

  • 98% purity
  • >98% purity

Application:

  • Organic synthesis
  • Pesticide intermediates
  • Matrix fine chemicals

Region:

  • North America

    • United States
    • Canada
    • Mexico
  • Europe

    • Germany
    • United Kingdom
    • France
    • Italy
    • Spain
    • Nordic
    • BENELUX
    • Rest of Europe
  • East Asia

    • China
    • Japan
    • South Korea
  • South Asia & Pacific

    • India
    • ASEAN
    • Australia & New Zealand
    • Rest of South Asia & Pacific
  • Latin America

    • Brazil
    • Chile
    • Rest of Latin America
  • Middle East & Africa

    • Kingdom of Saudi Arabia
    • Other GCC Countries
    • Turkiye
    • South Africa
    • Other African Union
    • Rest of Middle East & Africa

Table of Content

  1. Executive Summary
    • Global Market Outlook
    • Demand to side Trends
    • Supply to side Trends
    • Technology Roadmap Analysis
    • Analysis and Recommendations
  2. Market Overview
    • Market Coverage / Taxonomy
    • Market Definition / Scope / Limitations
  3. Market Background
    • Market Dynamics
      • Drivers
      • Restraints
      • Opportunity
      • Trends
    • Scenario Forecast
      • Demand in Optimistic Scenario
      • Demand in Likely Scenario
      • Demand in Conservative Scenario
    • Opportunity Map Analysis
    • Product Life Cycle Analysis
    • Supply Chain Analysis
    • Investment Feasibility Matrix
    • Value Chain Analysis
    • PESTLE and Porter’s Analysis
    • Regulatory Landscape
    • Regional Parent Market Outlook
    • Production and Consumption Statistics
    • Import and Export Statistics
  4. Global Market Analysis 2020 to 2024 and Forecast, 2025 to 2035
    • Historical Market Size Value (USD Million) Analysis, 2020 to 2024
    • Current and Future Market Size Value (USD Million) Projections, 2025 to 2035
      • Y to o to Y Growth Trend Analysis
      • Absolute $ Opportunity Analysis
  5. Global Market Pricing Analysis 2020 to 2024 and Forecast 2025 to 2035
  6. Global Market Analysis 2020 to 2024 and Forecast 2025 to 2035, By Classification
    • Introduction / Key Findings
    • Historical Market Size Value (USD Million) Analysis By Classification , 2020 to 2024
    • Current and Future Market Size Value (USD Million) Analysis and Forecast By Classification , 2025 to 2035
      • Purity>98%
      • Purity 98%
    • Y to o to Y Growth Trend Analysis By Classification , 2020 to 2024
    • Absolute $ Opportunity Analysis By Classification , 2025 to 2035
  7. Global Market Analysis 2020 to 2024 and Forecast 2025 to 2035, By Application
    • Introduction / Key Findings
    • Historical Market Size Value (USD Million) Analysis By Application, 2020 to 2024
    • Current and Future Market Size Value (USD Million) Analysis and Forecast By Application, 2025 to 2035
      • Organic Synthesis
      • Pesticide Intermediates
    • Y to o to Y Growth Trend Analysis By Application, 2020 to 2024
    • Absolute $ Opportunity Analysis By Application, 2025 to 2035
  8. Global Market Analysis 2020 to 2024 and Forecast 2025 to 2035, By Region
    • Introduction
    • Historical Market Size Value (USD Million) Analysis By Region, 2020 to 2024
    • Current Market Size Value (USD Million) Analysis and Forecast By Region, 2025 to 2035
      • North America
      • Latin America
      • Western Europe
      • Eastern Europe
      • East Asia
      • South Asia and Pacific
      • Middle East & Africa
    • Market Attractiveness Analysis By Region
  9. North America Market Analysis 2020 to 2024 and Forecast 2025 to 2035, By Country
    • Historical Market Size Value (USD Million) Trend Analysis By Market Taxonomy, 2020 to 2024
    • Market Size Value (USD Million) Forecast By Market Taxonomy, 2025 to 2035
      • By Country
        • USA
        • Canada
        • Mexico
      • By Classification
      • By Application
    • Market Attractiveness Analysis
      • By Country
      • By Classification
      • By Application
    • Key Takeaways
  10. Latin America Market Analysis 2020 to 2024 and Forecast 2025 to 2035, By Country
    • Historical Market Size Value (USD Million) Trend Analysis By Market Taxonomy, 2020 to 2024
    • Market Size Value (USD Million) Forecast By Market Taxonomy, 2025 to 2035
      • By Country
        • Brazil
        • Chile
        • Rest of Latin America
      • By Classification
      • By Application
    • Market Attractiveness Analysis
      • By Country
      • By Classification
      • By Application
    • Key Takeaways
  11. Western Europe Market Analysis 2020 to 2024 and Forecast 2025 to 2035, By Country
    • Historical Market Size Value (USD Million) Trend Analysis By Market Taxonomy, 2020 to 2024
    • Market Size Value (USD Million) Forecast By Market Taxonomy, 2025 to 2035
      • By Country
        • Germany
        • UK
        • Italy
        • Spain
        • France
        • Nordic
        • BENELUX
        • Rest of Western Europe
      • By Classification
      • By Application
    • Market Attractiveness Analysis
      • By Country
      • By Classification
      • By Application
    • Key Takeaways
  12. Eastern Europe Market Analysis 2020 to 2024 and Forecast 2025 to 2035, By Country
    • Historical Market Size Value (USD Million) Trend Analysis By Market Taxonomy, 2020 to 2024
    • Market Size Value (USD Million) Forecast By Market Taxonomy, 2025 to 2035
      • By Country
        • Russia
        • Poland
        • Hungary
        • Balkan & Baltic
        • Rest of Eastern Europe
      • By Classification
      • By Application
    • Market Attractiveness Analysis
      • By Country
      • By Classification
      • By Application
    • Key Takeaways
  13. East Asia Market Analysis 2020 to 2024 and Forecast 2025 to 2035, By Country
    • Historical Market Size Value (USD Million) Trend Analysis By Market Taxonomy, 2020 to 2024
    • Market Size Value (USD Million) Forecast By Market Taxonomy, 2025 to 2035
      • By Country
        • China
        • Japan
        • South Korea
      • By Classification
      • By Application
    • Market Attractiveness Analysis
      • By Country
      • By Classification
      • By Application
    • Key Takeaways
  14. South Asia and Pacific Market Analysis 2020 to 2024 and Forecast 2025 to 2035, By Country
    • Historical Market Size Value (USD Million) Trend Analysis By Market Taxonomy, 2020 to 2024
    • Market Size Value (USD Million) Forecast By Market Taxonomy, 2025 to 2035
      • By Country
        • India
        • ASEAN
        • Australia & New Zealand
        • Rest of South Asia and Pacific
      • By Classification
      • By Application
    • Market Attractiveness Analysis
      • By Country
      • By Classification
      • By Application
    • Key Takeaways
  15. Middle East & Africa Market Analysis 2020 to 2024 and Forecast 2025 to 2035, By Country
    • Historical Market Size Value (USD Million) Trend Analysis By Market Taxonomy, 2020 to 2024
    • Market Size Value (USD Million) Forecast By Market Taxonomy, 2025 to 2035
      • By Country
        • Kingdom of Saudi Arabia
        • Other GCC Countries
        • Turkiye
        • South Africa
        • Other African Union
        • Rest of Middle East & Africa
      • By Classification
      • By Application
    • Market Attractiveness Analysis
      • By Country
      • By Classification
      • By Application
    • Key Takeaways
  16. Key Countries Market Analysis
    • USA
      • Pricing Analysis
      • Market Share Analysis, 2024
        • By Classification
        • By Application
    • Canada
      • Pricing Analysis
      • Market Share Analysis, 2024
        • By Classification
        • By Application
    • Mexico
      • Pricing Analysis
      • Market Share Analysis, 2024
        • By Classification
        • By Application
    • Brazil
      • Pricing Analysis
      • Market Share Analysis, 2024
        • By Classification
        • By Application
    • Chile
      • Pricing Analysis
      • Market Share Analysis, 2024
        • By Classification
        • By Application
    • Germany
      • Pricing Analysis
      • Market Share Analysis, 2024
        • By Classification
        • By Application
    • UK
      • Pricing Analysis
      • Market Share Analysis, 2024
        • By Classification
        • By Application
    • Italy
      • Pricing Analysis
      • Market Share Analysis, 2024
        • By Classification
        • By Application
    • Spain
      • Pricing Analysis
      • Market Share Analysis, 2024
        • By Classification
        • By Application
    • France
      • Pricing Analysis
      • Market Share Analysis, 2024
        • By Classification
        • By Application
    • India
      • Pricing Analysis
      • Market Share Analysis, 2024
        • By Classification
        • By Application
    • ASEAN
      • Pricing Analysis
      • Market Share Analysis, 2024
        • By Classification
        • By Application
    • Australia & New Zealand
      • Pricing Analysis
      • Market Share Analysis, 2024
        • By Classification
        • By Application
    • China
      • Pricing Analysis
      • Market Share Analysis, 2024
        • By Classification
        • By Application
    • Japan
      • Pricing Analysis
      • Market Share Analysis, 2024
        • By Classification
        • By Application
    • South Korea
      • Pricing Analysis
      • Market Share Analysis, 2024
        • By Classification
        • By Application
    • Russia
      • Pricing Analysis
      • Market Share Analysis, 2024
        • By Classification
        • By Application
    • Poland
      • Pricing Analysis
      • Market Share Analysis, 2024
        • By Classification
        • By Application
    • Hungary
      • Pricing Analysis
      • Market Share Analysis, 2024
        • By Classification
        • By Application
    • Kingdom of Saudi Arabia
      • Pricing Analysis
      • Market Share Analysis, 2024
        • By Classification
        • By Application
    • Turkiye
      • Pricing Analysis
      • Market Share Analysis, 2024
        • By Classification
        • By Application
    • South Africa
      • Pricing Analysis
      • Market Share Analysis, 2024
        • By Classification
        • By Application
  17. Market Structure Analysis
    • Competition Dashboard
    • Competition Benchmarking
    • Market Share Analysis of Top Players
      • By Regional
      • By Classification
      • By Application
  18. Competition Analysis
    • Competition Deep Dive
      • Lanxess
        • Overview
        • Product Portfolio
        • Profitability by Market Segments (Product/Age /Sales Channel/Region)
        • Sales Footprint
        • Strategy Overview
          • Marketing Strategy
          • Product Strategy
          • Channel Strategy
      • BHAGWATI CHEMICALS
      • Anhui Jinquan Biotechnology
      • Xinyi Yijin Chemical
  19. Assumptions & Acronyms Used
  20. Research Methodology

List of Tables

  • Table 1: Global Market Value (USD Million) Forecast by Region, 2020 to 2035
  • Table 2: Global Market Value (USD Million) Forecast by Classification , 2020 to 2035
  • Table 3: Global Market Value (USD Million) Forecast by Application, 2020 to 2035
  • Table 4: North America Market Value (USD Million) Forecast by Country, 2020 to 2035
  • Table 5: North America Market Value (USD Million) Forecast by Classification , 2020 to 2035
  • Table 6: North America Market Value (USD Million) Forecast by Application, 2020 to 2035
  • Table 7: Latin America Market Value (USD Million) Forecast by Country, 2020 to 2035
  • Table 8: Latin America Market Value (USD Million) Forecast by Classification , 2020 to 2035
  • Table 9: Latin America Market Value (USD Million) Forecast by Application, 2020 to 2035
  • Table 10: Western Europe Market Value (USD Million) Forecast by Country, 2020 to 2035
  • Table 11: Western Europe Market Value (USD Million) Forecast by Classification , 2020 to 2035
  • Table 12: Western Europe Market Value (USD Million) Forecast by Application, 2020 to 2035
  • Table 13: Eastern Europe Market Value (USD Million) Forecast by Country, 2020 to 2035
  • Table 14: Eastern Europe Market Value (USD Million) Forecast by Classification , 2020 to 2035
  • Table 15: Eastern Europe Market Value (USD Million) Forecast by Application, 2020 to 2035
  • Table 16: East Asia Market Value (USD Million) Forecast by Country, 2020 to 2035
  • Table 17: East Asia Market Value (USD Million) Forecast by Classification , 2020 to 2035
  • Table 18: East Asia Market Value (USD Million) Forecast by Application, 2020 to 2035
  • Table 19: South Asia and Pacific Market Value (USD Million) Forecast by Country, 2020 to 2035
  • Table 20: South Asia and Pacific Market Value (USD Million) Forecast by Classification , 2020 to 2035
  • Table 21: South Asia and Pacific Market Value (USD Million) Forecast by Application, 2020 to 2035
  • Table 22: Middle East & Africa Market Value (USD Million) Forecast by Country, 2020 to 2035
  • Table 23: Middle East & Africa Market Value (USD Million) Forecast by Classification , 2020 to 2035
  • Table 24: Middle East & Africa Market Value (USD Million) Forecast by Application, 2020 to 2035

List of Figures

  • Figure 1: Global Market Pricing Analysis
  • Figure 2: Global Market Value (USD Million) Forecast 2020-2035
  • Figure 3: Global Market Value Share and BPS Analysis by Classification , 2025 and 2035
  • Figure 4: Global Market Y to o to Y Growth Comparison by Classification , 2025-2035
  • Figure 5: Global Market Attractiveness Analysis by Classification
  • Figure 6: Global Market Value Share and BPS Analysis by Application, 2025 and 2035
  • Figure 7: Global Market Y to o to Y Growth Comparison by Application, 2025-2035
  • Figure 8: Global Market Attractiveness Analysis by Application
  • Figure 9: Global Market Value (USD Million) Share and BPS Analysis by Region, 2025 and 2035
  • Figure 10: Global Market Y to o to Y Growth Comparison by Region, 2025-2035
  • Figure 11: Global Market Attractiveness Analysis by Region
  • Figure 12: North America Market Incremental Dollar Opportunity, 2025-2035
  • Figure 13: Latin America Market Incremental Dollar Opportunity, 2025-2035
  • Figure 14: Western Europe Market Incremental Dollar Opportunity, 2025-2035
  • Figure 15: Eastern Europe Market Incremental Dollar Opportunity, 2025-2035
  • Figure 16: East Asia Market Incremental Dollar Opportunity, 2025-2035
  • Figure 17: South Asia and Pacific Market Incremental Dollar Opportunity, 2025-2035
  • Figure 18: Middle East & Africa Market Incremental Dollar Opportunity, 2025-2035
  • Figure 19: North America Market Value Share and BPS Analysis by Country, 2025 and 2035
  • Figure 20: North America Market Value Share and BPS Analysis by Classification , 2025 and 2035
  • Figure 21: North America Market Y to o to Y Growth Comparison by Classification , 2025-2035
  • Figure 22: North America Market Attractiveness Analysis by Classification
  • Figure 23: North America Market Value Share and BPS Analysis by Application, 2025 and 2035
  • Figure 24: North America Market Y to o to Y Growth Comparison by Application, 2025-2035
  • Figure 25: North America Market Attractiveness Analysis by Application
  • Figure 26: Latin America Market Value Share and BPS Analysis by Country, 2025 and 2035
  • Figure 27: Latin America Market Value Share and BPS Analysis by Classification , 2025 and 2035
  • Figure 28: Latin America Market Y to o to Y Growth Comparison by Classification , 2025-2035
  • Figure 29: Latin America Market Attractiveness Analysis by Classification
  • Figure 30: Latin America Market Value Share and BPS Analysis by Application, 2025 and 2035
  • Figure 31: Latin America Market Y to o to Y Growth Comparison by Application, 2025-2035
  • Figure 32: Latin America Market Attractiveness Analysis by Application
  • Figure 33: Western Europe Market Value Share and BPS Analysis by Country, 2025 and 2035
  • Figure 34: Western Europe Market Value Share and BPS Analysis by Classification , 2025 and 2035
  • Figure 35: Western Europe Market Y to o to Y Growth Comparison by Classification , 2025-2035
  • Figure 36: Western Europe Market Attractiveness Analysis by Classification
  • Figure 37: Western Europe Market Value Share and BPS Analysis by Application, 2025 and 2035
  • Figure 38: Western Europe Market Y to o to Y Growth Comparison by Application, 2025-2035
  • Figure 39: Western Europe Market Attractiveness Analysis by Application
  • Figure 40: Eastern Europe Market Value Share and BPS Analysis by Country, 2025 and 2035
  • Figure 41: Eastern Europe Market Value Share and BPS Analysis by Classification , 2025 and 2035
  • Figure 42: Eastern Europe Market Y to o to Y Growth Comparison by Classification , 2025-2035
  • Figure 43: Eastern Europe Market Attractiveness Analysis by Classification
  • Figure 44: Eastern Europe Market Value Share and BPS Analysis by Application, 2025 and 2035
  • Figure 45: Eastern Europe Market Y to o to Y Growth Comparison by Application, 2025-2035
  • Figure 46: Eastern Europe Market Attractiveness Analysis by Application
  • Figure 47: East Asia Market Value Share and BPS Analysis by Country, 2025 and 2035
  • Figure 48: East Asia Market Value Share and BPS Analysis by Classification , 2025 and 2035
  • Figure 49: East Asia Market Y to o to Y Growth Comparison by Classification , 2025-2035
  • Figure 50: East Asia Market Attractiveness Analysis by Classification
  • Figure 51: East Asia Market Value Share and BPS Analysis by Application, 2025 and 2035
  • Figure 52: East Asia Market Y to o to Y Growth Comparison by Application, 2025-2035
  • Figure 53: East Asia Market Attractiveness Analysis by Application
  • Figure 54: South Asia and Pacific Market Value Share and BPS Analysis by Country, 2025 and 2035
  • Figure 55: South Asia and Pacific Market Value Share and BPS Analysis by Classification , 2025 and 2035
  • Figure 56: South Asia and Pacific Market Y to o to Y Growth Comparison by Classification , 2025-2035
  • Figure 57: South Asia and Pacific Market Attractiveness Analysis by Classification
  • Figure 58: South Asia and Pacific Market Value Share and BPS Analysis by Application, 2025 and 2035
  • Figure 59: South Asia and Pacific Market Y to o to Y Growth Comparison by Application, 2025-2035
  • Figure 60: South Asia and Pacific Market Attractiveness Analysis by Application
  • Figure 61: Middle East & Africa Market Value Share and BPS Analysis by Country, 2025 and 2035
  • Figure 62: Middle East & Africa Market Value Share and BPS Analysis by Classification , 2025 and 2035
  • Figure 63: Middle East & Africa Market Y to o to Y Growth Comparison by Classification , 2025-2035
  • Figure 64: Middle East & Africa Market Attractiveness Analysis by Classification
  • Figure 65: Middle East & Africa Market Value Share and BPS Analysis by Application, 2025 and 2035
  • Figure 66: Middle East & Africa Market Y to o to Y Growth Comparison by Application, 2025-2035
  • Figure 67: Middle East & Africa Market Attractiveness Analysis by Application
  • Figure 68: Global Market - Tier Structure Analysis
  • Figure 69: Global Market - Company Share Analysis

Frequently Asked Questions

How big is the phosphorothioic trichloride market in 2025?

The global phosphorothioic trichloride market is estimated to be valued at USD 58.5 million in 2025.

What will be the size of phosphorothioic trichloride market in 2035?

The market size for the phosphorothioic trichloride market is projected to reach USD 99.9 million by 2035.

How much will be the phosphorothioic trichloride market growth between 2025 and 2035?

The phosphorothioic trichloride market is expected to grow at a 5.5% CAGR between 2025 and 2035.

What are the key product types in the phosphorothioic trichloride market?

The key product types in phosphorothioic trichloride market are purity>98% and purity 98%.

Which application segment to contribute significant share in the phosphorothioic trichloride market in 2025?

In terms of application, organic synthesis segment to command 52.3% share in the phosphorothioic trichloride market in 2025.

Future Market Insights

Phosphorothioic Trichloride Market

Chat With

MaRIA

Hi There, I am MaRIA, Your Market Research Intelligence Assistant. How may I help you?