
- Market Size (2026)
- USD 6.9 Bn
- Forecast (2036)
- USD 12.4 Bn
- CAGR (2026 to 2036)
- 6.0%
How big is the Polyacrylamide Market in 2026?
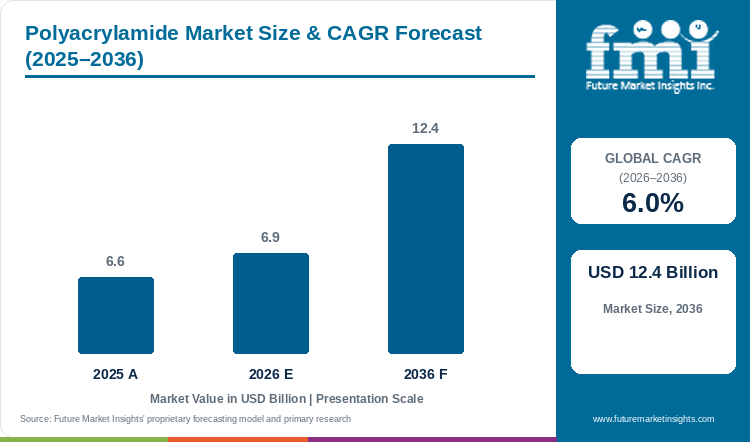
The global polyacrylamide market is estimated at USD 6.9 billion in 2026, compared with USD 6.6 billion in 2025, and is forecast to reach USD 12.40 billion by 2036, expanding at a CAGR of 6.0% from 2026 to 2036.
Demand for polyacrylamide is supported by industrial water clarification, process-water recycling and wastewater treatment activities. Anionic polyacrylamide accounts for 46.0% of the market by ionic type in 2026, while water treatment contributes 54.0% by application and dry powder holds 60.0% by physical form. Chemical selection is influenced by wastewater characteristics and the treatment performance required by industrial customers. Kemira's product portfolio distinguishes anionic grades used in water clarification and recycling from cationic grades used in biological-sludge dewatering. The company supplies both dry powder and emulsion formulations to accommodate different operating requirements. Manufacturers are also expanding their industrial water treatment services to strengthen customer relationships and recurring chemical sales. On January 9, 2026, Kemira completed the acquisition of Ohio-based AquaBlue for less than USD 10.0 million. AquaBlue expected approximately USD 9.0 million in revenue during 2025 and employed eight people, serving customers across food and beverage, manufacturing and healthcare. The acquisition follows Kemira's October 2025 purchase of Water Engineering in the United States. These investments expand Kemira's industrial water treatment service capabilities without requiring additional polymer manufacturing capacity. The company's growing service operations also provide opportunities to secure recurring chemical orders through existing industrial water treatment contracts.
Key Market Trends & Insights
- SNF's range of more than 1,100 organic coagulants and flocculants extends beyond polyacrylamide alone. Its breadth shows the adjacent chemistries competing for treatment spending; the entire range cannot be counted as polyacrylamide supply.
- SNF's emulsion handbook separates bulk viscosity from treatment performance. Viscosity specifies handling-pump requirements, so a higher viscosity is not evidence that an emulsion will earn a performance premium in a treatment contract.
- The Suez water handbook specifies 15 to 20 minutes for emulsion inversion. Liquid delivery therefore retains a preparation step; replacing powder with emulsion does not remove all make-up equipment or residence-time requirements.
Regional Highlights
- Europe has 30,354 urban wastewater plants in operation, according to the European Commission. The revised directive adds phased nutrient and micropollutant requirements to this operating base, creating renewal work alongside continued treatment; it does not prescribe a common polymer dose.
- In North America, the US EPA's 2022 Clean Watersheds Needs Survey identifies USD 66.6 billion of secondary-treatment needs and USD 83.6 billion of advanced-treatment needs. Those treatment categories are more relevant to chemical demand than the survey's separate sewer and stormwater categories, although none is a polymer-sales measure.
Table 1: Polyacrylamide Market Size and Forecast (USD billion and CAGR percentage), 2025 to 2036
| Market size and forecast | Value |
|---|---|
| Market size in 2025 | USD 6.6 billion |
| Estimated market size in 2026 | USD 6.9 billion |
| Market size forecast for 2035 | USD 11.7 billion |
| Projected market size by 2036 | USD 12.40 billion |
| CAGR from 2026 to 2036 | 6.0% |
| Added revenue from 2026 to 2036 | USD 5.50 billion |
Source: Future Market Insights, Polyacrylamide Market Report, 2026 to 2036.
Analyst Perspective
“A polyacrylamide order is won in the customer's water or process stream. Charge, molecular weight and dose must separate the solids there, while drinking-water grades also have to meet residual-monomer controls.”
- Nikhil Kaitwade, Principal Consultant, FMI
How is the Polyacrylamide Market segmented?
Ionic type describes the grade's charge, application identifies the process using it, and physical form distinguishes how it is supplied and prepared. These are separate classifications of the same market revenue.
- By Ionic Type: Anionic, Cationic, Non-ionic, Other.
- By Application: Water treatment, Petroleum, Papermaking, Mining and other uses.
- By Physical Form: Dry powder, Emulsion, Solution and other forms.
- By Region: North America, Latin America, Western Europe, Eastern Europe, East Asia, South Asia and Pacific, Middle East and Africa.
Why does anionic polyacrylamide lead by ionic type?
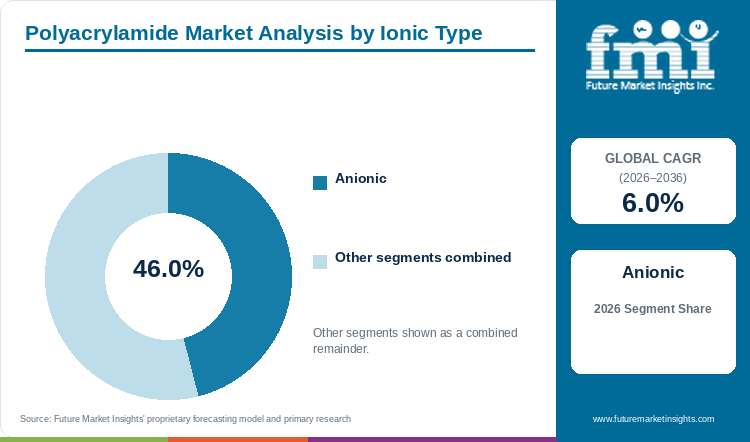
Anionic polyacrylamide accounts for 46.0% of the Polyacrylamide Market by ionic type in 2026.
Clarification and process-water recycling give anionic grades demand outside biological-sludge treatment. Kemira supplies those applications in both powder and inverse-emulsion form. The commercial distinction is between the treatment duties: the same application can support competing physical forms without moving the sale out of the anionic classification.
Biological-sludge treatment creates a limit to that lead. Kemira identifies cationic grades with this duty and states that a greater biological-sludge share typically requires higher cationic charge density. Expansion in biological treatment therefore does not automatically enlarge anionic sales at the same rate as total water-treatment demand. FMI's ionic-type outlook retains room for cationic, non-ionic and other grades alongside the anionic leader.
Table 2: Polyacrylamide Market Leading Ionic Type Share, 2026
| Leading Share | 2026 market share |
|---|---|
| Anionic polyacrylamide | 46.0% |
| All Other Segments Combined Share | 54.0% |
Source: Future Market Insights, Polyacrylamide Market Report, 2026 to 2036.
Why is water treatment the largest application?
Water treatment accounts for 54.0% of the Polyacrylamide Market by application in FMI's 2026 assessment.
The operating treatment network gives this application a broader demand base than new works alone. The European Commission's revised Urban Wastewater Treatment Directive extends collection and treatment requirements and distinguishes additional nutrient removal from micropollutant removal. FMI links the investment opportunity to the solids-separation stages affected by those changes, rather than treating every additional treatment stage as a polyacrylamide application.
Different chemical duties remain within that network. Solenis identifies clarification, thickening and sludge dewatering among its flocculant applications, across centrifuges and several filter technologies. This is an operating consumables business tied to water and solids throughput. A new plant's capital value does not establish the polymer quantity, and a process that removes dissolved pollutants may use a different treatment chemistry. The application forecast consequently depends on the processes commissioned, not the value of construction alone.
Table 3: Polyacrylamide Market Leading Application Share, 2026
| Leading Share | 2026 market share |
|---|---|
| Water treatment | 54.0% |
| All Other Segments Combined Share | 46.0% |
Source: Future Market Insights, Polyacrylamide Market Report, 2026 to 2036.
What supports dry powder as the leading physical form?
Dry powder accounts for 60.0% of the Polyacrylamide Market by physical form in FMI's 2026 assessment.
Powder's concentration advantage comes with a specific preparation requirement. SNF distinguishes dry powder from liquid emulsion and liquid solution, describing powder production through a gel that is ground and dried. Shipping less carrier liquid supports powder's commercial position, but dispersion and dissolution move to the consuming plant. The comparison therefore includes the site's make-up system, rather than delivered chemical price alone.
Emulsion retains a competing role where that preparation arrangement differs. Suez describes separate make-up systems for powders and emulsions, including an inversion stage for emulsion. A change of form can therefore require a change in preparation equipment even when the ionic type remains the same. FMI's physical-form assessment preserves this distinction: high concentration is a reason for powder demand, not proof that powder has the lowest total operating cost at every plant.
Table 4: Polyacrylamide Market Leading Physical Form Share, 2026
| Leading Share | 2026 market share |
|---|---|
| Dry powder | 60.0% |
| All Other Segments Combined Share | 40.0% |
Source: Future Market Insights, Polyacrylamide Market Report, 2026 to 2036.
What are the key drivers restraints and opportunities?
The forecast adds USD 5.50 billion between 2026 and 2036. The demand mechanisms differ: treatment capacity must enter operation, potable-water supply carries product-use restrictions, and sludge handling creates a separate cost case for dewatering chemicals.
Driver
India's treatment gap includes unused assets as well as missing capacity. The CPCB inventory published in 2021 recorded urban sewage generation of 72,368 million litres a day against installed treatment capacity of 31,841 million litres a day. Additional operation creates a chemical requirement where the selected process uses polymer; construction and commissioned treatment remain different stages in that sales opportunity.
Restraint
US drinking-water rules restrict the combination of residual acrylamide and applied polymer dose. EPA classifies acrylamide under a treatment technique, while the relevant rule requires annual certification for the applicable use. This makes product documentation and permitted use part of market access. A price discount cannot compensate for a grade or dose that fails those conditions.
Opportunity
Dewatering offers a commercial opening through the amount of sludge left for further handling. Solenis supplies flocculants for thickening and dewatering with centrifuges and several filter technologies. FMI sees the opportunity in improving the solids result on installed equipment: less water in the sludge changes the load sent to later handling or disposal. The opportunity remains specific to the sludge and equipment, rather than a claim of universal product superiority.
How do quality and drinking-water rules affect purchasing?
The US treatment technique addresses residual acrylamide and product dose in drinking-water use, rather than prohibiting polyacrylamide across industrial treatment. EPA identifies the treatment-technique requirement; 40 CFR 141.111 sets its certification basis. The restriction applies to the relevant potable-water use and should not be extended to unrelated wastewater, mining or process-water applications.
NSF lists named products and maximum use levels. These records narrow the comparison to a specific grade and use condition; they do not qualify every product sold under a supplier's corporate name. A substitution can therefore change both the chemical result and the documentation needed by the drinking-water customer.
What limits reliable polymer preparation and treatment?
Polymer preparation can obscure the cause of a higher dose. Suez warns that excessive agitation causes mechanical deterioration and describes controlled dispersion before dosing. A damaged polymer may perform poorly even when the original product specification is suitable. This separates a preparation fault from a need to purchase a different grade.
SNF recommends using the plant's own water in bench trials and discusses degradation associated with iron in some waters. Those conditions can explain a gap between a laboratory result and operation. FMI therefore treats make-up water, ageing and mixing as constraints on attainable treatment performance, rather than assuming that every shortfall represents insufficient chemical supply.
Where can polyacrylamide suppliers win additional business?
Industrial water services give chemical producers access to treatment accounts beyond municipal procurement. Kemira's January 2026 acquisition of AquaBlue adds a business serving food and beverage, manufacturing and healthcare customers. The transaction expands the service route to those industries; it does not establish additional polyacrylamide production capacity.
For FMI, the opening is the combination of an existing chemical portfolio with an acquired industrial service business. The transaction supports that specific route to customers. It does not establish a wider acquisition trend or quantify the polymer sales that will follow.
Polyacrylamide Market by Country (2026 to 2036)
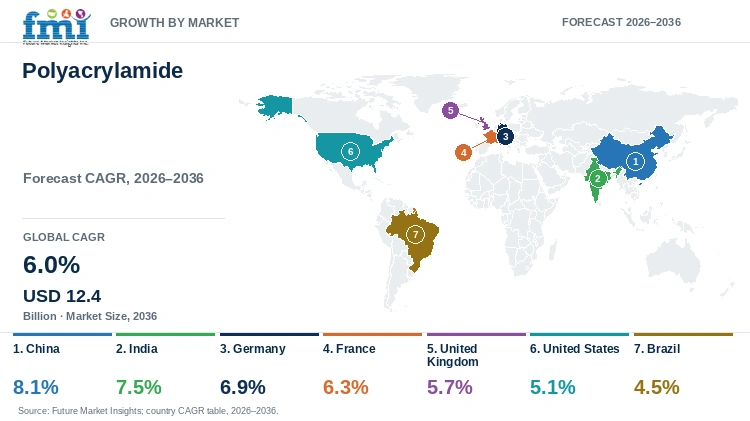
Table 5: Polyacrylamide Market Country Growth (CAGR percentage), 2026 to 2036
| Country | CAGR |
|---|---|
| China | 8.1% |
| India | 7.5% |
| Germany | 6.9% |
| France | 6.3% |
| United Kingdom | 5.7% |
| United States | 5.1% |
| Brazil | 4.5% |
Source: Future Market Insights, Polyacrylamide Market Report, 2026 to 2036.
What supports polyacrylamide demand in China?
China's high urban treatment coverage shifts the market argument towards the processes inside the works. The National Bureau of Statistics puts the urban sewage-treatment rate at 98.9% in 2024. New connections alone therefore provide an incomplete explanation of demand. Changes in solids handling and water reuse matter within a network that already treats most urban sewage. The coverage figure does not identify the treatment technology, the charge of polymer selected or the industrial flows outside that urban measure. It supports an operating-market argument, rather than a forecast based only on extending basic urban access.
Reuse adds another operating requirement. Chinese cities used more than 22 billion cubic metres of recycled water in 2025, according to the Ministry of Housing and Urban-Rural Development. The water must meet the quality required for its reuse; throughput is not a direct measure of polyacrylamide consumption. FMI's 8.1% CAGR forecast for China from 2026 to 2036 covers this reuse setting alongside industrial separation. The rate cannot be assigned to every municipal plant or every physical form.
The ionic mix depends on which processes expand. Kemira identifies anionic grades with clarification and recycled process water, and cationic grades with biological-sludge dewatering. In China, reuse growth and treatment renewal can consequently support different polymer grades at different stages of the same water system.
What drives polyacrylamide demand in India?
India's sewage inventory distinguishes installed assets from water actually treated. The CPCB inventory published in 2021 recorded 72,368 million litres a day of urban sewage generation and 31,841 million litres a day of installed capacity. A February 2024 parliamentary answer also reports 26,869 million litres a day of operational capacity and actual treatment of 20,235 million litres a day from the 2020 inventory. These historical measures describe several points between a treatment need and an operating process; they are not current polymer sales.
This distinction shapes India's 7.5% CAGR forecast from 2026 to 2036. Restoring utilisation at an existing works and commissioning a new works are different sources of additional treated flow. Either can expand chemical consumption where the process uses polyacrylamide, while an installed asset that remains idle cannot sustain the same operating demand. The spread between design, operation and actual treatment makes utilisation commercially relevant alongside construction. It also limits what can be inferred from a national capacity announcement without its operating status.
Industrial treatment adds a separate customer base. The government identifies operating common-effluent treatment plants and water-recovery systems in industrial clusters. Shared treatment serves industrial effluents rather than the municipal sewage represented by the national inventory, so those flows should not be assigned the same polymer requirement. For FMI, the industrial opportunity belongs to the separation and reuse processes actually operating in those clusters. Commissioning and continuing operation determine when that demand reaches the chemical supplier; an approved project alone does not establish a continuing order.
What sustains polyacrylamide demand in Germany?
Germany's sludge market connects polymer use with the route taken by the resulting solids. Destatis records approximately 1.67 million tonnes of dry matter disposed of from biological wastewater treatment in 2024. This is dry solids, rather than wet sludge moved by plants or polymer purchased. The Federal Environment Ministry reports that around 82%, or 1.37 million tonnes of dry matter, went to incineration in that year. The disposal mix makes water removal before subsequent handling commercially relevant to a large part of the operating sludge stream.
The same ministry records 732,000 tonnes of dry matter in mono-incineration during 2024. This gives dewatering a specific downstream setting: the polymer is selected before solids move into a thermal route. Solenis lists flocculants for centrifuges, chamber, membrane and belt filters, as well as thickening systems. Germany's 6.9% CAGR outlook from 2026 to 2036 therefore includes competition across installed dewatering technologies, rather than a uniform increase in dose at every wastewater works.
Treatment renewal can change that sludge stream. The European framework adds a phased programme of improvements, including further nutrient removal. Its effect on polymer consumption depends on the process implemented at each German plant; it does not impose a fixed polymer dose. A changed solids composition may alter charge requirements and dewatering performance even when the downstream disposal route remains thermal. FMI separates this renewal demand from the continuing chemical purchases of plants already operating, because the timing and grade implications differ.
What shapes polyacrylamide demand in France?
France combines a large treatment network with continuing asset renewal. The government's collective-sanitation portal lists 23,001 wastewater treatment plants in its 2024 database, with overall capacity of 106.5 million population equivalents. These measures describe the number of sites and their nominal treatment capacity, rather than actual polymer use. The network gives suppliers a dispersed operating market, but a small works and a large urban plant do not represent equivalent chemical accounts. Distribution coverage and the mix of plant sizes consequently matter alongside national capacity.
The portal estimates that around 3% of the plant stock needs renewal each year because of age or insufficient capacity. It identifies roughly a hundred works serving agglomerations of at least 2,000 population equivalents for annual reconstruction or rehabilitation. This is a recurring renewal setting, not a list of completed projects. FMI's 6.3% CAGR forecast for France from 2026 to 2036 incorporates operating demand alongside the changes in treatment and solids handling that renewal can bring.
Compliance also separates two kinds of intervention. The portal distinguishes equipment that failed to treat the incoming pollution load from a plant whose equipment is compliant but whose measured effluent performance is not. The first may call for new or modified assets; the second can concern operating performance, including an exceptional malfunction. Neither condition proves that more polyacrylamide is required. For chemical suppliers, the commercial issue is the treatment step being changed and its solids stream, rather than the compliance label alone. That keeps renewal opportunities distinct from routine replacement of an existing grade.
What supports polyacrylamide demand in the United Kingdom?
The UK's water-investment programme contains several different signals for treatment chemicals. Ofwat's 2024 price-review determinations cover 2025 to 2030; a parliamentary answer identifies a GBP 104 billion package including GBP 6 billion for nutrient removal. This evidence concerns regulated water investment in England and Wales, rather than a UK-wide commitment to buy polymer. Nutrient-removal work is a more specific process opportunity than the total budget, although the selected treatment method still determines its polyacrylamide requirement.
The same answer identifies more than GBP 11 billion to improve nearly 3,000 storm overflows across England and Wales over five years. That programme addresses a different part of the system from sludge dewatering. A sewer or storage improvement may alter the flow reaching treatment without creating a matching new polymer dosing stage. Combining all these investment categories into one chemical-demand measure would obscure which operating processes change. The capital programme is therefore a schedule of potential process changes, not a direct chemical order book.
FMI's 5.7% CAGR forecast for the United Kingdom from 2026 to 2036 spans that renewal work and continued consumption at existing works. Solenis identifies thickening and dewatering applications across several equipment technologies, illustrating the chemical duties inside a treatment plant. Changes to those duties are more relevant to a flocculant account than the aggregate budget. The rate does not imply that every investment category adds the same chemical volume, or that work in England and Wales establishes the same pace in the other UK nations.
What is leading polyacrylamide demand in the United States?
US drinking-water supply carries a product-use condition separate from wastewater performance. Public water systems using the relevant treatment additive must address residual acrylamide and dose under the applicable treatment technique. The rule requires annual certification and specifies acrylamide at 0.05% dosed at 1 ppm, or an equivalent dose-and-monomer combination. A wastewater application result cannot establish compliance with that potable-water condition. Nor should the rule be described as a prohibition across industrial and sludge-treatment uses.
The wastewater operating base is substantial. EPA's 2022 Clean Watersheds Needs Survey identifies 17,544 publicly owned treatment works serving 270.4 million people. These are wastewater facilities, not drinking-water plants or polyacrylamide accounts. FMI's 5.1% CAGR forecast for the United States from 2026 to 2036 spans continued treatment and renewal. The survey's secondary and advanced-treatment categories are relevant to that renewal setting, while sewer conveyance, stormwater and other categories have different implications for chemical use. The infrastructure total cannot be apportioned directly to polymer sales.
NSF listings identify named polyacrylamide products and maximum use levels. This makes the potable-water offer a grade-specific supply decision, with a permitted use that does not automatically transfer to another product from the same manufacturer. In wastewater, the competing grades instead address the plant's solids and installed separation process. Keeping those channels distinct explains why a supplier's large wastewater portfolio alone does not establish access to drinking-water orders, even within the same national treatment market.
What shapes polyacrylamide demand in Brazil?
Brazil's collection gap identifies room for sanitation expansion, but not the polymer process that will serve it. BNDES reports sewage-collection coverage of 62.3% of the population in the cited 2024 data. Network access is a different measure from treatment throughput. A connection can add flow to an existing works or form part of a wider construction programme; the chemical requirement arises in the treatment and solids-handling stages that actually operate. This distinction matters before the national coverage gap is translated into a market opportunity.
The SINISA system publishes separate water-supply and sewage-treatment modules. Its 2025 sewage report, using 2024 data, places collection-network coverage at 81.9% in the Southeast and 24.7% in the North. Those regional differences mean that a single national expansion argument misses both the established operating base and areas needing extensive network development. The figures concern collection, not a common treatment process or polymer dose. They support a geographically uneven opportunity rather than an assumption that all Brazilian plants expand together.
Brazil's 4.5% CAGR forecast from 2026 to 2036 covers an uneven progression from collection investment to operating treatment. The Southeast's larger connected population provides a different starting point from the North's lower network coverage. Additional collection can increase flow to existing plants or require new treatment capacity. Those alternatives change the timing of solids-handling demand; neither a network connection nor a regional coverage percentage fixes the polyacrylamide dose.
Who are the notable companies in the Polyacrylamide Market?
SNF, Kemira and Solenis overlap in treatment polymers but reach customers through different combinations of manufacturing, chemistry and service.
SNF supplies several ionic types in powder, emulsion and solution forms and describes water treatment as its core activity. Its commercial role spans the product forms required by different preparation systems. Kemira's charge and molecular-weight range separates clarification from biological-sludge applications. Its completed AquaBlue acquisition adds an industrial service business serving food and beverage, manufacturing and healthcare customers. This places customer access alongside polymer formulation in its offer, rather than adding another physical-form category or demonstrating a new global share.
Solenis supplies flocculants for clarification, thickening and dewatering with centrifuges and several filter technologies. Its position links the chemical offer to the installed solids-separation equipment. FMI sees these as overlapping competitive positions: breadth across forms, differentiation within the polymer range and access through industrial services. Corporate turnover and the size of a treatment catalogue would also include business outside the polyacrylamide boundary.
Key Developments in the Polyacrylamide Market
- On 9 January 2026, Kemira completed the acquisition of AquaBlue, an Ohio-based industrial water-treatment service company, in a transaction valued below USD 10 million. AquaBlue serves food and beverage, manufacturing and healthcare customers; the acquisition strengthens the service route to those users.
Key Players in the Polyacrylamide Market
- SNF
- Kemira
- Solenis
Polyacrylamide Market Report Scope
Table 6: Report Scope for the Polyacrylamide Market, 2026 to 2036
| Coverage field | Report scope |
|---|---|
| Market definition | Polyacrylamide products sold for water treatment, petroleum, papermaking, mining and other separation or process uses. |
| Product boundaries | Anionic, cationic, non-ionic and other polyacrylamide grades; unrelated coagulants and treatment equipment are excluded from polymer market value. |
| Quantitative units | USD billion for market value; percentages for segment shares and forecast CAGR. |
| Forecast period | 2026 to 2036, with 2025 as the preceding reference and the 2035 forecast also shown. |
| Ionic type coverage | Anionic, cationic, non-ionic and other grades. |
| Application coverage | Water treatment, petroleum, papermaking, mining and other uses. |
| Physical form coverage | Dry powder, emulsion, solution and other forms, classified separately from ionic type. |
| Country profiles | China, India, Germany, France, United Kingdom, United States and Brazil; these detailed profiles do not delimit the global market. |
| Geographic coverage | Seven global regions with nested country coverage and separate detailed country profiles. |
| Competitive coverage | Grade selection, treatment qualification, polymer preparation, application service and verified supplier activities. |
Source: Future Market Insights, Polyacrylamide Market Report, 2026 to 2036.
Polyacrylamide Market Research Methodology
The market-value series, ionic-type share and country forecasts are considered alongside evidence on treatment and industrial uses. Secondary review covers treatment infrastructure, drinking-water requirements, producer technical material and company disclosures. FMI's application assessment considers the existing application mix, while its physical-form assessment considers historical form revenues alongside the commercial distinctions between powder, emulsion and solution products. Infrastructure capacity and company turnover are kept separate from polyacrylamide revenue; reported project status and the scope of each country's statistics are preserved.
Polyacrylamide Market by Segments
Polyacrylamide Market segmented by Ionic Type:
- Anionic
- Cationic
- Non-ionic
- Other
Polyacrylamide Market segmented by Application:
- Water treatment
- Petroleum
- Papermaking
- Mining and other uses
Polyacrylamide Market segmented by Physical Form:
- Dry powder
- Emulsion
- Solution and other forms
Polyacrylamide Market by Region
- North America
- United States
- Canada
- Latin America
- Brazil
- Mexico
- Argentina
- Chile
- Western Europe
- Germany
- France
- United Kingdom
- Italy
- Spain
- Benelux
- Nordics
- Eastern Europe
- Poland
- Czech Republic
- Romania
- Hungary
- East Asia
- China
- Japan
- South Korea
- Taiwan
- South Asia and Pacific
- India
- Singapore
- Other ASEAN countries
- Australia and New Zealand
- Middle East and Africa
- GCC Countries
- South Africa
- Türkiye
- Israel
Research Sources and Bibliography
- [1] Kemira. Chemical flocculants: Polymers for water treatment. Accessed 31 October 2026.
- [2] Kemira. Kemira acquires AquaBlue, Inc. 9 January 2026.
- [3] SNF. Industrial Water Treatment: product categories and commercial forms. Accessed 31 October 2026.
- [4] NSF. Drinking Water Treatment Chemicals: Polyacrylamide product listings. Accessed 31 October 2026.
- [5] Suez, Degrémont Water Handbook. Using polyelectrolyte polymers in water treatment. Accessed 31 October 2026.
- [6] European Commission. Urban wastewater: revised directive and treatment-plant information. Accessed 31 October 2026.
- [7] US Environmental Protection Agency. 2022 Clean Watersheds Needs Survey: results and Report to Congress. 2024; accessed 31 October 2026.
- [8] Government of India, Press Information Bureau. Sewage and common-effluent treatment information from the CPCB inventory. 7 April 2022, reporting the 2020 inventory published in 2021; Lok Sabha answer AU436, 5 February 2024, for operational and actual-use measures.
- [9] US Environmental Protection Agency. National Primary Drinking Water Regulations: Acrylamide treatment technique. Accessed 31 October 2026.
- [10] US Code of Federal Regulations. 40 CFR 141.111, Treatment techniques for acrylamide and epichlorohydrin. Accessed 31 October 2026.
- [11] Solenis. Water Treatment Solutions for Municipalities: drinking-water and wastewater product portfolio. Accessed 31 October 2026.
- [12] SNF. Polyacrylamide Emulsions Handbook: bench trials and preparation-water effects. Accessed 31 October 2026.
- [13] State Council of China, reporting the Ministry of Housing and Urban-Rural Development. China's 2025 urban recycled water utilization exceeds 22 billion cubic meters. 14 May 2026.
- [14] National Bureau of Statistics of China. Ecological and environmental achievements during the 14th Five-Year Plan, report seven. 3 June 2026.
- [15] Destatis. Table 32214-0002: Sewage sludge disposed of from biological wastewater treatment, 2024. Accessed 31 October 2026.
- [16] French Ministry responsible for ecology. Portail sur l'assainissement collectif: 2024 treatment-plant database and compliance information. Accessed 31 October 2026.
- [17] UK Parliament. Written answer 58384: PR24 water-sector investment and nutrient removal. June 2025.
- [18] BNDES. Sanitation Project Hub: 2024 collection coverage and project context. Accessed 31 October 2026.
- [19] Brazilian Ministry of Cities. Resultados SINISA: sanitation datasets and reporting modules. Updated 2 July 2026; accessed 31 October 2026.
- [20] German Federal Environment Ministry. Klärschlamm wird zunehmend für Wärme- und Energiegewinnung genutzt: 2024 sewage-sludge disposal data. 12 January 2026; accessed 1 November 2026.
- [21] Brazilian Ministry of Cities. Relatório dos Serviços de Esgotamento Sanitário, SINISA 2025, reference year 2024, collection-network coverage. Accessed 1 November 2026.
Table of Content
- Key Takeaways
- Market Size and CAGR
- Top Growth Driver
- Fastest Growing Segment
- Leading Region
- Key Companies
- Emerging Opportunities
- Executive Summary
- Global Market Outlook
- Demand-side Trends
- Supply-side Trends
- Technology Roadmap Analysis
- Analysis and Recommendations
- Analyst Perspective (What is happening? Why now? What should investors know?)
- Key Questions Answered
- How large is the market?
- What is the CAGR?
- What are key trends?
- Which region dominates?
- Who are the leaders?
Read More...
- Market Overview
- Market Coverage / Taxonomy
- Market Definition / Scope / Limitations
- Research Methodology
- Chapter Orientation
- Analytical Lens and Working Hypotheses
- Market Structure, Signals, and Trend Drivers
- Benchmarking and Cross-market Comparability
- Market Sizing, Forecasting, and Opportunity Mapping
- Research Design and Evidence Framework
- Desk Research Programme (Secondary Evidence)
- Expert Input and Fieldwork (Primary Evidence)
- Tooling, Models, and Reference Databases
- Data Engineering and Model Build
- Quality Assurance and Audit Trail
- Market Background
- Market Dynamics (Drivers, Restraints, Opportunity, Trends)
- Scenario Forecast (Optimistic, Likely, Conservative)
- Impact Analysis
- AI Impact
- Sustainability Impact
- Regulatory Impact
- Technology Impact
- Consumer / Buyer Analysis
- Purchase Drivers
- Adoption Barriers
- Buyer Journey
- Opportunity Map Analysis
- Product Life Cycle Analysis
- Supply Chain Analysis
- Investment Feasibility Matrix
- Value Chain Analysis
- PESTLE and Porter's Analysis
- Regulatory Landscape
- Regional Parent Market Outlook
- Production and Consumption Statistics
- Import and Export Statistics
- Global Market Analysis and Forecast, 2021 to 2036
- Historical Market Size Value (USD Billion) Analysis, 2021 to 2025
- Current and Future Market Size Value (USD Billion) Projections, 2026 to 2036
- Y-o-Y Growth Trend Analysis
- Absolute $ Opportunity Analysis
- Global Market Pricing Analysis, 2021 to 2036
- Global Market Analysis and Forecast, By Ionic Type, 2021 to 2036
- Introduction / Key Findings
- Historical Market Size Value (USD Billion) Analysis By Ionic Type, 2021 to 2025
- Current and Future Market Size Value (USD Billion) Analysis and Forecast By Ionic Type, 2026 to 2036
- Anionic
- Cationic
- Non-ionic
- Other
- Y-o-Y Growth Trend Analysis By Ionic Type, 2021 to 2025
- Absolute $ Opportunity Analysis By Ionic Type, 2026 to 2036
- Global Market Analysis and Forecast, By Application, 2021 to 2036
- Introduction / Key Findings
- Historical Market Size Value (USD Billion) Analysis By Application, 2021 to 2025
- Current and Future Market Size Value (USD Billion) Analysis and Forecast By Application, 2026 to 2036
- Water treatment
- Petroleum
- Papermaking
- Mining and other uses
- Y-o-Y Growth Trend Analysis By Application, 2021 to 2025
- Absolute $ Opportunity Analysis By Application, 2026 to 2036
- Global Market Analysis and Forecast, By Physical Form, 2021 to 2036
- Introduction / Key Findings
- Historical Market Size Value (USD Billion) Analysis By Physical Form, 2021 to 2025
- Current and Future Market Size Value (USD Billion) Analysis and Forecast By Physical Form, 2026 to 2036
- Dry powder
- Emulsion
- Solution and other forms
- Y-o-Y Growth Trend Analysis By Physical Form, 2021 to 2025
- Absolute $ Opportunity Analysis By Physical Form, 2026 to 2036
- Global Market Analysis and Forecast, By Region, 2021 to 2036
- Introduction
- Historical Market Size Value (USD Billion) Analysis By Region, 2021 to 2025
- Current Market Size Value (USD Billion) Analysis and Forecast By Region, 2026 to 2036
- North America
- Latin America
- Western Europe
- Eastern Europe
- East Asia
- South Asia and Pacific
- Middle East and Africa
- Market Attractiveness Analysis By Region
- North America Market Analysis and Forecast, By Country, 2021 to 2036
- Historical Market Size Value (USD Billion) Trend Analysis By Market Taxonomy, 2021 to 2025
- Market Size Value (USD Billion) Forecast By Market Taxonomy, 2026 to 2036
- By Country
- United States
- Canada
- By Ionic Type
- By Application
- By Physical Form
- By Country
- Market Attractiveness Analysis
- By Country
- By Ionic Type
- By Application
- By Physical Form
- Key Takeaways
- Latin America Market Analysis and Forecast, By Country
- Historical Market Size Value (USD Billion) Trend Analysis By Market Taxonomy, 2021 to 2025
- Market Size Value (USD Billion) Forecast By Market Taxonomy, 2026 to 2036
- By Country
- Brazil
- Mexico
- Argentina
- Chile
- By Ionic Type
- By Application
- By Physical Form
- By Country
- Market Attractiveness Analysis
- By Country
- By Ionic Type
- By Application
- By Physical Form
- Key Takeaways
- Western Europe Market Analysis and Forecast, By Country
- Historical Market Size Value (USD Billion) Trend Analysis By Market Taxonomy, 2021 to 2025
- Market Size Value (USD Billion) Forecast By Market Taxonomy, 2026 to 2036
- By Country
- Germany
- France
- United Kingdom
- Italy
- Spain
- Benelux
- Nordics
- By Ionic Type
- By Application
- By Physical Form
- By Country
- Market Attractiveness Analysis
- By Country
- By Ionic Type
- By Application
- By Physical Form
- Key Takeaways
- Eastern Europe Market Analysis and Forecast, By Country
- Historical Market Size Value (USD Billion) Trend Analysis By Market Taxonomy, 2021 to 2025
- Market Size Value (USD Billion) Forecast By Market Taxonomy, 2026 to 2036
- By Country
- Poland
- Czech Republic
- Romania
- Hungary
- By Ionic Type
- By Application
- By Physical Form
- By Country
- Market Attractiveness Analysis
- By Country
- By Ionic Type
- By Application
- By Physical Form
- Key Takeaways
- East Asia Market Analysis and Forecast, By Country
- Historical Market Size Value (USD Billion) Trend Analysis By Market Taxonomy, 2021 to 2025
- Market Size Value (USD Billion) Forecast By Market Taxonomy, 2026 to 2036
- By Country
- China
- Japan
- South Korea
- Taiwan
- By Ionic Type
- By Application
- By Physical Form
- By Country
- Market Attractiveness Analysis
- By Country
- By Ionic Type
- By Application
- By Physical Form
- Key Takeaways
- South Asia and Pacific Market Analysis and Forecast, By Country
- Historical Market Size Value (USD Billion) Trend Analysis By Market Taxonomy, 2021 to 2025
- Market Size Value (USD Billion) Forecast By Market Taxonomy, 2026 to 2036
- By Country
- India
- Singapore
- Other ASEAN countries
- Australia and New Zealand
- By Ionic Type
- By Application
- By Physical Form
- By Country
- Market Attractiveness Analysis
- By Country
- By Ionic Type
- By Application
- By Physical Form
- Key Takeaways
- Middle East and Africa Market Analysis and Forecast, By Country
- Historical Market Size Value (USD Billion) Trend Analysis By Market Taxonomy, 2021 to 2025
- Market Size Value (USD Billion) Forecast By Market Taxonomy, 2026 to 2036
- By Country
- GCC Countries
- South Africa
- Türkiye
- Israel
- By Ionic Type
- By Application
- By Physical Form
- By Country
- Market Attractiveness Analysis
- By Country
- By Ionic Type
- By Application
- By Physical Form
- Key Takeaways
- Key Countries Market Analysis
- United States
- Pricing Analysis
- Market Share Analysis, 2025
- By Ionic Type
- By Application
- By Physical Form
- Canada
- Pricing Analysis
- Market Share Analysis, 2025
- By Ionic Type
- By Application
- By Physical Form
- Mexico
- Pricing Analysis
- Market Share Analysis, 2025
- By Ionic Type
- By Application
- By Physical Form
- Brazil
- Pricing Analysis
- Market Share Analysis, 2025
- By Ionic Type
- By Application
- By Physical Form
- Chile
- Pricing Analysis
- Market Share Analysis, 2025
- By Ionic Type
- By Application
- By Physical Form
- Germany
- Pricing Analysis
- Market Share Analysis, 2025
- By Ionic Type
- By Application
- By Physical Form
- United Kingdom
- Pricing Analysis
- Market Share Analysis, 2025
- By Ionic Type
- By Application
- By Physical Form
- Italy
- Pricing Analysis
- Market Share Analysis, 2025
- By Ionic Type
- By Application
- By Physical Form
- Spain
- Pricing Analysis
- Market Share Analysis, 2025
- By Ionic Type
- By Application
- By Physical Form
- France
- Pricing Analysis
- Market Share Analysis, 2025
- By Ionic Type
- By Application
- By Physical Form
- India
- Pricing Analysis
- Market Share Analysis, 2025
- By Ionic Type
- By Application
- By Physical Form
- Australia and New Zealand
- Pricing Analysis
- Market Share Analysis, 2025
- By Ionic Type
- By Application
- By Physical Form
- China
- Pricing Analysis
- Market Share Analysis, 2025
- By Ionic Type
- By Application
- By Physical Form
- Japan
- Pricing Analysis
- Market Share Analysis, 2025
- By Ionic Type
- By Application
- By Physical Form
- South Korea
- Pricing Analysis
- Market Share Analysis, 2025
- By Ionic Type
- By Application
- By Physical Form
- Poland
- Pricing Analysis
- Market Share Analysis, 2025
- By Ionic Type
- By Application
- By Physical Form
- Hungary
- Pricing Analysis
- Market Share Analysis, 2025
- By Ionic Type
- By Application
- By Physical Form
- Türkiye
- Pricing Analysis
- Market Share Analysis, 2025
- By Ionic Type
- By Application
- By Physical Form
- South Africa
- Pricing Analysis
- Market Share Analysis, 2025
- By Ionic Type
- By Application
- By Physical Form
- United States
- Market Structure Analysis
- Competition Dashboard
- Competition Benchmarking
- Market Share Analysis of Top Players
- By Regional
- By Ionic Type
- By Application
- By Physical Form
- Emerging Startups
- Innovation Benchmarking
- Competition Analysis
- Competition Deep Dive
- SNF
- Overview
- Product Portfolio
- Profitability by Market Segments
- Sales Footprint
- Strategy Overview
- Marketing Strategy
- Product Strategy
- Channel Strategy
- Kemira
- Solenis
- SNF
- Case Studies
- Success Stories
- Recent Developments
- Competition Deep Dive
- Assumptions & Acronyms Used
List of Tables
- Table 1: Global Market Value (USD Billion) Forecast by Region, 2021 to 2036
- Table 2: Global Market Value (USD Billion) Forecast by Ionic Type, 2021 to 2036
- Table 3: Global Market Value (USD Billion) Forecast by Application, 2021 to 2036
- Table 4: Global Market Value (USD Billion) Forecast by Physical Form, 2021 to 2036
- Table 5: North America Market Value (USD Billion) Forecast by Country, 2021 to 2036
- Table 6: North America Market Value (USD Billion) Forecast by Ionic Type, 2021 to 2036
- Table 7: North America Market Value (USD Billion) Forecast by Application, 2021 to 2036
- Table 8: North America Market Value (USD Billion) Forecast by Physical Form, 2021 to 2036
- Table 9: Latin America Market Value (USD Billion) Forecast by Country, 2021 to 2036
- Table 10: Latin America Market Value (USD Billion) Forecast by Ionic Type, 2021 to 2036
- Table 11: Latin America Market Value (USD Billion) Forecast by Application, 2021 to 2036
- Table 12: Latin America Market Value (USD Billion) Forecast by Physical Form, 2021 to 2036
- Table 13: Western Europe Market Value (USD Billion) Forecast by Country, 2021 to 2036
- Table 14: Western Europe Market Value (USD Billion) Forecast by Ionic Type, 2021 to 2036
- Table 15: Western Europe Market Value (USD Billion) Forecast by Application, 2021 to 2036
- Table 16: Western Europe Market Value (USD Billion) Forecast by Physical Form, 2021 to 2036
- Table 17: Eastern Europe Market Value (USD Billion) Forecast by Country, 2021 to 2036
- Table 18: Eastern Europe Market Value (USD Billion) Forecast by Ionic Type, 2021 to 2036
- Table 19: Eastern Europe Market Value (USD Billion) Forecast by Application, 2021 to 2036
- Table 20: Eastern Europe Market Value (USD Billion) Forecast by Physical Form, 2021 to 2036
- Table 21: East Asia Market Value (USD Billion) Forecast by Country, 2021 to 2036
- Table 22: East Asia Market Value (USD Billion) Forecast by Ionic Type, 2021 to 2036
- Table 23: East Asia Market Value (USD Billion) Forecast by Application, 2021 to 2036
- Table 24: East Asia Market Value (USD Billion) Forecast by Physical Form, 2021 to 2036
- Table 25: South Asia and Pacific Market Value (USD Billion) Forecast by Country, 2021 to 2036
- Table 26: South Asia and Pacific Market Value (USD Billion) Forecast by Ionic Type, 2021 to 2036
- Table 27: South Asia and Pacific Market Value (USD Billion) Forecast by Application, 2021 to 2036
- Table 28: South Asia and Pacific Market Value (USD Billion) Forecast by Physical Form, 2021 to 2036
- Table 29: Middle East and Africa Market Value (USD Billion) Forecast by Country, 2021 to 2036
- Table 30: Middle East and Africa Market Value (USD Billion) Forecast by Ionic Type, 2021 to 2036
- Table 31: Middle East and Africa Market Value (USD Billion) Forecast by Application, 2021 to 2036
- Table 32: Middle East and Africa Market Value (USD Billion) Forecast by Physical Form, 2021 to 2036
List of Figures
- Figure 1: Global Market Pricing Analysis
- Figure 2: Global Market Value (USD Billion) Forecast 2021-2036
- Figure 3: Global Market Value Share and BPS Analysis by Ionic Type, 2026 and 2036
- Figure 4: Global Market Y-o-Y Growth Comparison by Ionic Type, 2026-2036
- Figure 5: Global Market Attractiveness Analysis by Ionic Type
- Figure 6: Global Market Value Share and BPS Analysis by Application, 2026 and 2036
- Figure 7: Global Market Y-o-Y Growth Comparison by Application, 2026-2036
- Figure 8: Global Market Attractiveness Analysis by Application
- Figure 9: Global Market Value Share and BPS Analysis by Physical Form, 2026 and 2036
- Figure 10: Global Market Y-o-Y Growth Comparison by Physical Form, 2026-2036
- Figure 11: Global Market Attractiveness Analysis by Physical Form
- Figure 12: Global Market Value (USD Billion) Share and BPS Analysis by Region, 2026 and 2036
- Figure 13: Global Market Y-o-Y Growth Comparison by Region, 2026-2036
- Figure 14: Global Market Attractiveness Analysis by Region
- Figure 15: North America Market Incremental Dollar Opportunity, 2026-2036
- Figure 16: Latin America Market Incremental Dollar Opportunity, 2026-2036
- Figure 17: Western Europe Market Incremental Dollar Opportunity, 2026-2036
- Figure 18: Eastern Europe Market Incremental Dollar Opportunity, 2026-2036
- Figure 19: East Asia Market Incremental Dollar Opportunity, 2026-2036
- Figure 20: South Asia and Pacific Market Incremental Dollar Opportunity, 2026-2036
- Figure 21: Middle East and Africa Market Incremental Dollar Opportunity, 2026-2036
- Figure 22: North America Market Value Share and BPS Analysis by Country, 2026 and 2036
- Figure 23: North America Market Value Share and BPS Analysis by Ionic Type, 2026 and 2036
- Figure 24: North America Market Y-o-Y Growth Comparison by Ionic Type, 2026-2036
- Figure 25: North America Market Attractiveness Analysis by Ionic Type
- Figure 26: North America Market Value Share and BPS Analysis by Application, 2026 and 2036
- Figure 27: North America Market Y-o-Y Growth Comparison by Application, 2026-2036
- Figure 28: North America Market Attractiveness Analysis by Application
- Figure 29: North America Market Value Share and BPS Analysis by Physical Form, 2026 and 2036
- Figure 30: North America Market Y-o-Y Growth Comparison by Physical Form, 2026-2036
- Figure 31: North America Market Attractiveness Analysis by Physical Form
- Figure 32: Latin America Market Value Share and BPS Analysis by Country, 2026 and 2036
- Figure 33: Latin America Market Value Share and BPS Analysis by Ionic Type, 2026 and 2036
- Figure 34: Latin America Market Y-o-Y Growth Comparison by Ionic Type, 2026-2036
- Figure 35: Latin America Market Attractiveness Analysis by Ionic Type
- Figure 36: Latin America Market Value Share and BPS Analysis by Application, 2026 and 2036
- Figure 37: Latin America Market Y-o-Y Growth Comparison by Application, 2026-2036
- Figure 38: Latin America Market Attractiveness Analysis by Application
- Figure 39: Latin America Market Value Share and BPS Analysis by Physical Form, 2026 and 2036
- Figure 40: Latin America Market Y-o-Y Growth Comparison by Physical Form, 2026-2036
- Figure 41: Latin America Market Attractiveness Analysis by Physical Form
- Figure 42: Western Europe Market Value Share and BPS Analysis by Country, 2026 and 2036
- Figure 43: Western Europe Market Value Share and BPS Analysis by Ionic Type, 2026 and 2036
- Figure 44: Western Europe Market Y-o-Y Growth Comparison by Ionic Type, 2026-2036
- Figure 45: Western Europe Market Attractiveness Analysis by Ionic Type
- Figure 46: Western Europe Market Value Share and BPS Analysis by Application, 2026 and 2036
- Figure 47: Western Europe Market Y-o-Y Growth Comparison by Application, 2026-2036
- Figure 48: Western Europe Market Attractiveness Analysis by Application
- Figure 49: Western Europe Market Value Share and BPS Analysis by Physical Form, 2026 and 2036
- Figure 50: Western Europe Market Y-o-Y Growth Comparison by Physical Form, 2026-2036
- Figure 51: Western Europe Market Attractiveness Analysis by Physical Form
- Figure 52: Eastern Europe Market Value Share and BPS Analysis by Country, 2026 and 2036
- Figure 53: Eastern Europe Market Value Share and BPS Analysis by Ionic Type, 2026 and 2036
- Figure 54: Eastern Europe Market Y-o-Y Growth Comparison by Ionic Type, 2026-2036
- Figure 55: Eastern Europe Market Attractiveness Analysis by Ionic Type
- Figure 56: Eastern Europe Market Value Share and BPS Analysis by Application, 2026 and 2036
- Figure 57: Eastern Europe Market Y-o-Y Growth Comparison by Application, 2026-2036
- Figure 58: Eastern Europe Market Attractiveness Analysis by Application
- Figure 59: Eastern Europe Market Value Share and BPS Analysis by Physical Form, 2026 and 2036
- Figure 60: Eastern Europe Market Y-o-Y Growth Comparison by Physical Form, 2026-2036
- Figure 61: Eastern Europe Market Attractiveness Analysis by Physical Form
- Figure 62: East Asia Market Value Share and BPS Analysis by Country, 2026 and 2036
- Figure 63: East Asia Market Value Share and BPS Analysis by Ionic Type, 2026 and 2036
- Figure 64: East Asia Market Y-o-Y Growth Comparison by Ionic Type, 2026-2036
- Figure 65: East Asia Market Attractiveness Analysis by Ionic Type
- Figure 66: East Asia Market Value Share and BPS Analysis by Application, 2026 and 2036
- Figure 67: East Asia Market Y-o-Y Growth Comparison by Application, 2026-2036
- Figure 68: East Asia Market Attractiveness Analysis by Application
- Figure 69: East Asia Market Value Share and BPS Analysis by Physical Form, 2026 and 2036
- Figure 70: East Asia Market Y-o-Y Growth Comparison by Physical Form, 2026-2036
- Figure 71: East Asia Market Attractiveness Analysis by Physical Form
- Figure 72: South Asia and Pacific Market Value Share and BPS Analysis by Country, 2026 and 2036
- Figure 73: South Asia and Pacific Market Value Share and BPS Analysis by Ionic Type, 2026 and 2036
- Figure 74: South Asia and Pacific Market Y-o-Y Growth Comparison by Ionic Type, 2026-2036
- Figure 75: South Asia and Pacific Market Attractiveness Analysis by Ionic Type
- Figure 76: South Asia and Pacific Market Value Share and BPS Analysis by Application, 2026 and 2036
- Figure 77: South Asia and Pacific Market Y-o-Y Growth Comparison by Application, 2026-2036
- Figure 78: South Asia and Pacific Market Attractiveness Analysis by Application
- Figure 79: South Asia and Pacific Market Value Share and BPS Analysis by Physical Form, 2026 and 2036
- Figure 80: South Asia and Pacific Market Y-o-Y Growth Comparison by Physical Form, 2026-2036
- Figure 81: South Asia and Pacific Market Attractiveness Analysis by Physical Form
- Figure 82: Middle East and Africa Market Value Share and BPS Analysis by Country, 2026 and 2036
- Figure 83: Middle East and Africa Market Value Share and BPS Analysis by Ionic Type, 2026 and 2036
- Figure 84: Middle East and Africa Market Y-o-Y Growth Comparison by Ionic Type, 2026-2036
- Figure 85: Middle East and Africa Market Attractiveness Analysis by Ionic Type
- Figure 86: Middle East and Africa Market Value Share and BPS Analysis by Application, 2026 and 2036
- Figure 87: Middle East and Africa Market Y-o-Y Growth Comparison by Application, 2026-2036
- Figure 88: Middle East and Africa Market Attractiveness Analysis by Application
- Figure 89: Middle East and Africa Market Value Share and BPS Analysis by Physical Form, 2026 and 2036
- Figure 90: Middle East and Africa Market Y-o-Y Growth Comparison by Physical Form, 2026-2036
- Figure 91: Middle East and Africa Market Attractiveness Analysis by Physical Form
- Figure 92: Global Market - Tier Structure Analysis
- Figure 93: Global Market - Company Share Analysis
Frequently Asked Questions
What is the size and forecast of the Polyacrylamide Market?
The market is USD 6.9 billion in 2026, compared with USD 6.6 billion in 2025, and is forecast to reach USD 12.40 billion by 2036 at a 6.0% CAGR.
Which ionic type leads the Polyacrylamide Market?
Anionic polyacrylamide holds 46.0% by ionic type in 2026 in FMI's assessment.
Which application and physical form lead the Polyacrylamide Market?
Water treatment holds 54.0% by application, and dry powder holds 60.0% by physical form in FMI's 2026 assessment.
Which profiled country has the highest Polyacrylamide Market growth forecast?
China has the highest profiled CAGR at 8.1% from 2026 to 2036, followed by India at 7.5%.
Does one polyacrylamide grade serve every treatment plant?
No. Suppliers offer different charges, molecular weights and forms, while US drinking-water use also carries a residual-monomer and dose requirement. [1][9][10]
Preview the report firsthand - request a free sample
Get SampleGet the brochure for pricing and purchase details.
Get PDF
