Preformulation intermediates Market Size and Share Forecast Outlook 2025 to 2035

The Preformulation intermediates Market is estimated to be valued at USD 25.6 billion in 2025 and is projected to reach USD 42.1 billion by 2035, registering a compound annual growth rate (CAGR) of 5.1% over the forecast period.
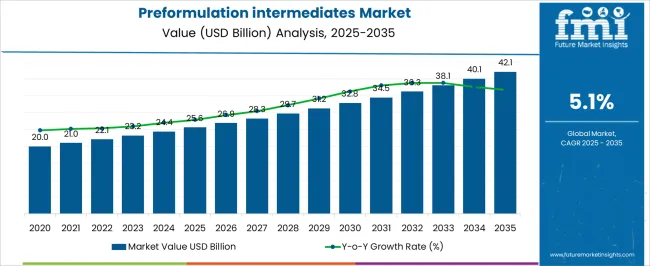
Quick Stats for Preformulation intermediates Market

  • Preformulation intermediates Market Value (2025): USD 25.6 billion
  • Preformulation intermediates Market Forecast Value (2035): USD 42.1 billion
  • Preformulation intermediates Market Forecast CAGR: 5.1%
  • Leading Segment in Preformulation intermediates Market in 2025: Innovative Drugs (47.6%)
  • Key Growth Regions in Preformulation intermediates Market: North America, Asia-Pacific, Europe
  • Top Key Players in Preformulation intermediates Market: Novartis AG, F. Hoffmann-La Roche Ltd, Bristol-Myers Squibb Company, Merck & Co., Inc., Pfizer Inc., Gilead Sciences, Inc., Amgen Inc., Johnson & Johnson, AstraZeneca plc, GlaxoSmithKline plc, Sanofi S.A., Eli Lilly and Company, Bluebird Bio, Inc., Adaptimmune Therapeutics plc, Kite Pharma (a Gilead Company), Cellectis S.A., Autolus Therapeutics plc
Preformulation Intermediates Market Market Value Analysis

Preformulation intermediates Market Key Takeaways

Metric Value
Preformulation intermediates Market Estimated Value in (2025 E) USD 25.6 billion
Preformulation intermediates Market Forecast Value in (2035 F) USD 42.1 billion
Forecast CAGR (2025 to 2035) 5.1%

Why is the Preformulation intermediates Market Growing?

The Preformulation Intermediates market is experiencing steady growth driven by the increasing focus on efficient drug development pipelines and high-quality active pharmaceutical ingredients. The current market scenario is characterized by growing investment in research and development, particularly in the field of oncology and complex therapeutic molecules. The market is being influenced by the rising demand for innovative drugs, advances in chemical synthesis techniques, and the need for robust preformulation studies that ensure stability, solubility, and bioavailability of final pharmaceutical products.

The future outlook is favorable as pharmaceutical companies continue to prioritize process optimization, risk reduction, and faster time-to-market strategies. Additionally, the emphasis on personalized medicine and targeted therapies is accelerating the need for high-purity intermediates.

Increasing regulatory scrutiny and quality standards are also encouraging the adoption of standardized preformulation intermediates These trends collectively pave the way for the market to expand, providing opportunities for suppliers to offer high-value solutions that meet evolving pharmaceutical development needs.

Segmental Analysis

The preformulation intermediates market is segmented by drug type, active pharmaceutical ingredients, application, synthesis, end user, and geographic regions. By drug type, preformulation intermediates market is divided into Innovative Drugs, Generic Prescription, and Over-The-Counter (OTC) Drugs. In terms of active pharmaceutical ingredients, preformulation intermediates market is classified into Chemical API and Biological API. Based on application, preformulation intermediates market is segmented into Oncology Drugs, Non-Steroidal Anti-Inflammatory Drugs, Cardiovascular Drugs, Anti-Diabetic Drugs, Neurology Drugs, Musculoskeletal Drugs, and Others Therapeutic Applications. By synthesis, preformulation intermediates market is segmented into Synthetic APIs and Biotech APIs. By end user, preformulation intermediates market is segmented into Pharmaceutical And Biotechnology Companies, Research Centers And Institutes, and Others. Regionally, the preformulation intermediates industry is classified into North America, Latin America, Western Europe, Eastern Europe, Balkan & Baltic Countries, Russia & Belarus, Central Asia, East Asia, South Asia & Pacific, and the Middle East & Africa.
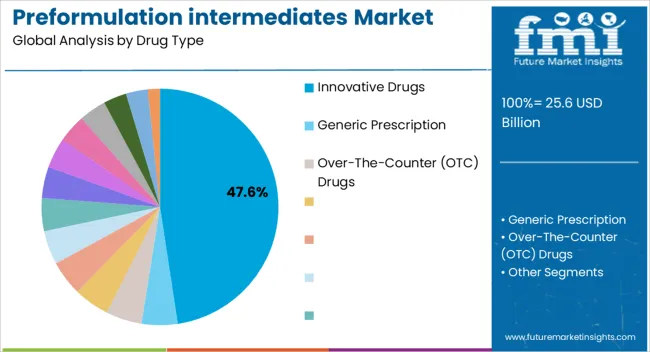
Insights into the Innovative Drugs Segment

Preformulation Intermediates Market Analysis By Drug Type

The Innovative Drugs segment is projected to hold 47.6% of the Preformulation Intermediates market revenue share in 2025, establishing it as the leading drug type. This dominance is being attributed to the rising demand for novel therapeutic molecules and biologically active compounds that require precise preformulation processes. The growth of this segment is supported by increasing investment in oncology, immunology, and rare disease treatments, where formulation stability and efficacy are critical.

Innovative drugs often involve complex chemical structures or biologics that necessitate specialized intermediates to maintain drug integrity during development and manufacturing. The segment’s expansion has also been reinforced by the adoption of advanced analytical and quality control measures that ensure compliance with regulatory standards.

Furthermore, pharmaceutical companies are increasingly focusing on pipeline diversification, which drives continuous demand for high-purity intermediates tailored to novel drug molecules The segment is expected to maintain leadership as innovation continues to be prioritized in global drug development.
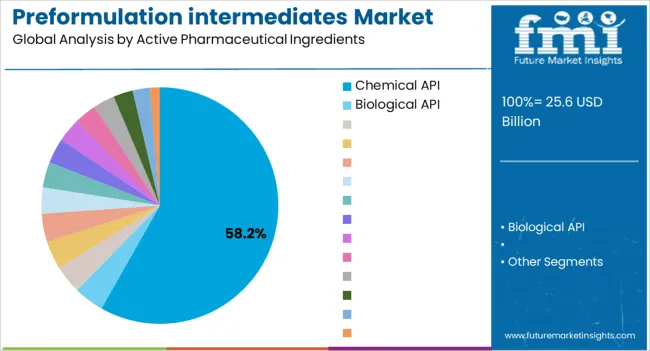
Insights into the Chemical API Segment

Preformulation Intermediates Market Analysis By Active Pharmaceutical Ingredients

The Chemical API application segment is expected to account for 58.2% of the Preformulation Intermediates market revenue share in 2025, making it the leading application segment. The prevalence of chemical APIs is being driven by their extensive use in the synthesis of small-molecule drugs and their critical role in ensuring consistent quality and performance of pharmaceutical formulations.

The segment has benefited from advancements in chemical synthesis, process optimization, and scalable manufacturing techniques that enhance yield and purity of intermediates. Additionally, increasing demand for high-value therapies and combination drugs has reinforced the need for standardized chemical APIs that can reliably support complex preformulation requirements.

The focus on oncology and specialty drugs, which often rely on precise chemical intermediates, has further accelerated growth As pharmaceutical companies continue to emphasize efficiency, reproducibility, and regulatory compliance in their production pipelines, the Chemical API segment is expected to retain its market-leading position, offering a foundation for the development of safe and effective drugs.
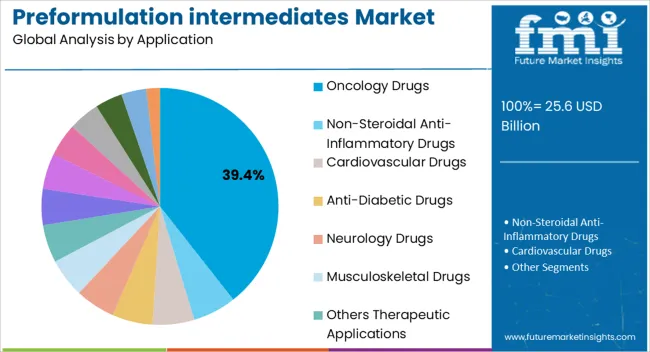
Insights into the Oncology Drugs Segment

Preformulation Intermediates Market Analysis By Application

The Oncology Drugs segment is anticipated to hold 39.4% of the Preformulation Intermediates market revenue share in 2025, reflecting its leading position among therapeutic applications. This prominence is being driven by the escalating prevalence of cancer worldwide and the intensifying focus on targeted and personalized therapies. Preformulation intermediates are critical in oncology drug development as they ensure stability, solubility, and bioavailability of complex therapeutic molecules, which are often highly sensitive to environmental factors.

Growth in this segment has been supported by increased R&D investments, rising clinical trials, and the introduction of advanced chemical APIs tailored for cancer treatment. The demand for innovative therapies, including small molecules and biologics, has further reinforced the importance of high-quality preformulation intermediates.

Additionally, regulatory requirements for stringent quality and reproducibility in oncology drug production have encouraged the adoption of standardized intermediates The segment is expected to sustain leadership as oncology remains a primary focus area for pharmaceutical innovation globally.

Market Overview

Preformulation intermediates Market: Market Insights

Preformulation intermediate is used for the Direct compressible and that comprises active substance and excipients. Preformulation intermediate is a combination of substance that is used as a raw material for producing pharmaceutical products and quality of preformulation intermediate has significant effect on safety and efficacy of medication.

Preformulation intermediates are the components of both quality and cost of the pharmaceutical products. Manufacturing of pharmaceutical products occurs in two steps, firstly raw material convert into preformulation intermediate or active pharmaceutical ingredients and then final product create by mixing of preformulation intermediate and other non-active ingredients such as excipient and pressing into tablets. Market of preformulation intermediates is too competitive with other producers. Preformulation intermediates is used in Dermal, Ophthalmic, Nasal and OTC drug formulations. Market of preformulation intermediate comprises different product segment such direct compression granules and capsule filling and micro encapsulated preformulation intermediates.

Preformulation intermediate is used in the selection of drug candidate, selection of formulation components, active pharmaceutical ingredients and among others drug manufacturing process. Basically Preformulation intermediate is used in formulation and development of new dosage form. Process of preformulation begin when synthesized drug show pharmacologic indication in animal models to evaluation in man.
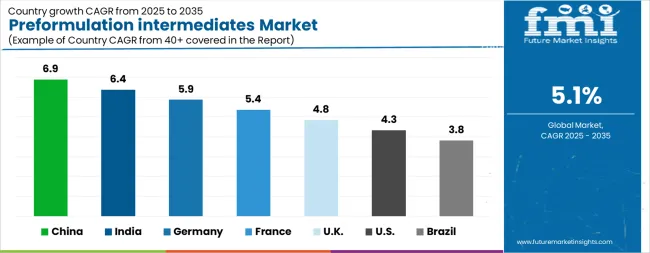
Analysis of Preformulation intermediates Market By Key Countries

Preformulation Intermediates Market Cagr Analysis By Country
Country CAGR
China 6.9%
India 6.4%
Germany 5.9%
France 5.4%
UK 4.8%
USA 4.3%
Brazil 3.8%

Country-wise Analysis

The Preformulation intermediates Market is expected to register a CAGR of 5.1% during the forecast period, exhibiting varied country level momentum. China leads with the highest CAGR of 6.9%, followed by India at 6.4%. Developed markets such as Germany, France, and the UK continue to expand steadily, while the USA is likely to grow at consistent rates. Brazil posts the lowest CAGR at 3.8%, yet still underscores a broadly positive trajectory for the global Preformulation intermediates Market. In 2024, Germany held a dominant revenue in the Western Europe market and is expected to grow with a CAGR of 5.9%. The USA Preformulation intermediates Market is estimated to be valued at USD 9.7 billion in 2025 and is anticipated to reach a valuation of USD 14.8 billion by 2035. Sales are projected to rise at a CAGR of 4.3% over the forecast period between 2025 and 2035. While Japan and South Korea markets are estimated to be valued at USD 1.4 billion and USD 755.5 million respectively in 2025.
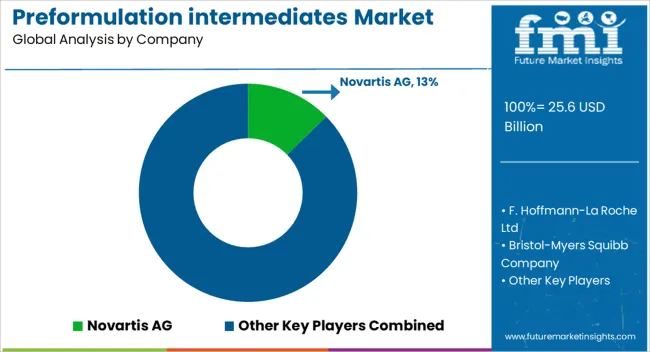
Key Players in the Preformulation intermediates Market

Preformulation Intermediates Market Analysis By Company

  • Novartis AG
  • F. Hoffmann-La Roche Ltd
  • Bristol-Myers Squibb Company
  • Merck & Co., Inc.
  • Pfizer Inc.
  • Gilead Sciences, Inc.
  • Amgen Inc.
  • Johnson & Johnson
  • AstraZeneca plc
  • GlaxoSmithKline plc
  • Sanofi S.A.
  • Eli Lilly and Company
  • Bluebird Bio, Inc.
  • Adaptimmune Therapeutics plc
  • Kite Pharma (a Gilead Company)
  • Cellectis S.A.
  • Autolus Therapeutics plc

Scope of the Report

Item Value
Quantitative Units USD 25.6 Billion
Drug Type Innovative Drugs, Generic Prescription, and Over-The-Counter (OTC) Drugs
Active Pharmaceutical Ingredients Chemical API and Biological API
Application Oncology Drugs, Non-Steroidal Anti-Inflammatory Drugs, Cardiovascular Drugs, Anti-Diabetic Drugs, Neurology Drugs, Musculoskeletal Drugs, and Others Therapeutic Applications
Synthesis Synthetic APIs and Biotech APIs
End User Pharmaceutical And Biotechnology Companies, Research Centers And Institutes, and Others
Regions Covered North America, Europe, Asia-Pacific, Latin America, Middle East & Africa
Country Covered United States, Canada, Germany, France, United Kingdom, China, Japan, India, Brazil, South Africa
Key Companies Profiled Novartis AG, F. Hoffmann-La Roche Ltd, Bristol-Myers Squibb Company, Merck & Co., Inc., Pfizer Inc., Gilead Sciences, Inc., Amgen Inc., Johnson & Johnson, AstraZeneca plc, GlaxoSmithKline plc, Sanofi S.A., Eli Lilly and Company, Bluebird Bio, Inc., Adaptimmune Therapeutics plc, Kite Pharma (a Gilead Company), Cellectis S.A., and Autolus Therapeutics plc

Preformulation intermediates Market by Segments

Drug Type:

  • Innovative Drugs
  • Generic Prescription
  • Over-The-Counter (OTC) Drugs

Active Pharmaceutical Ingredients:

  • Chemical API
  • Biological API

Application:

  • Oncology Drugs
  • Non-Steroidal Anti-Inflammatory Drugs
  • Cardiovascular Drugs
  • Anti-Diabetic Drugs
  • Neurology Drugs
  • Musculoskeletal Drugs
  • Others Therapeutic Applications

Synthesis:

  • Synthetic APIs
  • Biotech APIs

End User:

  • Pharmaceutical And Biotechnology Companies
  • Research Centers And Institutes
  • Others

Region:

  • North America
    • USA
    • Canada
    • Mexico
  • Latin America
    • Brazil
    • Chile
    • Rest of Latin America
  • Western Europe
    • Germany
    • UK
    • Italy
    • Spain
    • France
    • Nordic
    • BENELUX
    • Rest of Western Europe
  • Eastern Europe
    • Russia
    • Poland
    • Hungary
    • Balkan & Baltic
    • Rest of Eastern Europe
  • East Asia
    • China
    • Japan
    • South Korea
  • South Asia and Pacific
    • India
    • ASEAN
    • Australia & New Zealand
    • Rest of South Asia and Pacific
  • Middle East & Africa
    • Kingdom of Saudi Arabia
    • Other GCC Countries
    • Turkiye
    • South Africa
    • Other African Union
    • Rest of Middle East & Africa

Frequently Asked Questions

How big is the preformulation intermediates market in 2025?

The global preformulation intermediates market is estimated to be valued at USD 25.6 billion in 2025.

What will be the size of preformulation intermediates market in 2035?

The market size for the preformulation intermediates market is projected to reach USD 42.1 billion by 2035.

How much will be the preformulation intermediates market growth between 2025 and 2035?

The preformulation intermediates market is expected to grow at a 5.1% CAGR between 2025 and 2035.

What are the key product types in the preformulation intermediates market?

The key product types in preformulation intermediates market are innovative drugs, generic prescription and over-the-counter (otc) drugs.

Which active pharmaceutical ingredients segment to contribute significant share in the preformulation intermediates market in 2025?

In terms of active pharmaceutical ingredients, chemical api segment to command 58.2% share in the preformulation intermediates market in 2025.

Table of Content

  1. Executive Summary
    • Global Market Outlook
    • Demand-side Trends
    • Supply-side Trends
    • Technology Roadmap Analysis
    • Analysis and Recommendations
  2. Market Overview
    • Market Coverage / Taxonomy
    • Market Definition / Scope / Limitations
  3. Market Background
    • Market Dynamics
      • Drivers
      • Restraints
      • Opportunity
      • Trends
    • Scenario Forecast
      • Demand in Optimistic Scenario
      • Demand in Likely Scenario
      • Demand in Conservative Scenario
    • Opportunity Map Analysis
    • Product Life Cycle Analysis
    • Supply Chain Analysis
    • Investment Feasibility Matrix
    • Value Chain Analysis
    • PESTLE and Porter’s Analysis
    • Regulatory Landscape
    • Regional Parent Market Outlook
    • Production and Consumption Statistics
    • Import and Export Statistics
  4. Global Market Analysis 2020 to 2024 and Forecast, 2025 to 2035
    • Historical Market Size Value (USD Million) Analysis, 2020 to 2024
    • Current and Future Market Size Value (USD Million) Projections, 2025 to 2035
      • Y-o-Y Growth Trend Analysis
      • Absolute $ Opportunity Analysis
  5. Global Market Pricing Analysis 2020 to 2024 and Forecast 2025 to 2035
  6. Global Market Analysis 2020 to 2024 and Forecast 2025 to 2035, By Drug Type
    • Introduction / Key Findings
    • Historical Market Size Value (USD Million) Analysis By Drug Type , 2020 to 2024
    • Current and Future Market Size Value (USD Million) Analysis and Forecast By Drug Type , 2025 to 2035
      • Innovative Drugs
      • Generic Prescription
      • Over-The-Counter (OTC) Drugs
    • Y-o-Y Growth Trend Analysis By Drug Type , 2020 to 2024
    • Absolute $ Opportunity Analysis By Drug Type , 2025 to 2035
  7. Global Market Analysis 2020 to 2024 and Forecast 2025 to 2035, By Active Pharmaceutical Ingredients
    • Introduction / Key Findings
    • Historical Market Size Value (USD Million) Analysis By Active Pharmaceutical Ingredients, 2020 to 2024
    • Current and Future Market Size Value (USD Million) Analysis and Forecast By Active Pharmaceutical Ingredients, 2025 to 2035
      • Chemical API
      • Biological API
    • Y-o-Y Growth Trend Analysis By Active Pharmaceutical Ingredients, 2020 to 2024
    • Absolute $ Opportunity Analysis By Active Pharmaceutical Ingredients, 2025 to 2035
  8. Global Market Analysis 2020 to 2024 and Forecast 2025 to 2035, By Application
    • Introduction / Key Findings
    • Historical Market Size Value (USD Million) Analysis By Application, 2020 to 2024
    • Current and Future Market Size Value (USD Million) Analysis and Forecast By Application, 2025 to 2035
      • Oncology Drugs
      • Non-Steroidal Anti-Inflammatory Drugs
      • Cardiovascular Drugs
      • Anti-Diabetic Drugs
      • Neurology Drugs
      • Musculoskeletal Drugs
      • Others Therapeutic Applications
    • Y-o-Y Growth Trend Analysis By Application, 2020 to 2024
    • Absolute $ Opportunity Analysis By Application, 2025 to 2035
  9. Global Market Analysis 2020 to 2024 and Forecast 2025 to 2035, By Synthesis
    • Introduction / Key Findings
    • Historical Market Size Value (USD Million) Analysis By Synthesis, 2020 to 2024
    • Current and Future Market Size Value (USD Million) Analysis and Forecast By Synthesis, 2025 to 2035
      • Synthetic APIs
      • Biotech APIs
    • Y-o-Y Growth Trend Analysis By Synthesis, 2020 to 2024
    • Absolute $ Opportunity Analysis By Synthesis, 2025 to 2035
  10. Global Market Analysis 2020 to 2024 and Forecast 2025 to 2035, By End User
    • Introduction / Key Findings
    • Historical Market Size Value (USD Million) Analysis By End User, 2020 to 2024
    • Current and Future Market Size Value (USD Million) Analysis and Forecast By End User, 2025 to 2035
      • Pharmaceutical And Biotechnology Companies
      • Research Centers And Institutes
      • Others
    • Y-o-Y Growth Trend Analysis By End User, 2020 to 2024
    • Absolute $ Opportunity Analysis By End User, 2025 to 2035
  11. Global Market Analysis 2020 to 2024 and Forecast 2025 to 2035, By Region
    • Introduction
    • Historical Market Size Value (USD Million) Analysis By Region, 2020 to 2024
    • Current Market Size Value (USD Million) Analysis and Forecast By Region, 2025 to 2035
      • North America
      • Latin America
      • Western Europe
      • Eastern Europe
      • East Asia
      • South Asia and Pacific
      • Middle East & Africa
    • Market Attractiveness Analysis By Region
  12. North America Market Analysis 2020 to 2024 and Forecast 2025 to 2035, By Country
    • Historical Market Size Value (USD Million) Trend Analysis By Market Taxonomy, 2020 to 2024
    • Market Size Value (USD Million) Forecast By Market Taxonomy, 2025 to 2035
      • By Country
        • USA
        • Canada
        • Mexico
      • By Drug Type
      • By Active Pharmaceutical Ingredients
      • By Application
      • By Synthesis
      • By End User
    • Market Attractiveness Analysis
      • By Country
      • By Drug Type
      • By Active Pharmaceutical Ingredients
      • By Application
      • By Synthesis
      • By End User
    • Key Takeaways
  13. Latin America Market Analysis 2020 to 2024 and Forecast 2025 to 2035, By Country
    • Historical Market Size Value (USD Million) Trend Analysis By Market Taxonomy, 2020 to 2024
    • Market Size Value (USD Million) Forecast By Market Taxonomy, 2025 to 2035
      • By Country
        • Brazil
        • Chile
        • Rest of Latin America
      • By Drug Type
      • By Active Pharmaceutical Ingredients
      • By Application
      • By Synthesis
      • By End User
    • Market Attractiveness Analysis
      • By Country
      • By Drug Type
      • By Active Pharmaceutical Ingredients
      • By Application
      • By Synthesis
      • By End User
    • Key Takeaways
  14. Western Europe Market Analysis 2020 to 2024 and Forecast 2025 to 2035, By Country
    • Historical Market Size Value (USD Million) Trend Analysis By Market Taxonomy, 2020 to 2024
    • Market Size Value (USD Million) Forecast By Market Taxonomy, 2025 to 2035
      • By Country
        • Germany
        • UK
        • Italy
        • Spain
        • France
        • Nordic
        • BENELUX
        • Rest of Western Europe
      • By Drug Type
      • By Active Pharmaceutical Ingredients
      • By Application
      • By Synthesis
      • By End User
    • Market Attractiveness Analysis
      • By Country
      • By Drug Type
      • By Active Pharmaceutical Ingredients
      • By Application
      • By Synthesis
      • By End User
    • Key Takeaways
  15. Eastern Europe Market Analysis 2020 to 2024 and Forecast 2025 to 2035, By Country
    • Historical Market Size Value (USD Million) Trend Analysis By Market Taxonomy, 2020 to 2024
    • Market Size Value (USD Million) Forecast By Market Taxonomy, 2025 to 2035
      • By Country
        • Russia
        • Poland
        • Hungary
        • Balkan & Baltic
        • Rest of Eastern Europe
      • By Drug Type
      • By Active Pharmaceutical Ingredients
      • By Application
      • By Synthesis
      • By End User
    • Market Attractiveness Analysis
      • By Country
      • By Drug Type
      • By Active Pharmaceutical Ingredients
      • By Application
      • By Synthesis
      • By End User
    • Key Takeaways
  16. East Asia Market Analysis 2020 to 2024 and Forecast 2025 to 2035, By Country
    • Historical Market Size Value (USD Million) Trend Analysis By Market Taxonomy, 2020 to 2024
    • Market Size Value (USD Million) Forecast By Market Taxonomy, 2025 to 2035
      • By Country
        • China
        • Japan
        • South Korea
      • By Drug Type
      • By Active Pharmaceutical Ingredients
      • By Application
      • By Synthesis
      • By End User
    • Market Attractiveness Analysis
      • By Country
      • By Drug Type
      • By Active Pharmaceutical Ingredients
      • By Application
      • By Synthesis
      • By End User
    • Key Takeaways
  17. South Asia and Pacific Market Analysis 2020 to 2024 and Forecast 2025 to 2035, By Country
    • Historical Market Size Value (USD Million) Trend Analysis By Market Taxonomy, 2020 to 2024
    • Market Size Value (USD Million) Forecast By Market Taxonomy, 2025 to 2035
      • By Country
        • India
        • ASEAN
        • Australia & New Zealand
        • Rest of South Asia and Pacific
      • By Drug Type
      • By Active Pharmaceutical Ingredients
      • By Application
      • By Synthesis
      • By End User
    • Market Attractiveness Analysis
      • By Country
      • By Drug Type
      • By Active Pharmaceutical Ingredients
      • By Application
      • By Synthesis
      • By End User
    • Key Takeaways
  18. Middle East & Africa Market Analysis 2020 to 2024 and Forecast 2025 to 2035, By Country
    • Historical Market Size Value (USD Million) Trend Analysis By Market Taxonomy, 2020 to 2024
    • Market Size Value (USD Million) Forecast By Market Taxonomy, 2025 to 2035
      • By Country
        • Kingdom of Saudi Arabia
        • Other GCC Countries
        • Turkiye
        • South Africa
        • Other African Union
        • Rest of Middle East & Africa
      • By Drug Type
      • By Active Pharmaceutical Ingredients
      • By Application
      • By Synthesis
      • By End User
    • Market Attractiveness Analysis
      • By Country
      • By Drug Type
      • By Active Pharmaceutical Ingredients
      • By Application
      • By Synthesis
      • By End User
    • Key Takeaways
  19. Key Countries Market Analysis
    • USA
      • Pricing Analysis
      • Market Share Analysis, 2024
        • By Drug Type
        • By Active Pharmaceutical Ingredients
        • By Application
        • By Synthesis
        • By End User
    • Canada
      • Pricing Analysis
      • Market Share Analysis, 2024
        • By Drug Type
        • By Active Pharmaceutical Ingredients
        • By Application
        • By Synthesis
        • By End User
    • Mexico
      • Pricing Analysis
      • Market Share Analysis, 2024
        • By Drug Type
        • By Active Pharmaceutical Ingredients
        • By Application
        • By Synthesis
        • By End User
    • Brazil
      • Pricing Analysis
      • Market Share Analysis, 2024
        • By Drug Type
        • By Active Pharmaceutical Ingredients
        • By Application
        • By Synthesis
        • By End User
    • Chile
      • Pricing Analysis
      • Market Share Analysis, 2024
        • By Drug Type
        • By Active Pharmaceutical Ingredients
        • By Application
        • By Synthesis
        • By End User
    • Germany
      • Pricing Analysis
      • Market Share Analysis, 2024
        • By Drug Type
        • By Active Pharmaceutical Ingredients
        • By Application
        • By Synthesis
        • By End User
    • UK
      • Pricing Analysis
      • Market Share Analysis, 2024
        • By Drug Type
        • By Active Pharmaceutical Ingredients
        • By Application
        • By Synthesis
        • By End User
    • Italy
      • Pricing Analysis
      • Market Share Analysis, 2024
        • By Drug Type
        • By Active Pharmaceutical Ingredients
        • By Application
        • By Synthesis
        • By End User
    • Spain
      • Pricing Analysis
      • Market Share Analysis, 2024
        • By Drug Type
        • By Active Pharmaceutical Ingredients
        • By Application
        • By Synthesis
        • By End User
    • France
      • Pricing Analysis
      • Market Share Analysis, 2024
        • By Drug Type
        • By Active Pharmaceutical Ingredients
        • By Application
        • By Synthesis
        • By End User
    • India
      • Pricing Analysis
      • Market Share Analysis, 2024
        • By Drug Type
        • By Active Pharmaceutical Ingredients
        • By Application
        • By Synthesis
        • By End User
    • ASEAN
      • Pricing Analysis
      • Market Share Analysis, 2024
        • By Drug Type
        • By Active Pharmaceutical Ingredients
        • By Application
        • By Synthesis
        • By End User
    • Australia & New Zealand
      • Pricing Analysis
      • Market Share Analysis, 2024
        • By Drug Type
        • By Active Pharmaceutical Ingredients
        • By Application
        • By Synthesis
        • By End User
    • China
      • Pricing Analysis
      • Market Share Analysis, 2024
        • By Drug Type
        • By Active Pharmaceutical Ingredients
        • By Application
        • By Synthesis
        • By End User
    • Japan
      • Pricing Analysis
      • Market Share Analysis, 2024
        • By Drug Type
        • By Active Pharmaceutical Ingredients
        • By Application
        • By Synthesis
        • By End User
    • South Korea
      • Pricing Analysis
      • Market Share Analysis, 2024
        • By Drug Type
        • By Active Pharmaceutical Ingredients
        • By Application
        • By Synthesis
        • By End User
    • Russia
      • Pricing Analysis
      • Market Share Analysis, 2024
        • By Drug Type
        • By Active Pharmaceutical Ingredients
        • By Application
        • By Synthesis
        • By End User
    • Poland
      • Pricing Analysis
      • Market Share Analysis, 2024
        • By Drug Type
        • By Active Pharmaceutical Ingredients
        • By Application
        • By Synthesis
        • By End User
    • Hungary
      • Pricing Analysis
      • Market Share Analysis, 2024
        • By Drug Type
        • By Active Pharmaceutical Ingredients
        • By Application
        • By Synthesis
        • By End User
    • Kingdom of Saudi Arabia
      • Pricing Analysis
      • Market Share Analysis, 2024
        • By Drug Type
        • By Active Pharmaceutical Ingredients
        • By Application
        • By Synthesis
        • By End User
    • Turkiye
      • Pricing Analysis
      • Market Share Analysis, 2024
        • By Drug Type
        • By Active Pharmaceutical Ingredients
        • By Application
        • By Synthesis
        • By End User
    • South Africa
      • Pricing Analysis
      • Market Share Analysis, 2024
        • By Drug Type
        • By Active Pharmaceutical Ingredients
        • By Application
        • By Synthesis
        • By End User
  20. Market Structure Analysis
    • Competition Dashboard
    • Competition Benchmarking
    • Market Share Analysis of Top Players
      • By Regional
      • By Drug Type
      • By Active Pharmaceutical Ingredients
      • By Application
      • By Synthesis
      • By End User
  21. Competition Analysis
    • Competition Deep Dive
      • Novartis AG
        • Overview
        • Product Portfolio
        • Profitability by Market Segments (Product/Age /Sales Channel/Region)
        • Sales Footprint
        • Strategy Overview
          • Marketing Strategy
          • Product Strategy
          • Channel Strategy
      • F. Hoffmann-La Roche Ltd
      • Bristol-Myers Squibb Company
      • Merck & Co., Inc.
      • Pfizer Inc.
      • Gilead Sciences, Inc.
      • Amgen Inc.
      • Johnson & Johnson
      • AstraZeneca plc
      • GlaxoSmithKline plc
      • Sanofi S.A.
      • Eli Lilly and Company
      • Bluebird Bio, Inc.
      • Adaptimmune Therapeutics plc
      • Kite Pharma (a Gilead Company)
      • Cellectis S.A.
      • Autolus Therapeutics plc
  22. Assumptions & Acronyms Used
  23. Research Methodology

List of Tables

  • Table 1: Global Market Value (USD Million) Forecast by Region, 2020-2035
  • Table 2: Global Market Value (USD Million) Forecast by Drug Type , 2020-2035
  • Table 3: Global Market Value (USD Million) Forecast by Active Pharmaceutical Ingredients, 2020-2035
  • Table 4: Global Market Value (USD Million) Forecast by Application, 2020-2035
  • Table 5: Global Market Value (USD Million) Forecast by Synthesis, 2020-2035
  • Table 6: Global Market Value (USD Million) Forecast by End User, 2020-2035
  • Table 7: North America Market Value (USD Million) Forecast by Country, 2020-2035
  • Table 8: North America Market Value (USD Million) Forecast by Drug Type , 2020-2035
  • Table 9: North America Market Value (USD Million) Forecast by Active Pharmaceutical Ingredients, 2020-2035
  • Table 10: North America Market Value (USD Million) Forecast by Application, 2020-2035
  • Table 11: North America Market Value (USD Million) Forecast by Synthesis, 2020-2035
  • Table 12: North America Market Value (USD Million) Forecast by End User, 2020-2035
  • Table 13: Latin America Market Value (USD Million) Forecast by Country, 2020-2035
  • Table 14: Latin America Market Value (USD Million) Forecast by Drug Type , 2020-2035
  • Table 15: Latin America Market Value (USD Million) Forecast by Active Pharmaceutical Ingredients, 2020-2035
  • Table 16: Latin America Market Value (USD Million) Forecast by Application, 2020-2035
  • Table 17: Latin America Market Value (USD Million) Forecast by Synthesis, 2020-2035
  • Table 18: Latin America Market Value (USD Million) Forecast by End User, 2020-2035
  • Table 19: Western Europe Market Value (USD Million) Forecast by Country, 2020-2035
  • Table 20: Western Europe Market Value (USD Million) Forecast by Drug Type , 2020-2035
  • Table 21: Western Europe Market Value (USD Million) Forecast by Active Pharmaceutical Ingredients, 2020-2035
  • Table 22: Western Europe Market Value (USD Million) Forecast by Application, 2020-2035
  • Table 23: Western Europe Market Value (USD Million) Forecast by Synthesis, 2020-2035
  • Table 24: Western Europe Market Value (USD Million) Forecast by End User, 2020-2035
  • Table 25: Eastern Europe Market Value (USD Million) Forecast by Country, 2020-2035
  • Table 26: Eastern Europe Market Value (USD Million) Forecast by Drug Type , 2020-2035
  • Table 27: Eastern Europe Market Value (USD Million) Forecast by Active Pharmaceutical Ingredients, 2020-2035
  • Table 28: Eastern Europe Market Value (USD Million) Forecast by Application, 2020-2035
  • Table 29: Eastern Europe Market Value (USD Million) Forecast by Synthesis, 2020-2035
  • Table 30: Eastern Europe Market Value (USD Million) Forecast by End User, 2020-2035
  • Table 31: East Asia Market Value (USD Million) Forecast by Country, 2020-2035
  • Table 32: East Asia Market Value (USD Million) Forecast by Drug Type , 2020-2035
  • Table 33: East Asia Market Value (USD Million) Forecast by Active Pharmaceutical Ingredients, 2020-2035
  • Table 34: East Asia Market Value (USD Million) Forecast by Application, 2020-2035
  • Table 35: East Asia Market Value (USD Million) Forecast by Synthesis, 2020-2035
  • Table 36: East Asia Market Value (USD Million) Forecast by End User, 2020-2035
  • Table 37: South Asia and Pacific Market Value (USD Million) Forecast by Country, 2020-2035
  • Table 38: South Asia and Pacific Market Value (USD Million) Forecast by Drug Type , 2020-2035
  • Table 39: South Asia and Pacific Market Value (USD Million) Forecast by Active Pharmaceutical Ingredients, 2020-2035
  • Table 40: South Asia and Pacific Market Value (USD Million) Forecast by Application, 2020-2035
  • Table 41: South Asia and Pacific Market Value (USD Million) Forecast by Synthesis, 2020-2035
  • Table 42: South Asia and Pacific Market Value (USD Million) Forecast by End User, 2020-2035
  • Table 43: Middle East & Africa Market Value (USD Million) Forecast by Country, 2020-2035
  • Table 44: Middle East & Africa Market Value (USD Million) Forecast by Drug Type , 2020-2035
  • Table 45: Middle East & Africa Market Value (USD Million) Forecast by Active Pharmaceutical Ingredients, 2020-2035
  • Table 46: Middle East & Africa Market Value (USD Million) Forecast by Application, 2020-2035
  • Table 47: Middle East & Africa Market Value (USD Million) Forecast by Synthesis, 2020-2035
  • Table 48: Middle East & Africa Market Value (USD Million) Forecast by End User, 2020-2035

List of Figures

  • Figure 1: Global Market Pricing Analysis
  • Figure 2: Global Market Value (USD Million) Forecast 2020-2035
  • Figure 3: Global Market Value Share and BPS Analysis by Drug Type , 2025 and 2035
  • Figure 4: Global Market Y-o-Y Growth Comparison by Drug Type , 2025-2035
  • Figure 5: Global Market Attractiveness Analysis by Drug Type
  • Figure 6: Global Market Value Share and BPS Analysis by Active Pharmaceutical Ingredients, 2025 and 2035
  • Figure 7: Global Market Y-o-Y Growth Comparison by Active Pharmaceutical Ingredients, 2025-2035
  • Figure 8: Global Market Attractiveness Analysis by Active Pharmaceutical Ingredients
  • Figure 9: Global Market Value Share and BPS Analysis by Application, 2025 and 2035
  • Figure 10: Global Market Y-o-Y Growth Comparison by Application, 2025-2035
  • Figure 11: Global Market Attractiveness Analysis by Application
  • Figure 12: Global Market Value Share and BPS Analysis by Synthesis, 2025 and 2035
  • Figure 13: Global Market Y-o-Y Growth Comparison by Synthesis, 2025-2035
  • Figure 14: Global Market Attractiveness Analysis by Synthesis
  • Figure 15: Global Market Value Share and BPS Analysis by End User, 2025 and 2035
  • Figure 16: Global Market Y-o-Y Growth Comparison by End User, 2025-2035
  • Figure 17: Global Market Attractiveness Analysis by End User
  • Figure 18: Global Market Value (USD Million) Share and BPS Analysis by Region, 2025 and 2035
  • Figure 19: Global Market Y-o-Y Growth Comparison by Region, 2025-2035
  • Figure 20: Global Market Attractiveness Analysis by Region
  • Figure 21: North America Market Incremental Dollar Opportunity, 2025-2035
  • Figure 22: Latin America Market Incremental Dollar Opportunity, 2025-2035
  • Figure 23: Western Europe Market Incremental Dollar Opportunity, 2025-2035
  • Figure 24: Eastern Europe Market Incremental Dollar Opportunity, 2025-2035
  • Figure 25: East Asia Market Incremental Dollar Opportunity, 2025-2035
  • Figure 26: South Asia and Pacific Market Incremental Dollar Opportunity, 2025-2035
  • Figure 27: Middle East & Africa Market Incremental Dollar Opportunity, 2025-2035
  • Figure 28: North America Market Value Share and BPS Analysis by Country, 2025 and 2035
  • Figure 29: North America Market Value Share and BPS Analysis by Drug Type , 2025 and 2035
  • Figure 30: North America Market Y-o-Y Growth Comparison by Drug Type , 2025-2035
  • Figure 31: North America Market Attractiveness Analysis by Drug Type
  • Figure 32: North America Market Value Share and BPS Analysis by Active Pharmaceutical Ingredients, 2025 and 2035
  • Figure 33: North America Market Y-o-Y Growth Comparison by Active Pharmaceutical Ingredients, 2025-2035
  • Figure 34: North America Market Attractiveness Analysis by Active Pharmaceutical Ingredients
  • Figure 35: North America Market Value Share and BPS Analysis by Application, 2025 and 2035
  • Figure 36: North America Market Y-o-Y Growth Comparison by Application, 2025-2035
  • Figure 37: North America Market Attractiveness Analysis by Application
  • Figure 38: North America Market Value Share and BPS Analysis by Synthesis, 2025 and 2035
  • Figure 39: North America Market Y-o-Y Growth Comparison by Synthesis, 2025-2035
  • Figure 40: North America Market Attractiveness Analysis by Synthesis
  • Figure 41: North America Market Value Share and BPS Analysis by End User, 2025 and 2035
  • Figure 42: North America Market Y-o-Y Growth Comparison by End User, 2025-2035
  • Figure 43: North America Market Attractiveness Analysis by End User
  • Figure 44: Latin America Market Value Share and BPS Analysis by Country, 2025 and 2035
  • Figure 45: Latin America Market Value Share and BPS Analysis by Drug Type , 2025 and 2035
  • Figure 46: Latin America Market Y-o-Y Growth Comparison by Drug Type , 2025-2035
  • Figure 47: Latin America Market Attractiveness Analysis by Drug Type
  • Figure 48: Latin America Market Value Share and BPS Analysis by Active Pharmaceutical Ingredients, 2025 and 2035
  • Figure 49: Latin America Market Y-o-Y Growth Comparison by Active Pharmaceutical Ingredients, 2025-2035
  • Figure 50: Latin America Market Attractiveness Analysis by Active Pharmaceutical Ingredients
  • Figure 51: Latin America Market Value Share and BPS Analysis by Application, 2025 and 2035
  • Figure 52: Latin America Market Y-o-Y Growth Comparison by Application, 2025-2035
  • Figure 53: Latin America Market Attractiveness Analysis by Application
  • Figure 54: Latin America Market Value Share and BPS Analysis by Synthesis, 2025 and 2035
  • Figure 55: Latin America Market Y-o-Y Growth Comparison by Synthesis, 2025-2035
  • Figure 56: Latin America Market Attractiveness Analysis by Synthesis
  • Figure 57: Latin America Market Value Share and BPS Analysis by End User, 2025 and 2035
  • Figure 58: Latin America Market Y-o-Y Growth Comparison by End User, 2025-2035
  • Figure 59: Latin America Market Attractiveness Analysis by End User
  • Figure 60: Western Europe Market Value Share and BPS Analysis by Country, 2025 and 2035
  • Figure 61: Western Europe Market Value Share and BPS Analysis by Drug Type , 2025 and 2035
  • Figure 62: Western Europe Market Y-o-Y Growth Comparison by Drug Type , 2025-2035
  • Figure 63: Western Europe Market Attractiveness Analysis by Drug Type
  • Figure 64: Western Europe Market Value Share and BPS Analysis by Active Pharmaceutical Ingredients, 2025 and 2035
  • Figure 65: Western Europe Market Y-o-Y Growth Comparison by Active Pharmaceutical Ingredients, 2025-2035
  • Figure 66: Western Europe Market Attractiveness Analysis by Active Pharmaceutical Ingredients
  • Figure 67: Western Europe Market Value Share and BPS Analysis by Application, 2025 and 2035
  • Figure 68: Western Europe Market Y-o-Y Growth Comparison by Application, 2025-2035
  • Figure 69: Western Europe Market Attractiveness Analysis by Application
  • Figure 70: Western Europe Market Value Share and BPS Analysis by Synthesis, 2025 and 2035
  • Figure 71: Western Europe Market Y-o-Y Growth Comparison by Synthesis, 2025-2035
  • Figure 72: Western Europe Market Attractiveness Analysis by Synthesis
  • Figure 73: Western Europe Market Value Share and BPS Analysis by End User, 2025 and 2035
  • Figure 74: Western Europe Market Y-o-Y Growth Comparison by End User, 2025-2035
  • Figure 75: Western Europe Market Attractiveness Analysis by End User
  • Figure 76: Eastern Europe Market Value Share and BPS Analysis by Country, 2025 and 2035
  • Figure 77: Eastern Europe Market Value Share and BPS Analysis by Drug Type , 2025 and 2035
  • Figure 78: Eastern Europe Market Y-o-Y Growth Comparison by Drug Type , 2025-2035
  • Figure 79: Eastern Europe Market Attractiveness Analysis by Drug Type
  • Figure 80: Eastern Europe Market Value Share and BPS Analysis by Active Pharmaceutical Ingredients, 2025 and 2035
  • Figure 81: Eastern Europe Market Y-o-Y Growth Comparison by Active Pharmaceutical Ingredients, 2025-2035
  • Figure 82: Eastern Europe Market Attractiveness Analysis by Active Pharmaceutical Ingredients
  • Figure 83: Eastern Europe Market Value Share and BPS Analysis by Application, 2025 and 2035
  • Figure 84: Eastern Europe Market Y-o-Y Growth Comparison by Application, 2025-2035
  • Figure 85: Eastern Europe Market Attractiveness Analysis by Application
  • Figure 86: Eastern Europe Market Value Share and BPS Analysis by Synthesis, 2025 and 2035
  • Figure 87: Eastern Europe Market Y-o-Y Growth Comparison by Synthesis, 2025-2035
  • Figure 88: Eastern Europe Market Attractiveness Analysis by Synthesis
  • Figure 89: Eastern Europe Market Value Share and BPS Analysis by End User, 2025 and 2035
  • Figure 90: Eastern Europe Market Y-o-Y Growth Comparison by End User, 2025-2035
  • Figure 91: Eastern Europe Market Attractiveness Analysis by End User
  • Figure 92: East Asia Market Value Share and BPS Analysis by Country, 2025 and 2035
  • Figure 93: East Asia Market Value Share and BPS Analysis by Drug Type , 2025 and 2035
  • Figure 94: East Asia Market Y-o-Y Growth Comparison by Drug Type , 2025-2035
  • Figure 95: East Asia Market Attractiveness Analysis by Drug Type
  • Figure 96: East Asia Market Value Share and BPS Analysis by Active Pharmaceutical Ingredients, 2025 and 2035
  • Figure 97: East Asia Market Y-o-Y Growth Comparison by Active Pharmaceutical Ingredients, 2025-2035
  • Figure 98: East Asia Market Attractiveness Analysis by Active Pharmaceutical Ingredients
  • Figure 99: East Asia Market Value Share and BPS Analysis by Application, 2025 and 2035
  • Figure 100: East Asia Market Y-o-Y Growth Comparison by Application, 2025-2035
  • Figure 101: East Asia Market Attractiveness Analysis by Application
  • Figure 102: East Asia Market Value Share and BPS Analysis by Synthesis, 2025 and 2035
  • Figure 103: East Asia Market Y-o-Y Growth Comparison by Synthesis, 2025-2035
  • Figure 104: East Asia Market Attractiveness Analysis by Synthesis
  • Figure 105: East Asia Market Value Share and BPS Analysis by End User, 2025 and 2035
  • Figure 106: East Asia Market Y-o-Y Growth Comparison by End User, 2025-2035
  • Figure 107: East Asia Market Attractiveness Analysis by End User
  • Figure 108: South Asia and Pacific Market Value Share and BPS Analysis by Country, 2025 and 2035
  • Figure 109: South Asia and Pacific Market Value Share and BPS Analysis by Drug Type , 2025 and 2035
  • Figure 110: South Asia and Pacific Market Y-o-Y Growth Comparison by Drug Type , 2025-2035
  • Figure 111: South Asia and Pacific Market Attractiveness Analysis by Drug Type
  • Figure 112: South Asia and Pacific Market Value Share and BPS Analysis by Active Pharmaceutical Ingredients, 2025 and 2035
  • Figure 113: South Asia and Pacific Market Y-o-Y Growth Comparison by Active Pharmaceutical Ingredients, 2025-2035
  • Figure 114: South Asia and Pacific Market Attractiveness Analysis by Active Pharmaceutical Ingredients
  • Figure 115: South Asia and Pacific Market Value Share and BPS Analysis by Application, 2025 and 2035
  • Figure 116: South Asia and Pacific Market Y-o-Y Growth Comparison by Application, 2025-2035
  • Figure 117: South Asia and Pacific Market Attractiveness Analysis by Application
  • Figure 118: South Asia and Pacific Market Value Share and BPS Analysis by Synthesis, 2025 and 2035
  • Figure 119: South Asia and Pacific Market Y-o-Y Growth Comparison by Synthesis, 2025-2035
  • Figure 120: South Asia and Pacific Market Attractiveness Analysis by Synthesis
  • Figure 121: South Asia and Pacific Market Value Share and BPS Analysis by End User, 2025 and 2035
  • Figure 122: South Asia and Pacific Market Y-o-Y Growth Comparison by End User, 2025-2035
  • Figure 123: South Asia and Pacific Market Attractiveness Analysis by End User
  • Figure 124: Middle East & Africa Market Value Share and BPS Analysis by Country, 2025 and 2035
  • Figure 125: Middle East & Africa Market Value Share and BPS Analysis by Drug Type , 2025 and 2035
  • Figure 126: Middle East & Africa Market Y-o-Y Growth Comparison by Drug Type , 2025-2035
  • Figure 127: Middle East & Africa Market Attractiveness Analysis by Drug Type
  • Figure 128: Middle East & Africa Market Value Share and BPS Analysis by Active Pharmaceutical Ingredients, 2025 and 2035
  • Figure 129: Middle East & Africa Market Y-o-Y Growth Comparison by Active Pharmaceutical Ingredients, 2025-2035
  • Figure 130: Middle East & Africa Market Attractiveness Analysis by Active Pharmaceutical Ingredients
  • Figure 131: Middle East & Africa Market Value Share and BPS Analysis by Application, 2025 and 2035
  • Figure 132: Middle East & Africa Market Y-o-Y Growth Comparison by Application, 2025-2035
  • Figure 133: Middle East & Africa Market Attractiveness Analysis by Application
  • Figure 134: Middle East & Africa Market Value Share and BPS Analysis by Synthesis, 2025 and 2035
  • Figure 135: Middle East & Africa Market Y-o-Y Growth Comparison by Synthesis, 2025-2035
  • Figure 136: Middle East & Africa Market Attractiveness Analysis by Synthesis
  • Figure 137: Middle East & Africa Market Value Share and BPS Analysis by End User, 2025 and 2035
  • Figure 138: Middle East & Africa Market Y-o-Y Growth Comparison by End User, 2025-2035
  • Figure 139: Middle East & Africa Market Attractiveness Analysis by End User
  • Figure 140: Global Market - Tier Structure Analysis
  • Figure 141: Global Market - Company Share Analysis
Dashboard
Dashboard
Dashboard
Dashboard
Dashboard
Dashboard

Full Research Suite comprises of:

Market outlook & trends analysis

Market outlook & trends analysis

Interviews & case studies

Interviews & case studies

Strategic recommendations

Strategic recommendations

Vendor profiles & capabilities analysis

Vendor profiles & capabilities analysis

5-year forecasts

5-year forecasts

8 regions and 60+ country-level data splits

8 regions and 60+ country-level data splits

Market segment data splits

Market segment data splits

12 months of continuous data updates

12 months of continuous data updates

DELIVERED AS:

PDF EXCEL ONLINE

Full Research Suite


$5000

$7500

$10000

Buy Report Now
Similar Industry Reports

Similar Industry Reports

Pharmaceutical Intermediates Market

Pharmaceutical Intermediates Market Analysis - Size, Share & Forecast 2025 to 2035

Future Market Insights

Preformulation intermediates Market

Chat With MaRIA

Chat With

MaRIA

Hi There, I am MaRIA, Your Market Research Intelligence Assistant. How may I help you?