Profilometer Market Size and Share Forecast Outlook 2025 to 2035

The Profilometer Market is estimated to be valued at USD 532.4 million in 2025 and is projected to reach USD 867.2 million by 2035, registering a compound annual growth rate (CAGR) of 5.0% over the forecast period.
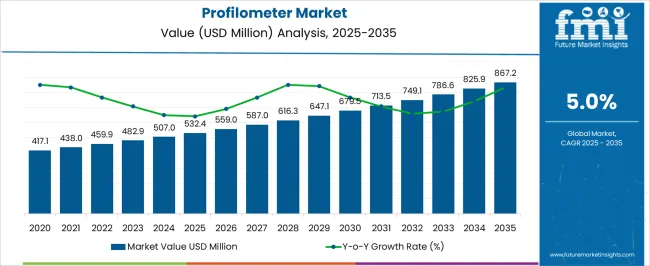
Quick Stats for Profilometer Market

  • Profilometer Market Value (2025): USD 532.4 million
  • Profilometer Market Forecast Value (2035): USD 867.2 million
  • Profilometer Market Forecast CAGR: 5.0%
  • Leading Segment in Profilometer Market in 2025: Contact Profilometers (50.0%)
  • Key Growth Regions in Profilometer Market: North America, Asia-Pacific, Europe
  • Top Key Players in Profilometer Market: KLA Corporation, Bruker Corporation, Mahr Federal Inc., Zygo Corporation, Mitutoyo Corporation, Jenoptik AG, Sensofar Group, Alicona Imaging GmbH
Profilometer Market Market Value Analysis

Profilometer Market Key Takeaways

Metric Value
Profilometer Market Estimated Value in (2025 E) USD 532.4 million
Profilometer Market Forecast Value in (2035 F) USD 867.2 million
Forecast CAGR (2025 to 2035) 5.0%

Why is the Profilometer Market Growing?

The Profilometer market is being expanded by increasing demand for precision surface measurement solutions across industries such as automotive, aerospace, electronics, and healthcare. The current scenario reflects the growing adoption of advanced measurement systems that can provide accurate texture, roughness, and dimensional analysis to meet stringent quality standards. The market is being influenced by the rising need for improved manufacturing processes, process optimization, and defect prevention.

Technological advancements that allow automated data acquisition, integration with machine learning models, and real-time monitoring have further supported market growth. Increasing investments in research and development, along with growing industrial automation, have paved the way for wider usage of profiling systems. The forecast for the market remains positive as industries are focusing on minimizing production errors and improving surface finish quality.

Furthermore, the rising implementation of electric vehicles and lightweight materials has driven the requirement for high-precision surface metrology As demand for improved measurement accuracy continues, the Profilometer market is expected to witness sustained expansion with new opportunities in emerging sectors.

Segmental Analysis

The profilometer market is segmented by equipment type, dimension, end use, and geographic regions. By equipment type, profilometer market is divided into Contact Profilometers and Non-Contact Profilometers. In terms of dimension, profilometer market is classified into 3D Profilometers and 2D Profilometers. Based on end use, profilometer market is segmented into Automotive, Chemical And Material Processing, Electronics And Semiconductors, Healthcare And Pharmaceuticals, and Others. Regionally, the profilometer industry is classified into North America, Latin America, Western Europe, Eastern Europe, Balkan & Baltic Countries, Russia & Belarus, Central Asia, East Asia, South Asia & Pacific, and the Middle East & Africa.
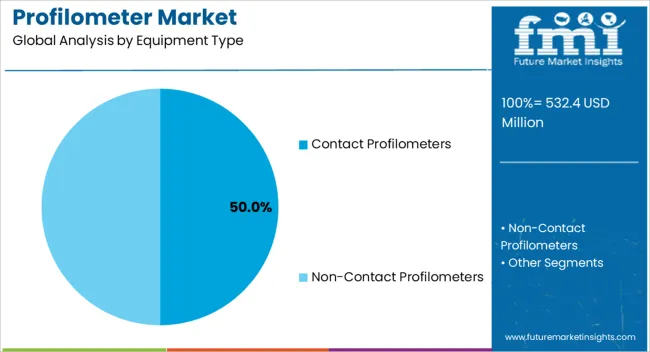
Insights into the Contact Profilometers Segment

Profilometer Market Analysis By Equipment Type

The Contact Profilometers equipment type is estimated to account for 50.00% of the overall Profilometer market revenue in 2025, making it the leading segment within this classification. This dominance is being driven by its ability to deliver high accuracy and repeatability in surface texture measurement, which is critical in precision engineering applications. Contact Profilometers are widely used in industries where material characterization, coating thickness analysis, and surface defect identification are essential.

The reliability of tactile measurements and compatibility with a wide range of materials have contributed to its preference in automotive, aerospace, and industrial manufacturing. The segment’s growth is further supported by advancements in sensor technology and measurement algorithms that enhance the ease of use and reduce setup time.

The ability to generate detailed surface profiles in real time has also played a significant role in expanding its applications As industries continue to prioritize product reliability and quality assurance, the adoption of Contact Profilometers is expected to remain strong, particularly in sectors where manual calibration and fine measurement are required.
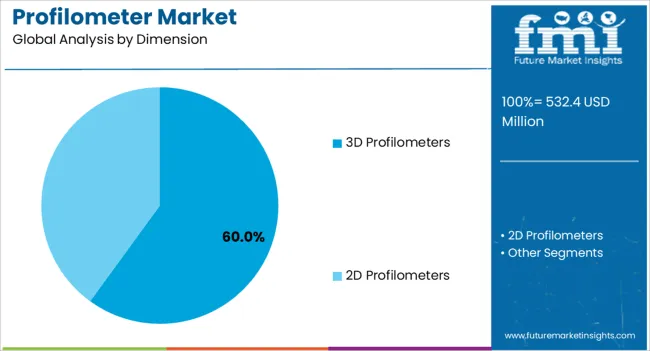
Insights into the 3D Profilometers Segment

Profilometer Market Analysis By Dimension

The Dimension segment is being led by 3D Profilometers, which are expected to hold 60.00% of the market share in 2025. The segment’s leadership is being supported by the increasing demand for comprehensive surface analysis and defect detection across diverse manufacturing and research sectors. 3D Profilometers are preferred for their ability to capture complex surface geometries, providing detailed topographical data that aids in process control and optimization.

The growing requirement for non-contact measurement methods, particularly in fragile or sensitive materials, has further encouraged adoption. Additionally, industries such as semiconductor fabrication, biomedical engineering, and precision optics have expanded the need for high-resolution three-dimensional imaging solutions.

The integration of advanced optics, high-speed scanning, and software-based data processing has made 3D Profilometers highly efficient in capturing data with minimal operator intervention As automation and precision-driven manufacturing environments evolve, the preference for non-contact, versatile profiling solutions is expected to support the continued growth of this segment.
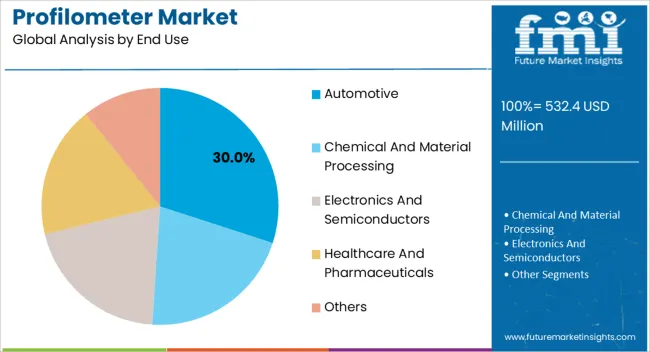
Insights into the Automotive End Use Segment

Profilometer Market Analysis By End Use

The Automotive end use segment is expected to hold 30.00% of the overall Profilometer market share in 2025, making it the largest contributor among various application areas. The segment’s growth is being supported by the increasing demand for surface measurement solutions in vehicle manufacturing, particularly for powertrain components, exterior body panels, and interior parts. The need for precision surface analysis in ensuring durability, aerodynamic efficiency, and component fitment has made profiling an integral part of the automotive production cycle.

With the industry shifting toward electric vehicles and lightweight composite materials, the requirement for accurate surface characterization has intensified, further boosting the adoption of Profilometers. The rise of automated manufacturing systems and stricter quality control standards has also driven investments in high-precision measurement tools.

Profilometers are being leveraged for both prototype development and mass production processes to ensure product consistency and regulatory compliance As automotive manufacturers increasingly focus on innovation, safety, and performance optimization, the adoption of advanced profiling technologies is expected to remain a key growth factor in this segment.

Market Overview

Profilometer Market: Overview

From the past few years, constant advancements in testing equipment are creating an increasing demand for different types of devices, as they help improve the efficiency and accuracy of various processes. Manufacturers of profilometers are undertaking the standardization of their products so as to offer industry-compliant products.

Increasing profilometer applications in identification of the topography of both, static as well as dynamic materials, is creating new opportunities for manufacturers to improve their product features. Different industry verticals are demanding profilometers, especially contact profilometers, for maintaining standardized quality of their products.

Profilometers are used for identifying and studying the surface morphology, surface roughness, and heights of steps. For detecting the profile of a surface, a profilometer is used in industrial applications. The adoption of profilometers is expected to increase significantly due to their ability to measure the precision of a surface with very high accuracy.
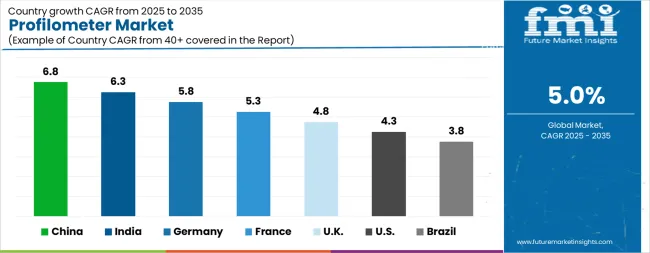
Analysis of Profilometer Market By Key Countries

Profilometer Market Cagr Analysis By Country
Country CAGR
China 6.8%
India 6.3%
Germany 5.8%
France 5.3%
UK 4.8%
USA 4.3%
Brazil 3.8%

Country-wise Analysis

The Profilometer Market is expected to register a CAGR of 5.0% during the forecast period, exhibiting varied country level momentum. China leads with the highest CAGR of 6.8%, followed by India at 6.3%. Developed markets such as Germany, France, and the UK continue to expand steadily, while the USA is likely to grow at consistent rates. Brazil posts the lowest CAGR at 3.8%, yet still underscores a broadly positive trajectory for the global Profilometer Market. In 2024, Germany held a dominant revenue in the Western Europe market and is expected to grow with a CAGR of 5.8%. The USA Profilometer Market is estimated to be valued at USD 186.7 million in 2025 and is anticipated to reach a valuation of USD 283.0 million by 2035. Sales are projected to rise at a CAGR of 4.3% over the forecast period between 2025 and 2035. While Japan and South Korea markets are estimated to be valued at USD 26.9 million and USD 14.3 million respectively in 2025.
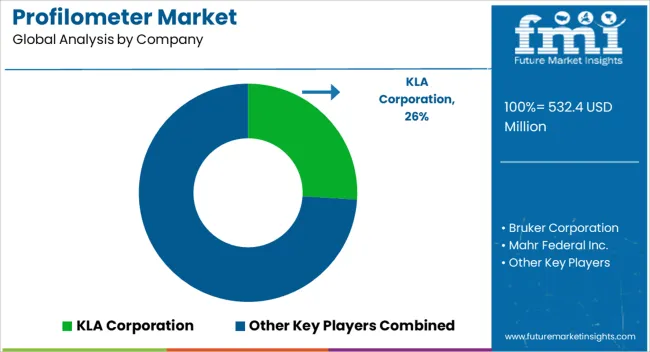
Key Players in the Profilometer Market

Profilometer Market Analysis By Company

  • KLA Corporation
  • Bruker Corporation
  • Mahr Federal Inc.
  • Zygo Corporation
  • Mitutoyo Corporation
  • Jenoptik AG
  • Sensofar Group
  • Alicona Imaging GmbH

Scope of the Report

Item Value
Quantitative Units USD 532.4 Million
Equipment Type Contact Profilometers and Non-Contact Profilometers
Dimension 3D Profilometers and 2D Profilometers
End Use Automotive, Chemical And Material Processing, Electronics And Semiconductors, Healthcare And Pharmaceuticals, and Others
Regions Covered North America, Europe, Asia-Pacific, Latin America, Middle East & Africa
Country Covered United States, Canada, Germany, France, United Kingdom, China, Japan, India, Brazil, South Africa
Key Companies Profiled KLA Corporation, Bruker Corporation, Mahr Federal Inc., Zygo Corporation, Mitutoyo Corporation, Jenoptik AG, Sensofar Group, and Alicona Imaging GmbH

Profilometer Market by Segments

Equipment Type:

  • Contact Profilometers
  • Non-Contact Profilometers

Dimension:

  • 3D Profilometers
  • 2D Profilometers

End Use:

  • Automotive
  • Chemical And Material Processing
  • Electronics And Semiconductors
  • Healthcare And Pharmaceuticals
  • Others

Region:

  • North America
    • USA
    • Canada
    • Mexico
  • Latin America
    • Brazil
    • Chile
    • Rest of Latin America
  • Western Europe
    • Germany
    • UK
    • Italy
    • Spain
    • France
    • Nordic
    • BENELUX
    • Rest of Western Europe
  • Eastern Europe
    • Russia
    • Poland
    • Hungary
    • Balkan & Baltic
    • Rest of Eastern Europe
  • East Asia
    • China
    • Japan
    • South Korea
  • South Asia and Pacific
    • India
    • ASEAN
    • Australia & New Zealand
    • Rest of South Asia and Pacific
  • Middle East & Africa
    • Kingdom of Saudi Arabia
    • Other GCC Countries
    • Turkiye
    • South Africa
    • Other African Union
    • Rest of Middle East & Africa

Table of Content

  1. Executive Summary
    • Global Market Outlook
    • Demand-side Trends
    • Supply-side Trends
    • Technology Roadmap Analysis
    • Analysis and Recommendations
  2. Market Overview
    • Market Coverage / Taxonomy
    • Market Definition / Scope / Limitations
  3. Market Background
    • Market Dynamics
      • Drivers
      • Restraints
      • Opportunity
      • Trends
    • Scenario Forecast
      • Demand in Optimistic Scenario
      • Demand in Likely Scenario
      • Demand in Conservative Scenario
    • Opportunity Map Analysis
    • Product Life Cycle Analysis
    • Supply Chain Analysis
    • Investment Feasibility Matrix
    • Value Chain Analysis
    • PESTLE and Porter’s Analysis
    • Regulatory Landscape
    • Regional Parent Market Outlook
    • Production and Consumption Statistics
    • Import and Export Statistics
  4. Global Market Analysis 2020 to 2024 and Forecast, 2025 to 2035
    • Historical Market Size Value (USD Million) Analysis, 2020 to 2024
    • Current and Future Market Size Value (USD Million) Projections, 2025 to 2035
      • Y-o-Y Growth Trend Analysis
      • Absolute $ Opportunity Analysis
  5. Global Market Pricing Analysis 2020 to 2024 and Forecast 2025 to 2035
  6. Global Market Analysis 2020 to 2024 and Forecast 2025 to 2035, By Equipment Type
    • Introduction / Key Findings
    • Historical Market Size Value (USD Million) Analysis By Equipment Type , 2020 to 2024
    • Current and Future Market Size Value (USD Million) Analysis and Forecast By Equipment Type , 2025 to 2035
      • Contact Profilometers
      • Non-Contact Profilometers
    • Y-o-Y Growth Trend Analysis By Equipment Type , 2020 to 2024
    • Absolute $ Opportunity Analysis By Equipment Type , 2025 to 2035
  7. Global Market Analysis 2020 to 2024 and Forecast 2025 to 2035, By Dimension
    • Introduction / Key Findings
    • Historical Market Size Value (USD Million) Analysis By Dimension, 2020 to 2024
    • Current and Future Market Size Value (USD Million) Analysis and Forecast By Dimension, 2025 to 2035
      • 3D Profilometers
      • 2D Profilometers
    • Y-o-Y Growth Trend Analysis By Dimension, 2020 to 2024
    • Absolute $ Opportunity Analysis By Dimension, 2025 to 2035
  8. Global Market Analysis 2020 to 2024 and Forecast 2025 to 2035, By End Use
    • Introduction / Key Findings
    • Historical Market Size Value (USD Million) Analysis By End Use, 2020 to 2024
    • Current and Future Market Size Value (USD Million) Analysis and Forecast By End Use, 2025 to 2035
      • Automotive
      • Chemical And Material Processing
      • Electronics And Semiconductors
      • Healthcare And Pharmaceuticals
      • Others
    • Y-o-Y Growth Trend Analysis By End Use, 2020 to 2024
    • Absolute $ Opportunity Analysis By End Use, 2025 to 2035
  9. Global Market Analysis 2020 to 2024 and Forecast 2025 to 2035, By Region
    • Introduction
    • Historical Market Size Value (USD Million) Analysis By Region, 2020 to 2024
    • Current Market Size Value (USD Million) Analysis and Forecast By Region, 2025 to 2035
      • North America
      • Latin America
      • Western Europe
      • Eastern Europe
      • East Asia
      • South Asia and Pacific
      • Middle East & Africa
    • Market Attractiveness Analysis By Region
  10. North America Market Analysis 2020 to 2024 and Forecast 2025 to 2035, By Country
    • Historical Market Size Value (USD Million) Trend Analysis By Market Taxonomy, 2020 to 2024
    • Market Size Value (USD Million) Forecast By Market Taxonomy, 2025 to 2035
      • By Country
        • U.S.
        • Canada
        • Mexico
      • By Equipment Type
      • By Dimension
      • By End Use
    • Market Attractiveness Analysis
      • By Country
      • By Equipment Type
      • By Dimension
      • By End Use
    • Key Takeaways
  11. Latin America Market Analysis 2020 to 2024 and Forecast 2025 to 2035, By Country
    • Historical Market Size Value (USD Million) Trend Analysis By Market Taxonomy, 2020 to 2024
    • Market Size Value (USD Million) Forecast By Market Taxonomy, 2025 to 2035
      • By Country
        • Brazil
        • Chile
        • Rest of Latin America
      • By Equipment Type
      • By Dimension
      • By End Use
    • Market Attractiveness Analysis
      • By Country
      • By Equipment Type
      • By Dimension
      • By End Use
    • Key Takeaways
  12. Western Europe Market Analysis 2020 to 2024 and Forecast 2025 to 2035, By Country
    • Historical Market Size Value (USD Million) Trend Analysis By Market Taxonomy, 2020 to 2024
    • Market Size Value (USD Million) Forecast By Market Taxonomy, 2025 to 2035
      • By Country
        • Germany
        • U.K.
        • Italy
        • Spain
        • France
        • Nordic
        • BENELUX
        • Rest of Western Europe
      • By Equipment Type
      • By Dimension
      • By End Use
    • Market Attractiveness Analysis
      • By Country
      • By Equipment Type
      • By Dimension
      • By End Use
    • Key Takeaways
  13. Eastern Europe Market Analysis 2020 to 2024 and Forecast 2025 to 2035, By Country
    • Historical Market Size Value (USD Million) Trend Analysis By Market Taxonomy, 2020 to 2024
    • Market Size Value (USD Million) Forecast By Market Taxonomy, 2025 to 2035
      • By Country
        • Russia
        • Poland
        • Hungary
        • Balkan & Baltic
        • Rest of Eastern Europe
      • By Equipment Type
      • By Dimension
      • By End Use
    • Market Attractiveness Analysis
      • By Country
      • By Equipment Type
      • By Dimension
      • By End Use
    • Key Takeaways
  14. East Asia Market Analysis 2020 to 2024 and Forecast 2025 to 2035, By Country
    • Historical Market Size Value (USD Million) Trend Analysis By Market Taxonomy, 2020 to 2024
    • Market Size Value (USD Million) Forecast By Market Taxonomy, 2025 to 2035
      • By Country
        • China
        • Japan
        • South Korea
      • By Equipment Type
      • By Dimension
      • By End Use
    • Market Attractiveness Analysis
      • By Country
      • By Equipment Type
      • By Dimension
      • By End Use
    • Key Takeaways
  15. South Asia and Pacific Market Analysis 2020 to 2024 and Forecast 2025 to 2035, By Country
    • Historical Market Size Value (USD Million) Trend Analysis By Market Taxonomy, 2020 to 2024
    • Market Size Value (USD Million) Forecast By Market Taxonomy, 2025 to 2035
      • By Country
        • India
        • ASEAN
        • Australia & New Zealand
        • Rest of South Asia and Pacific
      • By Equipment Type
      • By Dimension
      • By End Use
    • Market Attractiveness Analysis
      • By Country
      • By Equipment Type
      • By Dimension
      • By End Use
    • Key Takeaways
  16. Middle East & Africa Market Analysis 2020 to 2024 and Forecast 2025 to 2035, By Country
    • Historical Market Size Value (USD Million) Trend Analysis By Market Taxonomy, 2020 to 2024
    • Market Size Value (USD Million) Forecast By Market Taxonomy, 2025 to 2035
      • By Country
        • Kingdom of Saudi Arabia
        • Other GCC Countries
        • Turkiye
        • South Africa
        • Other African Union
        • Rest of Middle East & Africa
      • By Equipment Type
      • By Dimension
      • By End Use
    • Market Attractiveness Analysis
      • By Country
      • By Equipment Type
      • By Dimension
      • By End Use
    • Key Takeaways
  17. Key Countries Market Analysis
    • U.S.
      • Pricing Analysis
      • Market Share Analysis, 2024
        • By Equipment Type
        • By Dimension
        • By End Use
    • Canada
      • Pricing Analysis
      • Market Share Analysis, 2024
        • By Equipment Type
        • By Dimension
        • By End Use
    • Mexico
      • Pricing Analysis
      • Market Share Analysis, 2024
        • By Equipment Type
        • By Dimension
        • By End Use
    • Brazil
      • Pricing Analysis
      • Market Share Analysis, 2024
        • By Equipment Type
        • By Dimension
        • By End Use
    • Chile
      • Pricing Analysis
      • Market Share Analysis, 2024
        • By Equipment Type
        • By Dimension
        • By End Use
    • Germany
      • Pricing Analysis
      • Market Share Analysis, 2024
        • By Equipment Type
        • By Dimension
        • By End Use
    • U.K.
      • Pricing Analysis
      • Market Share Analysis, 2024
        • By Equipment Type
        • By Dimension
        • By End Use
    • Italy
      • Pricing Analysis
      • Market Share Analysis, 2024
        • By Equipment Type
        • By Dimension
        • By End Use
    • Spain
      • Pricing Analysis
      • Market Share Analysis, 2024
        • By Equipment Type
        • By Dimension
        • By End Use
    • France
      • Pricing Analysis
      • Market Share Analysis, 2024
        • By Equipment Type
        • By Dimension
        • By End Use
    • India
      • Pricing Analysis
      • Market Share Analysis, 2024
        • By Equipment Type
        • By Dimension
        • By End Use
    • ASEAN
      • Pricing Analysis
      • Market Share Analysis, 2024
        • By Equipment Type
        • By Dimension
        • By End Use
    • Australia & New Zealand
      • Pricing Analysis
      • Market Share Analysis, 2024
        • By Equipment Type
        • By Dimension
        • By End Use
    • China
      • Pricing Analysis
      • Market Share Analysis, 2024
        • By Equipment Type
        • By Dimension
        • By End Use
    • Japan
      • Pricing Analysis
      • Market Share Analysis, 2024
        • By Equipment Type
        • By Dimension
        • By End Use
    • South Korea
      • Pricing Analysis
      • Market Share Analysis, 2024
        • By Equipment Type
        • By Dimension
        • By End Use
    • Russia
      • Pricing Analysis
      • Market Share Analysis, 2024
        • By Equipment Type
        • By Dimension
        • By End Use
    • Poland
      • Pricing Analysis
      • Market Share Analysis, 2024
        • By Equipment Type
        • By Dimension
        • By End Use
    • Hungary
      • Pricing Analysis
      • Market Share Analysis, 2024
        • By Equipment Type
        • By Dimension
        • By End Use
    • Kingdom of Saudi Arabia
      • Pricing Analysis
      • Market Share Analysis, 2024
        • By Equipment Type
        • By Dimension
        • By End Use
    • Turkiye
      • Pricing Analysis
      • Market Share Analysis, 2024
        • By Equipment Type
        • By Dimension
        • By End Use
    • South Africa
      • Pricing Analysis
      • Market Share Analysis, 2024
        • By Equipment Type
        • By Dimension
        • By End Use
  18. Market Structure Analysis
    • Competition Dashboard
    • Competition Benchmarking
    • Market Share Analysis of Top Players
      • By Regional
      • By Equipment Type
      • By Dimension
      • By End Use
  19. Competition Analysis
    • Competition Deep Dive
      • KLA Corporation
        • Overview
        • Product Portfolio
        • Profitability by Market Segments (Product/Age /Sales Channel/Region)
        • Sales Footprint
        • Strategy Overview
          • Marketing Strategy
          • Product Strategy
          • Channel Strategy
      • Bruker Corporation
      • Mahr Federal Inc.
      • Zygo Corporation
      • Mitutoyo Corporation
      • Jenoptik AG
      • Sensofar Group
      • Alicona Imaging GmbH
  20. Assumptions & Acronyms Used
  21. Research Methodology

List of Tables

  • Table 1: Global Market Value (USD Million) Forecast by Region, 2020-2035
  • Table 2: Global Market Value (USD Million) Forecast by Equipment Type , 2020-2035
  • Table 3: Global Market Value (USD Million) Forecast by Dimension, 2020-2035
  • Table 4: Global Market Value (USD Million) Forecast by End Use, 2020-2035
  • Table 5: North America Market Value (USD Million) Forecast by Country, 2020-2035
  • Table 6: North America Market Value (USD Million) Forecast by Equipment Type , 2020-2035
  • Table 7: North America Market Value (USD Million) Forecast by Dimension, 2020-2035
  • Table 8: North America Market Value (USD Million) Forecast by End Use, 2020-2035
  • Table 9: Latin America Market Value (USD Million) Forecast by Country, 2020-2035
  • Table 10: Latin America Market Value (USD Million) Forecast by Equipment Type , 2020-2035
  • Table 11: Latin America Market Value (USD Million) Forecast by Dimension, 2020-2035
  • Table 12: Latin America Market Value (USD Million) Forecast by End Use, 2020-2035
  • Table 13: Western Europe Market Value (USD Million) Forecast by Country, 2020-2035
  • Table 14: Western Europe Market Value (USD Million) Forecast by Equipment Type , 2020-2035
  • Table 15: Western Europe Market Value (USD Million) Forecast by Dimension, 2020-2035
  • Table 16: Western Europe Market Value (USD Million) Forecast by End Use, 2020-2035
  • Table 17: Eastern Europe Market Value (USD Million) Forecast by Country, 2020-2035
  • Table 18: Eastern Europe Market Value (USD Million) Forecast by Equipment Type , 2020-2035
  • Table 19: Eastern Europe Market Value (USD Million) Forecast by Dimension, 2020-2035
  • Table 20: Eastern Europe Market Value (USD Million) Forecast by End Use, 2020-2035
  • Table 21: East Asia Market Value (USD Million) Forecast by Country, 2020-2035
  • Table 22: East Asia Market Value (USD Million) Forecast by Equipment Type , 2020-2035
  • Table 23: East Asia Market Value (USD Million) Forecast by Dimension, 2020-2035
  • Table 24: East Asia Market Value (USD Million) Forecast by End Use, 2020-2035
  • Table 25: South Asia and Pacific Market Value (USD Million) Forecast by Country, 2020-2035
  • Table 26: South Asia and Pacific Market Value (USD Million) Forecast by Equipment Type , 2020-2035
  • Table 27: South Asia and Pacific Market Value (USD Million) Forecast by Dimension, 2020-2035
  • Table 28: South Asia and Pacific Market Value (USD Million) Forecast by End Use, 2020-2035
  • Table 29: Middle East & Africa Market Value (USD Million) Forecast by Country, 2020-2035
  • Table 30: Middle East & Africa Market Value (USD Million) Forecast by Equipment Type , 2020-2035
  • Table 31: Middle East & Africa Market Value (USD Million) Forecast by Dimension, 2020-2035
  • Table 32: Middle East & Africa Market Value (USD Million) Forecast by End Use, 2020-2035

List of Figures

  • Figure 1: Global Market Pricing Analysis
  • Figure 2: Global Market Value (USD Million) Forecast 2020-2035
  • Figure 3: Global Market Value Share and BPS Analysis by Equipment Type , 2025 and 2035
  • Figure 4: Global Market Y-o-Y Growth Comparison by Equipment Type , 2025-2035
  • Figure 5: Global Market Attractiveness Analysis by Equipment Type
  • Figure 6: Global Market Value Share and BPS Analysis by Dimension, 2025 and 2035
  • Figure 7: Global Market Y-o-Y Growth Comparison by Dimension, 2025-2035
  • Figure 8: Global Market Attractiveness Analysis by Dimension
  • Figure 9: Global Market Value Share and BPS Analysis by End Use, 2025 and 2035
  • Figure 10: Global Market Y-o-Y Growth Comparison by End Use, 2025-2035
  • Figure 11: Global Market Attractiveness Analysis by End Use
  • Figure 12: Global Market Value (USD Million) Share and BPS Analysis by Region, 2025 and 2035
  • Figure 13: Global Market Y-o-Y Growth Comparison by Region, 2025-2035
  • Figure 14: Global Market Attractiveness Analysis by Region
  • Figure 15: North America Market Incremental Dollar Opportunity, 2025-2035
  • Figure 16: Latin America Market Incremental Dollar Opportunity, 2025-2035
  • Figure 17: Western Europe Market Incremental Dollar Opportunity, 2025-2035
  • Figure 18: Eastern Europe Market Incremental Dollar Opportunity, 2025-2035
  • Figure 19: East Asia Market Incremental Dollar Opportunity, 2025-2035
  • Figure 20: South Asia and Pacific Market Incremental Dollar Opportunity, 2025-2035
  • Figure 21: Middle East & Africa Market Incremental Dollar Opportunity, 2025-2035
  • Figure 22: North America Market Value Share and BPS Analysis by Country, 2025 and 2035
  • Figure 23: North America Market Value Share and BPS Analysis by Equipment Type , 2025 and 2035
  • Figure 24: North America Market Y-o-Y Growth Comparison by Equipment Type , 2025-2035
  • Figure 25: North America Market Attractiveness Analysis by Equipment Type
  • Figure 26: North America Market Value Share and BPS Analysis by Dimension, 2025 and 2035
  • Figure 27: North America Market Y-o-Y Growth Comparison by Dimension, 2025-2035
  • Figure 28: North America Market Attractiveness Analysis by Dimension
  • Figure 29: North America Market Value Share and BPS Analysis by End Use, 2025 and 2035
  • Figure 30: North America Market Y-o-Y Growth Comparison by End Use, 2025-2035
  • Figure 31: North America Market Attractiveness Analysis by End Use
  • Figure 32: Latin America Market Value Share and BPS Analysis by Country, 2025 and 2035
  • Figure 33: Latin America Market Value Share and BPS Analysis by Equipment Type , 2025 and 2035
  • Figure 34: Latin America Market Y-o-Y Growth Comparison by Equipment Type , 2025-2035
  • Figure 35: Latin America Market Attractiveness Analysis by Equipment Type
  • Figure 36: Latin America Market Value Share and BPS Analysis by Dimension, 2025 and 2035
  • Figure 37: Latin America Market Y-o-Y Growth Comparison by Dimension, 2025-2035
  • Figure 38: Latin America Market Attractiveness Analysis by Dimension
  • Figure 39: Latin America Market Value Share and BPS Analysis by End Use, 2025 and 2035
  • Figure 40: Latin America Market Y-o-Y Growth Comparison by End Use, 2025-2035
  • Figure 41: Latin America Market Attractiveness Analysis by End Use
  • Figure 42: Western Europe Market Value Share and BPS Analysis by Country, 2025 and 2035
  • Figure 43: Western Europe Market Value Share and BPS Analysis by Equipment Type , 2025 and 2035
  • Figure 44: Western Europe Market Y-o-Y Growth Comparison by Equipment Type , 2025-2035
  • Figure 45: Western Europe Market Attractiveness Analysis by Equipment Type
  • Figure 46: Western Europe Market Value Share and BPS Analysis by Dimension, 2025 and 2035
  • Figure 47: Western Europe Market Y-o-Y Growth Comparison by Dimension, 2025-2035
  • Figure 48: Western Europe Market Attractiveness Analysis by Dimension
  • Figure 49: Western Europe Market Value Share and BPS Analysis by End Use, 2025 and 2035
  • Figure 50: Western Europe Market Y-o-Y Growth Comparison by End Use, 2025-2035
  • Figure 51: Western Europe Market Attractiveness Analysis by End Use
  • Figure 52: Eastern Europe Market Value Share and BPS Analysis by Country, 2025 and 2035
  • Figure 53: Eastern Europe Market Value Share and BPS Analysis by Equipment Type , 2025 and 2035
  • Figure 54: Eastern Europe Market Y-o-Y Growth Comparison by Equipment Type , 2025-2035
  • Figure 55: Eastern Europe Market Attractiveness Analysis by Equipment Type
  • Figure 56: Eastern Europe Market Value Share and BPS Analysis by Dimension, 2025 and 2035
  • Figure 57: Eastern Europe Market Y-o-Y Growth Comparison by Dimension, 2025-2035
  • Figure 58: Eastern Europe Market Attractiveness Analysis by Dimension
  • Figure 59: Eastern Europe Market Value Share and BPS Analysis by End Use, 2025 and 2035
  • Figure 60: Eastern Europe Market Y-o-Y Growth Comparison by End Use, 2025-2035
  • Figure 61: Eastern Europe Market Attractiveness Analysis by End Use
  • Figure 62: East Asia Market Value Share and BPS Analysis by Country, 2025 and 2035
  • Figure 63: East Asia Market Value Share and BPS Analysis by Equipment Type , 2025 and 2035
  • Figure 64: East Asia Market Y-o-Y Growth Comparison by Equipment Type , 2025-2035
  • Figure 65: East Asia Market Attractiveness Analysis by Equipment Type
  • Figure 66: East Asia Market Value Share and BPS Analysis by Dimension, 2025 and 2035
  • Figure 67: East Asia Market Y-o-Y Growth Comparison by Dimension, 2025-2035
  • Figure 68: East Asia Market Attractiveness Analysis by Dimension
  • Figure 69: East Asia Market Value Share and BPS Analysis by End Use, 2025 and 2035
  • Figure 70: East Asia Market Y-o-Y Growth Comparison by End Use, 2025-2035
  • Figure 71: East Asia Market Attractiveness Analysis by End Use
  • Figure 72: South Asia and Pacific Market Value Share and BPS Analysis by Country, 2025 and 2035
  • Figure 73: South Asia and Pacific Market Value Share and BPS Analysis by Equipment Type , 2025 and 2035
  • Figure 74: South Asia and Pacific Market Y-o-Y Growth Comparison by Equipment Type , 2025-2035
  • Figure 75: South Asia and Pacific Market Attractiveness Analysis by Equipment Type
  • Figure 76: South Asia and Pacific Market Value Share and BPS Analysis by Dimension, 2025 and 2035
  • Figure 77: South Asia and Pacific Market Y-o-Y Growth Comparison by Dimension, 2025-2035
  • Figure 78: South Asia and Pacific Market Attractiveness Analysis by Dimension
  • Figure 79: South Asia and Pacific Market Value Share and BPS Analysis by End Use, 2025 and 2035
  • Figure 80: South Asia and Pacific Market Y-o-Y Growth Comparison by End Use, 2025-2035
  • Figure 81: South Asia and Pacific Market Attractiveness Analysis by End Use
  • Figure 82: Middle East & Africa Market Value Share and BPS Analysis by Country, 2025 and 2035
  • Figure 83: Middle East & Africa Market Value Share and BPS Analysis by Equipment Type , 2025 and 2035
  • Figure 84: Middle East & Africa Market Y-o-Y Growth Comparison by Equipment Type , 2025-2035
  • Figure 85: Middle East & Africa Market Attractiveness Analysis by Equipment Type
  • Figure 86: Middle East & Africa Market Value Share and BPS Analysis by Dimension, 2025 and 2035
  • Figure 87: Middle East & Africa Market Y-o-Y Growth Comparison by Dimension, 2025-2035
  • Figure 88: Middle East & Africa Market Attractiveness Analysis by Dimension
  • Figure 89: Middle East & Africa Market Value Share and BPS Analysis by End Use, 2025 and 2035
  • Figure 90: Middle East & Africa Market Y-o-Y Growth Comparison by End Use, 2025-2035
  • Figure 91: Middle East & Africa Market Attractiveness Analysis by End Use
  • Figure 92: Global Market - Tier Structure Analysis
  • Figure 93: Global Market - Company Share Analysis

Frequently Asked Questions

How big is the profilometer market in 2025?

The global profilometer market is estimated to be valued at USD 532.4 million in 2025.

What will be the size of profilometer market in 2035?

The market size for the profilometer market is projected to reach USD 867.2 million by 2035.

How much will be the profilometer market growth between 2025 and 2035?

The profilometer market is expected to grow at a 5.0% CAGR between 2025 and 2035.

What are the key product types in the profilometer market?

The key product types in profilometer market are contact profilometers and non-contact profilometers.

Which dimension segment to contribute significant share in the profilometer market in 2025?

In terms of dimension, 3D profilometers segment to command 60.0% share in the profilometer market in 2025.

Future Market Insights

Profilometer Market

Chat With MaRIA

Chat With

MaRIA

Hi There, I am MaRIA, Your Market Research Intelligence Assistant. How may I help you?