Proptech Market Forecast and Outlook 2025 to 2035

The proptech market is estimated to be valued at USD 44.6 billion in 2025 and is projected to reach USD 198.5 billion by 2035, registering a compound annual growth rate (CAGR) of 16.1% over the forecast period. The market is expected to add an absolute dollar opportunity of USD 153.9 billion during this period.

Quick Stats Proptech Market
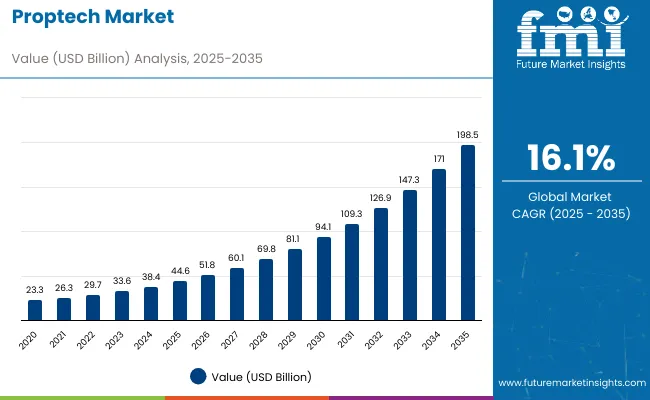
  • Proptech Market Value (2025): USD 44.6 billion
  • Proptech Market Forecast Value (2035): USD 198.5 billion
  • Proptech Market Forecast CAGR: 16.1%
  • Leading Segment in Proptech Market (2025): Residential Property (47.8% market share)
  • Key Growth Region in Proptech Market: Asia-Pacific (China, India) and North America
  • Key Players in Proptech Market: Airbnb, WeCompany (WeWork), Compass, Zillow Group, Redfin, OYO, CBRE, CoStar Group, Houzz, and Beike / Lianjia

Proptech Market

Metric Value
Estimated Size (2025E) USD 44.6 billion
Projected Value (2035F) USD 198.5 billion
CAGR (2025 to 2035) 16.1%

This reflects a 4.5 times growth at a compound annual growth rate of 16.1%. The market evolution is expected to be shaped by the rising demand for digital transformation in real estate, technological advancements in AI and IoT, growing smart building requirements, and increasing infrastructure development in emerging markets, particularly where sustainability and operational efficiency are prioritized.

By 2030, the market is likely to reach approximately USD 94.1 billion, accounting for USD 49.5 billion in incremental value over the first half of the decade. The remaining USD 104.4 billion is expected to be realized during the second half, suggesting an accelerated growth pattern. Product innovation in AI-driven property management, blockchain transactions, and smart building technologies is gaining significant traction.

Companies such as Airbnb, WeCompany (WeWork), and Compass are advancing their competitive positions through investment in platform development, strategic partnerships, and global market expansion. Rising urbanization, digitalization trends, and improved operational efficiency requirements are supporting expansion into residential management, commercial real estate, and short-term rental platforms. Market performance will remain anchored in digital adoption rates, regulatory compliance, and user experience benchmarks.

The market holds a significant share across its parent markets. Within the global real estate technology market, it accounts for approximately 65.2% due to its comprehensive digital solutions portfolio. In the property management software segment, it commands a 42.8% share, supported by increasing automation requirements and operational efficiency demands. It contributes nearly 38.7% to the smart building technology market and 28.9% to the digital transaction platforms segment. In real estate analytics and data services, proptech solutions hold around 31.4% share, driven by data-driven decision-making requirements. Across the facility management technology market, its share is close to 26.8%, owing to its position as a key enabler of intelligent building operations.

The market is being driven by rising demand for digital real estate solutions, AI-powered property management, and smart building integration. Advanced technologies using artificial intelligence, blockchain, IoT connectivity, and big data analytics have enhanced operational efficiency, transaction transparency, and predictive maintenance capabilities, making modern proptech solutions essential alternatives to traditional real estate operations. Manufacturers are introducing specialized platforms, including residential management systems and commercial property applications tailored for different property types, expanding their role beyond basic property listing to comprehensive ecosystem management. Strategic collaborations between proptech companies and traditional real estate firms have accelerated innovation in digital transformation applications and market penetration.

Why is the Proptech Market Growing?

Proptech’s innovative solutions are transforming the real estate and property management sectors by providing digital efficiency, cost optimization, and enhanced user experience. Its functional capabilities make it indispensable for property listing platforms, smart building management, virtual tours, and data-driven decision-making, where accuracy, speed, and transparency are critical. By integrating technologies like AI, IoT, and cloud-based platforms, proptech enables real-time monitoring, predictive maintenance, and seamless transactions, driving adoption across residential, commercial, and industrial real estate markets worldwide.

Rising focus on sustainability, operational cost reduction, and data-driven decision making is further propelling adoption, particularly in commercial real estate, residential property management, and short-term rental platforms. Rising property values, regulatory compliance requirements, and technological advancements in AI and blockchain are also enhancing system capabilities and market penetration.

As smart city initiatives and digital infrastructure accelerate across property management and real estate applications, the market outlook remains highly favorable. With property managers and real estate professionals prioritizing operational efficiency, customer experience, and competitive differentiation, proptech solutions are well-positioned to expand across various residential, commercial, and industrial property applications.

Proptech Market Analysis by Top Investment Segments

The market is segmented by property type, end user, solution, and region. By property type, the market includes residential property, commercial property, and industrial property. By solution, the market is segmented into PropTech Platforms and PropTech Services. By end user, the market is categorized into real estate agents/brokers, property developers/builders, property managers, commercial/industrial real estate companies, housing associations, and others. Regionally, the market spans across North America, Western Europe, Eastern Europe, South Asia and Pacific, East Asia, Latin America, and the Middle East & Africa.
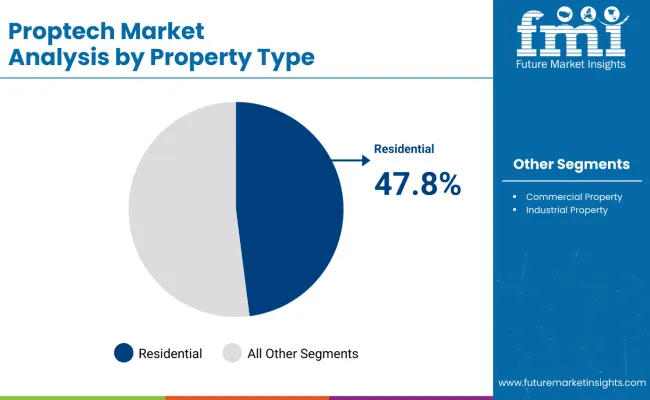
By Property Type, the Residential Property Segment Accounts for 47.8% of the Market Share

Proptech Market By Property

The residential property segment holds a dominant position with 47.8% of the market share in the property type category, owing to its vast application base and growing demand for digital property management solutions across residential real estate. Residential properties represent the largest consumer base for proptech solutions, including property search platforms, virtual tours, smart home technologies, and digital transaction processing.

They enable property managers, landlords, and residents to achieve optimal operational efficiency while maintaining excellent user experience and property value optimization in both urban and suburban markets. As demand for convenient, technology-enabled residential services grows, the residential property segment continues to maintain preference in proptech adoption.

Manufacturers are investing in advanced residential-focused platforms, improved user interfaces, and enhanced property management capabilities to maintain market leadership, broaden service offerings, and improve tenant satisfaction. The segment is positioned to remain dominant as global residential markets prioritize digital transformation and smart living solutions.
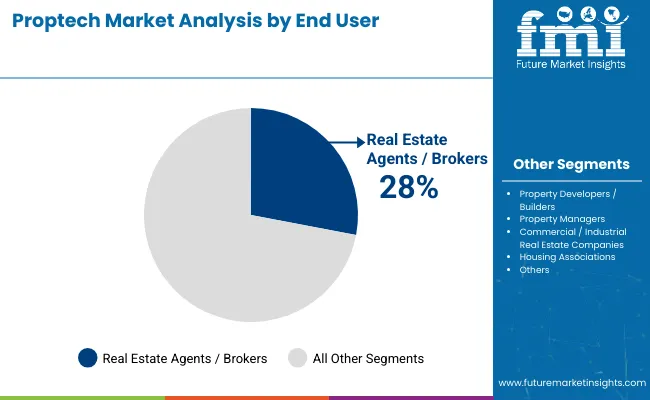
By End User, the Real Estate Agents / Brokers Segment Accounts for 28% of the Market Share

Proptech Market By End User

The real estate agents and brokers segment holds the largest position with 28% of the market share in the end-user category, owing to their critical role as intermediaries in property transactions and their early adoption of digital platforms to enhance client services and operational efficiency. Real estate professionals are widely leveraging proptech solutions across residential, commercial, and mixed-use property segments due to their need for comprehensive listing management, customer relationship tools, and transaction processing capabilities.

They enable property professionals and their clients to achieve optimal transaction efficiency while maintaining excellent customer experience and market competitiveness in both traditional and digital real estate environments. As demand for streamlined, technology-enabled real estate services grows, the agents and brokers segment continues to maintain preference in proptech platform adoption.

Technology providers are investing in advanced CRM systems, improved mobile applications, and enhanced virtual tour capabilities to maintain market leadership, broaden service offerings, and improve client satisfaction metrics. The segment is positioned to remain dominant as global real estate markets prioritize digital transformation and customer-centric solutions.

What are the Drivers, Restraints, and Key Trends of the Proptech Market?

In 2024, global proptech adoption grew by 18% year-on-year, with Asia-Pacific taking a 45% share. Applications include property management platforms, digital transaction systems, and smart building technologies. Manufacturers are introducing AI-powered solutions and blockchain integration that deliver superior efficiency profiles and transaction transparency. Digital platforms now support IoT connectivity and smart building positioning. Sustainability regulations and operational efficiency initiatives support property managers confidence. Technology providers increasingly supply ready-to-deploy platform systems with integrated analytics capabilities to reduce implementation complexity.

Digital Transformation Accelerates Proptech Market Demand

Property managers and real estate professionals are choosing proptech solutions to achieve superior operational efficiency, enhance customer experience, and meet growing demands for digital, connected property services. In field applications, proptech platforms deliver up to 40% improvement in operational efficiency compared to traditional property management methods. Platforms equipped with AI and automation maintain optimal property performance throughout varying market conditions and seasonal demand cycles. In commercial buildings, integrated proptech systems help reduce operational costs while maintaining service standards by up to 35%. Digital applications are now being deployed for residential and industrial segments, increasing adoption in sectors demanding precise property management.

Implementation Costs, Regulatory Complexity and Technology Integration Challenges Limit Growth

Market expansion is constrained by higher implementation costs, regulatory compliance requirements, and complex technology integration needs. Comprehensive proptech platform implementations can cost 50-70% more than traditional property management systems, depending on features and integration requirements, impacting adoption in cost-sensitive markets. Regulatory compliance across different jurisdictions requires extensive validation processes, adding 3-6 weeks to deployment timelines. Specialized integration and data migration requirements extend implementation costs by 30-45% compared to standalone systems. Limited availability of trained professionals for proptech platform management restricts scalable deployment, especially in emerging markets. These constraints make proptech adoption challenging in traditional markets despite growing performance advantages and competitive pressures.
Proptech Market Analysis by Top Countries

Proptech Market By Country

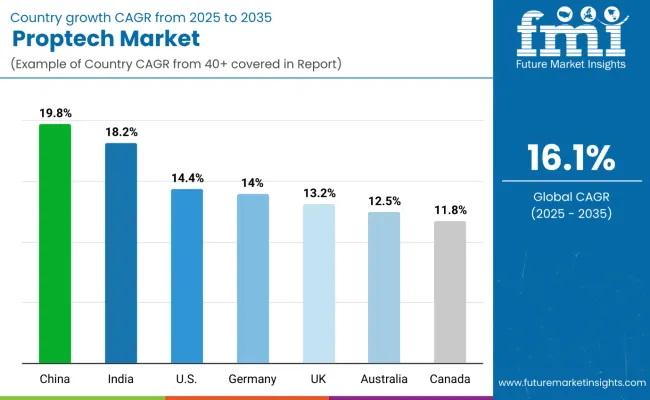
Countries CAGR (2025 to 2035)
China 19.8%
India 18.2%
USA 14.4%
Germany 14.0%
UK 13.2%
Australia 12.5%
Canada 11.8%

The proptech market shows varied growth trajectories across the top six countries. China leads with the highest projected CAGR of 19.8% from 2025 to 2035, driven by rapid urbanization, massive real estate development, and government support for digital infrastructure. India follows with a CAGR of 18.2%, supported by growing internet penetration and expanding urban property markets. The USA demonstrates solid growth at 14.4%, supported by mature technology adoption and innovation leadership. Germany shows strong growth at 14.0%, driven by sustainability regulations and smart building adoption. The UK, with a CAGR of 13.2%, experiences steady expansion supported by digital transformation initiatives. In contrast, Australia, at 12.5% and Canada, at 11.8% reflect regional differences in technology adoption and real estate market dynamics.

The report covers an in-depth analysis of 40+ countries; seven top-performing OECD countries are highlighted below.

Market Expansion in the Proptech Market in China

Revenue from proptech solutions in China is projected to grow at a CAGR of 19.8% from 2025 to 2035, driven by massive urbanization, government digital infrastructure initiatives, and increasing real estate digitalization across major cities, including Beijing, Shanghai, and Shenzhen. The China PropTech Market is expected to grow from USD 3.52 billion in 2024 to USD 25.8 billion by 2035, with residential being the largest revenue generating property type while commercial and industrial segments show fastest growth.

Key Statistics

  • Residential segment represents largest revenue generating property type with commercial and industrial showing fastest growth
  • China projected to lead Asia-Pacific regional market in terms of revenue through 2030
  • Government support for digital infrastructure development and smart city initiatives driving market expansion

Growth Outlook of the Proptech Market in India

Sales of proptech solutions in India are expected to grow at a CAGR of 18.2% from 2025 to 2035, due to urban infrastructure development and residential property digitalization in Mumbai, Delhi, and Bangalore regions. Market adoption is shifting from basic property listing solutions toward comprehensive property management platforms and smart building integration. Local technology capabilities and international platform partnerships are leading commercial deployment strategies. Rising internet penetration and growing middle-class property ownership are primary demand drivers.

Key Statistics

  • India represents fastest growing regional market in Asia Pacific according to Grand View Research
  • Rising urbanization and fintech integration driving market efficiency and accessibility improvements
  • Fractional ownership and real estate tokenization emerging as disruptive market forces

Growth Leadership in the Proptech Market in the United States

The proptech market in the USA is anticipated to expand at a CAGR of 14.4% from 2025 to 2035, reflecting mature market dynamics with a focus on innovation and efficiency upgrades. Growth is centered on platform optimization and smart building integration in California, New York, and Texas regions. Advanced AI adoption and blockchain integration are being deployed for commercial real estate, residential management, and digital transaction platforms. Technology innovation and venture capital investment support practical platform development across diverse property types.

Key Statistics

  • North America held largest market share in terms of revenue generation in 2024
  • Country expected to lead global market in terms of revenue through 2030
  • Strong focus on AI adoption blockchain integration and advanced digital transaction platforms

Growth Assessment for Proptech Market in Germany

The demand for proptech solutions in Germany is expected to grow at a CAGR of 14.0% from 2025 to 2035,driven by strong regulatory support, rising investment in green buildings, and rapid adoption of AI-enabled property management platforms. Advanced digital infrastructure, robust sustainability regulations, and comprehensive building efficiency standards in Berlin, Munich, and Hamburg markets drive demand. Evidence-based building codes and specialized property management systems are increasingly adopting smart building technologies for optimal operational performance.

Key Statistics

  • Germany accounted for 6.7% of global proptech market revenue in 2022
  • Residential segment largest revenue generator with commercial and industrial showing fastest growth
  • Strong emphasis on sustainability regulations and building efficiency standards driving adoption

Dynamics of Proptech Market in the United Kingdom

Sales for proptech in the UK is expected to grow at a CAGR of 13.2% from 2025 to 2035, driven by digital transformation initiatives and regulatory modernization in the London, Manchester, and Edinburgh regions. Integrated proptech systems and data analytics are expanding technology adoption, while property managers incorporate efficiency-focused protocols into comprehensive facility management programs. Brexit-related market adjustments and emphasis on operational efficiency are influencing market dynamics. Increasing venture capital inflows and demand for AI-driven real estate platforms further accelerate adoption.

Key Statistics

  • Residential segment represents largest revenue generator with commercial and industrial fastest growing
  • Strong regulatory framework and Brexit-related market adjustments influencing adoption patterns

Australia Proptech Market Development Prospects

The demand for proptech solutions in Australia is projected to expand at a CAGR of 12.5% from 2025 to 2035, driven by urbanization and growing demand for digital property services. Growth is concentrated in urban markets, including Sydney, Melbourne, and Brisbane, where residential and commercial property management requirements are expanding. Smart building technologies and digital transaction platforms are gradually building comprehensive property management capabilities. Increasing government initiatives promoting sustainable infrastructure and energy-efficient buildings further support market expansion.

Key Statistics

  • Strong focus on PropTech trends including virtual reality property tours and AI-powered market analysis
  • Technology transforming property buying selling and management through digital innovations
  • Growing emphasis on sustainability and green building certifications shaping market development
  • Metropolitan concentration of growth in Sydney Melbourne and Brisbane markets

Canada Proptech Market Growth Analysis

The proptech market in Canada is projected to expand at a CAGR of 11.8% from 2025 to 2035, supported by steady demand for digital property management and smart building technologies. Growth is driven by urbanization and technology adoption in the Toronto, Vancouver, and Montreal regions. Canadian proptech adoption focuses on energy efficiency, regulatory compliance, and integrated property management solutions that meet quality expectations for comprehensive building operations. Rising venture capital investments and partnerships with global technology providers are further accelerating market expansion. Increasing emphasis on sustainability and green building certifications is shaping adoption patterns.

Key Statistics
  • Fastest growing regional market in North America with projected growth through 2030
  • Government initiatives promoting sustainable infrastructure and green building certifications
  • Technology hubs in Toronto and Vancouver contributing to market development and innovation

Competitive Landscape of the Proptech Market

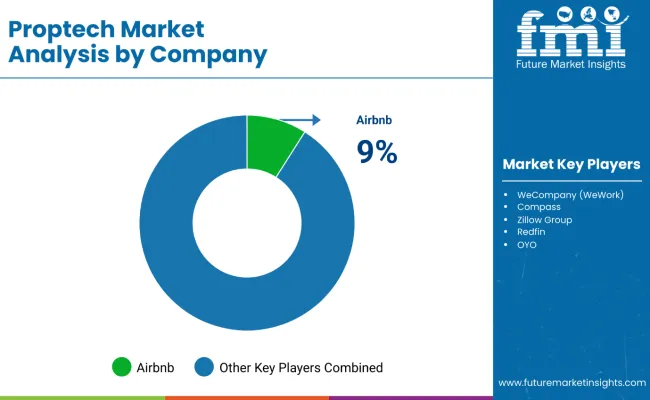
Proptech Market By Company

The market is moderately concentrated, featuring a mix of global technology platforms, specialized real estate technology companies, and traditional real estate firms with varying degrees of digital expertise, platform capabilities, and market reach proficiency. Airbnb leads the market with an estimated 9.0% share, primarily driven by its dominance in short-term rental platforms and global marketplace presence.

WeCompany (WeWork), Compass, and Zillow Group maintain significant market presence through their specialization in coworking spaces, real estate brokerage technology, and comprehensive property platforms, respectively. Redfin, OYO, and CBRE differentiate through innovative brokerage models, hospitality technology, and commercial real estate digital services that cater to various residential, commercial, and hospitality applications.

Regional specialists and emerging platforms focus on specific market segments, niche applications, and local market development, addressing growing demand from property managers, real estate professionals, and technology-forward property owners.

Entry barriers remain moderate, driven by challenges in technology development, regulatory compliance, and network effects across multiple property categories. Competitiveness increasingly depends on platform innovation, user experience, and market penetration capabilities for diverse real estate environments.

Scope of Report

Items Value
Quantitative Units USD 44.6 Billion
Property Type Residential Property, Commercial Property, and Industrial Property
End User Real Estate Agents/Brokers, Property Developers/Builders, Property Managers, Commercial/Industrial Real Estate Companies, Housing Associations, and Others
Solutions PropTech Platforms and PropTech Services
Regions Covered North America, Latin America, Western Europe, Eastern Europe, South Asia and Pacific, East Asia, and Middle East & Africa
Countries Covered United States, Canada, United Kingdom, Germany, France, China, Japan, South Korea, Brazil, Australia, India and 40+ Countries
Key Companies Profiled Airbnb, WeCompany (WeWork), Compass, Zillow Group, Redfin, OYO, CBRE, CoStar Group, Houzz, and Beike / Lianjia
Additional Attributes Dollar sales by application and user type, regional adoption trends, competitive landscape, consumer preferences for integrated versus specialized solutions, integration with sustainable building practices, innovations in AI and blockchain technology, and quality standardization for diverse property applications

Key Segments

By Solution:

  • PropTech Platforms
  • PropTech Services

By Property Type:

  • Residential Property
  • Commercial Property
  • Industrial Property

By End User:

  • Real Estate Agents/Brokers
  • Property Developers/Builders
  • Property Managers
  • Commercial/Industrial Real Estate Companies
  • Housing Associations
  • Others

By Region:

  • North America
  • Latin America
  • Western Europe
  • Eastern Europe
  • East Asia
  • South Asia & Pacific
  • Middle East and Africa

Table of Content

  1. Executive Summary
    • Global Market Outlook
    • Demand-side Trends
    • Supply-side Trends
    • Technology Roadmap Analysis
    • Analysis and Recommendations
  2. Market Overview
    • Market Coverage / Taxonomy
    • Market Definition / Scope / Limitations
  3. Market Background
    • Market Dynamics
      • Drivers
      • Restraints
      • Opportunity
      • Trends
    • Scenario Forecast
      • Demand in Optimistic Scenario
      • Demand in Likely Scenario
      • Demand in Conservative Scenario
    • Opportunity Map Analysis
    • Product Life Cycle Analysis
    • Supply Chain Analysis
      • Supply Side Participants and their Roles
        • Producers
        • Mid-Level Participants (Traders/ Agents/ Brokers)
        • Wholesalers and Distributors
      • Value Added and Value Created at Node in the Supply Chain
      • List of Raw Material Suppliers
      • List of Existing and Potential Buyer’s
    • Investment Feasibility Matrix
    • Value Chain Analysis
      • Profit Margin Analysis
      • Wholesalers and Distributors
      • Retailers
    • PESTLE and Porter’s Analysis
    • Regulatory Landscape
      • By Key Regions
      • By Key Countries
    • Regional Parent Market Outlook
    • Production and Consumption Statistics
    • Import and Export Statistics
  4. Global Market Analysis 2020 to 2024 and Forecast, 2025 to 2035
    • Historical Market Size Value (USD Billion) Analysis, 2020 to 2024
    • Current and Future Market Size Value (USD Billion) Projections, 2025 to 2035
      • Y-o-Y Growth Trend Analysis
      • Absolute $ Opportunity Analysis
  5. Global Market Pricing Analysis 2020 to 2024 and Forecast 2025 to 2035
  6. Global Market Analysis 2020 to 2024 and Forecast 2025 to 2035, By Solution
    • Introduction / Key Findings
    • Historical Market Size Value (USD Billion) Analysis By Solution , 2020 to 2024
    • Current and Future Market Size Value (USD Billion) Analysis and Forecast By Solution , 2025 to 2035
      • PropTech Platforms
      • PropTech Services
    • Y-o-Y Growth Trend Analysis By Solution , 2020 to 2024
    • Absolute $ Opportunity Analysis By Solution , 2025 to 2035
  7. Global Market Analysis 2020 to 2024 and Forecast 2025 to 2035, By Property Type
    • Introduction / Key Findings
    • Historical Market Size Value (USD Billion) Analysis By Property Type, 2020 to 2024
    • Current and Future Market Size Value (USD Billion) Analysis and Forecast By Property Type, 2025 to 2035
      • Residential Property
      • Commercial Property
      • Industrial Property
    • Y-o-Y Growth Trend Analysis By Property Type, 2020 to 2024
    • Absolute $ Opportunity Analysis By Property Type, 2025 to 2035
  8. Global Market Analysis 2020 to 2024 and Forecast 2025 to 2035, By End User
    • Introduction / Key Findings
    • Historical Market Size Value (USD Billion) Analysis By End User, 2020 to 2024
    • Current and Future Market Size Value (USD Billion) Analysis and Forecast By End User, 2025 to 2035
      • Real Estate Agents/Brokers
      • Property Developers/Builders
      • Property Managers
      • Commercial/Industrial Real Estate Companies
      • Housing Associations
      • Others
    • Y-o-Y Growth Trend Analysis By End User, 2020 to 2024
    • Absolute $ Opportunity Analysis By End User, 2025 to 2035
  9. Global Market Analysis 2020 to 2024 and Forecast 2025 to 2035, By Region
    • Introduction
    • Historical Market Size Value (USD Billion) Analysis By Region, 2020 to 2024
    • Current Market Size Value (USD Billion) Analysis and Forecast By Region, 2025 to 2035
      • North America
      • Latin America
      • Western Europe
      • Eastern Europe
      • East Asia
      • South Asia & Pacific
      • Middle East and Africa
    • Market Attractiveness Analysis By Region
  10. North America Market Analysis 2020 to 2024 and Forecast 2025 to 2035, By Country
    • Historical Market Size Value (USD Billion) Trend Analysis By Market Taxonomy, 2020 to 2024
    • Market Size Value (USD Billion) Forecast By Market Taxonomy, 2025 to 2035
      • By Country
        • USA
        • Canada
        • Mexico
      • By Solution
      • By Property Type
      • By End User
    • Market Attractiveness Analysis
      • By Country
      • By Solution
      • By Property Type
      • By End User
    • Key Takeaways
  11. Latin America Market Analysis 2020 to 2024 and Forecast 2025 to 2035, By Country
    • Historical Market Size Value (USD Billion) Trend Analysis By Market Taxonomy, 2020 to 2024
    • Market Size Value (USD Billion) Forecast By Market Taxonomy, 2025 to 2035
      • By Country
        • Brazil
        • Argentina
        • Rest of LATAM
      • By Solution
      • By Property Type
      • By End User
    • Market Attractiveness Analysis
      • By Country
      • By Solution
      • By Property Type
      • By End User
    • Key Takeaways
  12. Western Europe Market Analysis 2020 to 2024 and Forecast 2025 to 2035, By Country
    • Historical Market Size Value (USD Billion) Trend Analysis By Market Taxonomy, 2020 to 2024
    • Market Size Value (USD Billion) Forecast By Market Taxonomy, 2025 to 2035
      • By Country
        • Germany
        • Italy
        • France
        • UK
        • Spain
        • BENELUX
        • Nordic
        • Rest of W.Europe
      • By Solution
      • By Property Type
      • By End User
    • Market Attractiveness Analysis
      • By Country
      • By Solution
      • By Property Type
      • By End User
    • Key Takeaways
  13. Eastern Europe Market Analysis 2020 to 2024 and Forecast 2025 to 2035, By Country
    • Historical Market Size Value (USD Billion) Trend Analysis By Market Taxonomy, 2020 to 2024
    • Market Size Value (USD Billion) Forecast By Market Taxonomy, 2025 to 2035
      • By Country
        • Russia
        • Hungary
        • Poland
        • Balkan & Baltics
        • Rest of E. Europe
      • By Solution
      • By Property Type
      • By End User
    • Market Attractiveness Analysis
      • By Country
      • By Solution
      • By Property Type
      • By End User
    • Key Takeaways
  14. East Asia Market Analysis 2020 to 2024 and Forecast 2025 to 2035, By Country
    • Historical Market Size Value (USD Billion) Trend Analysis By Market Taxonomy, 2020 to 2024
    • Market Size Value (USD Billion) Forecast By Market Taxonomy, 2025 to 2035
      • By Country
        • China
        • Japan
        • South Korea
      • By Solution
      • By Property Type
      • By End User
    • Market Attractiveness Analysis
      • By Country
      • By Solution
      • By Property Type
      • By End User
    • Key Takeaways
  15. South Asia & Pacific Market Analysis 2020 to 2024 and Forecast 2025 to 2035, By Country
    • Historical Market Size Value (USD Billion) Trend Analysis By Market Taxonomy, 2020 to 2024
    • Market Size Value (USD Billion) Forecast By Market Taxonomy, 2025 to 2035
      • By Country
        • India
        • Australia & New Zealand
        • ASEAN
        • Rest of SAP
      • By Solution
      • By Property Type
      • By End User
    • Market Attractiveness Analysis
      • By Country
      • By Solution
      • By Property Type
      • By End User
    • Key Takeaways
  16. Middle East and Africa Market Analysis 2020 to 2024 and Forecast 2025 to 2035, By Country
    • Historical Market Size Value (USD Billion) Trend Analysis By Market Taxonomy, 2020 to 2024
    • Market Size Value (USD Billion) Forecast By Market Taxonomy, 2025 to 2035
      • By Country
        • GCC Countries
        • Northern Africa
        • South Africa
        • Turkiye
        • Rest of MEA
      • By Solution
      • By Property Type
      • By End User
    • Market Attractiveness Analysis
      • By Country
      • By Solution
      • By Property Type
      • By End User
    • Key Takeaways
  17. Key Countries Market Analysis
    • USA
      • Pricing Analysis
      • Market Share Analysis, 2024
        • By Solution
        • By Property Type
        • By End User
    • Canada
      • Pricing Analysis
      • Market Share Analysis, 2024
        • By Solution
        • By Property Type
        • By End User
    • Brazil
      • Pricing Analysis
      • Market Share Analysis, 2024
        • By Solution
        • By Property Type
        • By End User
    • Mexico
      • Pricing Analysis
      • Market Share Analysis, 2024
        • By Solution
        • By Property Type
        • By End User
    • Argentina
      • Pricing Analysis
      • Market Share Analysis, 2024
        • By Solution
        • By Property Type
        • By End User
  18. Market Structure Analysis
    • Competition Dashboard
    • Competition Benchmarking
    • Market Share Analysis of Top Players
      • By Regional
      • By Solution
      • By Property Type
      • By End User
  19. Competition Analysis
    • Competition Deep Dive
      • WeCompany (WeWork)
        • Overview
        • Product Portfolio
        • Profitability by Market Segments (Product/Age /Sales Channel/Region)
        • Sales Footprint
        • Strategy Overview
          • Marketing Strategy
          • Product Strategy
          • Channel Strategy
      • Compass
        • Overview
        • Product Portfolio
        • Profitability by Market Segments (Product/Age /Sales Channel/Region)
        • Sales Footprint
        • Strategy Overview
          • Marketing Strategy
          • Product Strategy
          • Channel Strategy
      • Zillow Group
        • Overview
        • Product Portfolio
        • Profitability by Market Segments (Product/Age /Sales Channel/Region)
        • Sales Footprint
        • Strategy Overview
          • Marketing Strategy
          • Product Strategy
          • Channel Strategy
      • Redfin
        • Overview
        • Product Portfolio
        • Profitability by Market Segments (Product/Age /Sales Channel/Region)
        • Sales Footprint
        • Strategy Overview
          • Marketing Strategy
          • Product Strategy
          • Channel Strategy
      • OYO
        • Overview
        • Product Portfolio
        • Profitability by Market Segments (Product/Age /Sales Channel/Region)
        • Sales Footprint
        • Strategy Overview
          • Marketing Strategy
          • Product Strategy
          • Channel Strategy
      • CBRE (proptech & innovation programs)
        • Overview
        • Product Portfolio
        • Profitability by Market Segments (Product/Age /Sales Channel/Region)
        • Sales Footprint
        • Strategy Overview
          • Marketing Strategy
          • Product Strategy
          • Channel Strategy
      • CoStar Group
        • Overview
        • Product Portfolio
        • Profitability by Market Segments (Product/Age /Sales Channel/Region)
        • Sales Footprint
        • Strategy Overview
          • Marketing Strategy
          • Product Strategy
          • Channel Strategy
      • Houzz
        • Overview
        • Product Portfolio
        • Profitability by Market Segments (Product/Age /Sales Channel/Region)
        • Sales Footprint
        • Strategy Overview
          • Marketing Strategy
          • Product Strategy
          • Channel Strategy
      • Beike / Lianjia
        • Overview
        • Product Portfolio
        • Profitability by Market Segments (Product/Age /Sales Channel/Region)
        • Sales Footprint
        • Strategy Overview
          • Marketing Strategy
          • Product Strategy
          • Channel Strategy
      • Airbnb
      • Overview
      • Product Portfolio
      • Profitability by Market Segments (Product/Age /Sales Channel/Region)
      • Sales Footprint
      • Strategy Overview
      • Marketing Strategy
      • Product Strategy
      • Channel Strategy
  20. Assumptions & Acronyms Used
  21. Research Methodology

List of Tables

  • Table 1: Global Market Value (USD Billion) Forecast by Region, 2020-2035
  • Table 2: Global Market Value (USD Billion) Forecast by Solution , 2020-2035
  • Table 3: Global Market Value (USD Billion) Forecast by Property Type, 2020-2035
  • Table 4: Global Market Value (USD Billion) Forecast by End User, 2020-2035
  • Table 5: North America Market Value (USD Billion) Forecast by Country, 2020-2035
  • Table 6: North America Market Value (USD Billion) Forecast by Solution , 2020-2035
  • Table 7: North America Market Value (USD Billion) Forecast by Property Type, 2020-2035
  • Table 8: North America Market Value (USD Billion) Forecast by End User, 2020-2035
  • Table 9: Latin America Market Value (USD Billion) Forecast by Country, 2020-2035
  • Table 10: Latin America Market Value (USD Billion) Forecast by Solution , 2020-2035
  • Table 11: Latin America Market Value (USD Billion) Forecast by Property Type, 2020-2035
  • Table 12: Latin America Market Value (USD Billion) Forecast by End User, 2020-2035
  • Table 13: Western Europe Market Value (USD Billion) Forecast by Country, 2020-2035
  • Table 14: Western Europe Market Value (USD Billion) Forecast by Solution , 2020-2035
  • Table 15: Western Europe Market Value (USD Billion) Forecast by Property Type, 2020-2035
  • Table 16: Western Europe Market Value (USD Billion) Forecast by End User, 2020-2035
  • Table 17: Eastern Europe Market Value (USD Billion) Forecast by Country, 2020-2035
  • Table 18: Eastern Europe Market Value (USD Billion) Forecast by Solution , 2020-2035
  • Table 19: Eastern Europe Market Value (USD Billion) Forecast by Property Type, 2020-2035
  • Table 20: Eastern Europe Market Value (USD Billion) Forecast by End User, 2020-2035
  • Table 21: East Asia Market Value (USD Billion) Forecast by Country, 2020-2035
  • Table 22: East Asia Market Value (USD Billion) Forecast by Solution , 2020-2035
  • Table 23: East Asia Market Value (USD Billion) Forecast by Property Type, 2020-2035
  • Table 24: East Asia Market Value (USD Billion) Forecast by End User, 2020-2035
  • Table 25: South Asia & Pacific Market Value (USD Billion) Forecast by Country, 2020-2035
  • Table 26: South Asia & Pacific Market Value (USD Billion) Forecast by Solution , 2020-2035
  • Table 27: South Asia & Pacific Market Value (USD Billion) Forecast by Property Type, 2020-2035
  • Table 28: South Asia & Pacific Market Value (USD Billion) Forecast by End User, 2020-2035
  • Table 29: Middle East and Africa Market Value (USD Billion) Forecast by Country, 2020-2035
  • Table 30: Middle East and Africa Market Value (USD Billion) Forecast by Solution , 2020-2035
  • Table 31: Middle East and Africa Market Value (USD Billion) Forecast by Property Type, 2020-2035
  • Table 32: Middle East and Africa Market Value (USD Billion) Forecast by End User, 2020-2035

List of Figures

  • Figure 1: Global Market Pricing Analysis
  • Figure 2: Global Market Value (USD Billion) Forecast 2020-2035
  • Figure 3: Global Market Value Share and BPS Analysis by Solution , 2025 and 2035
  • Figure 4: Global Market Y-o-Y Growth Comparison by Solution , 2025-2035
  • Figure 5: Global Market Attractiveness Analysis by Solution
  • Figure 6: Global Market Value Share and BPS Analysis by Property Type, 2025 and 2035
  • Figure 7: Global Market Y-o-Y Growth Comparison by Property Type, 2025-2035
  • Figure 8: Global Market Attractiveness Analysis by Property Type
  • Figure 9: Global Market Value Share and BPS Analysis by End User, 2025 and 2035
  • Figure 10: Global Market Y-o-Y Growth Comparison by End User, 2025-2035
  • Figure 11: Global Market Attractiveness Analysis by End User
  • Figure 12: Global Market Value (USD Billion) Share and BPS Analysis by Region, 2025 and 2035
  • Figure 13: Global Market Y-o-Y Growth Comparison by Region, 2025-2035
  • Figure 14: Global Market Attractiveness Analysis by Region
  • Figure 15: North America Market Incremental $ Opportunity, 2025-2035
  • Figure 16: Latin America Market Incremental $ Opportunity, 2025-2035
  • Figure 17: Western Europe Market Incremental $ Opportunity, 2025-2035
  • Figure 18: Eastern Europe Market Incremental $ Opportunity, 2025-2035
  • Figure 19: East Asia Market Incremental $ Opportunity, 2025-2035
  • Figure 20: South Asia & Pacific Market Incremental $ Opportunity, 2025-2035
  • Figure 21: Middle East and Africa Market Incremental $ Opportunity, 2025-2035
  • Figure 22: North America Market Value Share and BPS Analysis by Country, 2025 and 2035
  • Figure 23: North America Market Value Share and BPS Analysis by Solution , 2025 and 2035
  • Figure 24: North America Market Y-o-Y Growth Comparison by Solution , 2025-2035
  • Figure 25: North America Market Attractiveness Analysis by Solution
  • Figure 26: North America Market Value Share and BPS Analysis by Property Type, 2025 and 2035
  • Figure 27: North America Market Y-o-Y Growth Comparison by Property Type, 2025-2035
  • Figure 28: North America Market Attractiveness Analysis by Property Type
  • Figure 29: North America Market Value Share and BPS Analysis by End User, 2025 and 2035
  • Figure 30: North America Market Y-o-Y Growth Comparison by End User, 2025-2035
  • Figure 31: North America Market Attractiveness Analysis by End User
  • Figure 32: Latin America Market Value Share and BPS Analysis by Country, 2025 and 2035
  • Figure 33: Latin America Market Value Share and BPS Analysis by Solution , 2025 and 2035
  • Figure 34: Latin America Market Y-o-Y Growth Comparison by Solution , 2025-2035
  • Figure 35: Latin America Market Attractiveness Analysis by Solution
  • Figure 36: Latin America Market Value Share and BPS Analysis by Property Type, 2025 and 2035
  • Figure 37: Latin America Market Y-o-Y Growth Comparison by Property Type, 2025-2035
  • Figure 38: Latin America Market Attractiveness Analysis by Property Type
  • Figure 39: Latin America Market Value Share and BPS Analysis by End User, 2025 and 2035
  • Figure 40: Latin America Market Y-o-Y Growth Comparison by End User, 2025-2035
  • Figure 41: Latin America Market Attractiveness Analysis by End User
  • Figure 42: Western Europe Market Value Share and BPS Analysis by Country, 2025 and 2035
  • Figure 43: Western Europe Market Value Share and BPS Analysis by Solution , 2025 and 2035
  • Figure 44: Western Europe Market Y-o-Y Growth Comparison by Solution , 2025-2035
  • Figure 45: Western Europe Market Attractiveness Analysis by Solution
  • Figure 46: Western Europe Market Value Share and BPS Analysis by Property Type, 2025 and 2035
  • Figure 47: Western Europe Market Y-o-Y Growth Comparison by Property Type, 2025-2035
  • Figure 48: Western Europe Market Attractiveness Analysis by Property Type
  • Figure 49: Western Europe Market Value Share and BPS Analysis by End User, 2025 and 2035
  • Figure 50: Western Europe Market Y-o-Y Growth Comparison by End User, 2025-2035
  • Figure 51: Western Europe Market Attractiveness Analysis by End User
  • Figure 52: Eastern Europe Market Value Share and BPS Analysis by Country, 2025 and 2035
  • Figure 53: Eastern Europe Market Value Share and BPS Analysis by Solution , 2025 and 2035
  • Figure 54: Eastern Europe Market Y-o-Y Growth Comparison by Solution , 2025-2035
  • Figure 55: Eastern Europe Market Attractiveness Analysis by Solution
  • Figure 56: Eastern Europe Market Value Share and BPS Analysis by Property Type, 2025 and 2035
  • Figure 57: Eastern Europe Market Y-o-Y Growth Comparison by Property Type, 2025-2035
  • Figure 58: Eastern Europe Market Attractiveness Analysis by Property Type
  • Figure 59: Eastern Europe Market Value Share and BPS Analysis by End User, 2025 and 2035
  • Figure 60: Eastern Europe Market Y-o-Y Growth Comparison by End User, 2025-2035
  • Figure 61: Eastern Europe Market Attractiveness Analysis by End User
  • Figure 62: East Asia Market Value Share and BPS Analysis by Country, 2025 and 2035
  • Figure 63: East Asia Market Value Share and BPS Analysis by Solution , 2025 and 2035
  • Figure 64: East Asia Market Y-o-Y Growth Comparison by Solution , 2025-2035
  • Figure 65: East Asia Market Attractiveness Analysis by Solution
  • Figure 66: East Asia Market Value Share and BPS Analysis by Property Type, 2025 and 2035
  • Figure 67: East Asia Market Y-o-Y Growth Comparison by Property Type, 2025-2035
  • Figure 68: East Asia Market Attractiveness Analysis by Property Type
  • Figure 69: East Asia Market Value Share and BPS Analysis by End User, 2025 and 2035
  • Figure 70: East Asia Market Y-o-Y Growth Comparison by End User, 2025-2035
  • Figure 71: East Asia Market Attractiveness Analysis by End User
  • Figure 72: South Asia & Pacific Market Value Share and BPS Analysis by Country, 2025 and 2035
  • Figure 73: South Asia & Pacific Market Value Share and BPS Analysis by Solution , 2025 and 2035
  • Figure 74: South Asia & Pacific Market Y-o-Y Growth Comparison by Solution , 2025-2035
  • Figure 75: South Asia & Pacific Market Attractiveness Analysis by Solution
  • Figure 76: South Asia & Pacific Market Value Share and BPS Analysis by Property Type, 2025 and 2035
  • Figure 77: South Asia & Pacific Market Y-o-Y Growth Comparison by Property Type, 2025-2035
  • Figure 78: South Asia & Pacific Market Attractiveness Analysis by Property Type
  • Figure 79: South Asia & Pacific Market Value Share and BPS Analysis by End User, 2025 and 2035
  • Figure 80: South Asia & Pacific Market Y-o-Y Growth Comparison by End User, 2025-2035
  • Figure 81: South Asia & Pacific Market Attractiveness Analysis by End User
  • Figure 82: Middle East and Africa Market Value Share and BPS Analysis by Country, 2025 and 2035
  • Figure 83: Middle East and Africa Market Value Share and BPS Analysis by Solution , 2025 and 2035
  • Figure 84: Middle East and Africa Market Y-o-Y Growth Comparison by Solution , 2025-2035
  • Figure 85: Middle East and Africa Market Attractiveness Analysis by Solution
  • Figure 86: Middle East and Africa Market Value Share and BPS Analysis by Property Type, 2025 and 2035
  • Figure 87: Middle East and Africa Market Y-o-Y Growth Comparison by Property Type, 2025-2035
  • Figure 88: Middle East and Africa Market Attractiveness Analysis by Property Type
  • Figure 89: Middle East and Africa Market Value Share and BPS Analysis by End User, 2025 and 2035
  • Figure 90: Middle East and Africa Market Y-o-Y Growth Comparison by End User, 2025-2035
  • Figure 91: Middle East and Africa Market Attractiveness Analysis by End User
  • Figure 92: Global Market - Tier Structure Analysis
  • Figure 93: Global Market - Company Share Analysis

Frequently Asked Questions

How big is the proptech market in 2025?

The global proptech market is estimated to be valued at USD 44.6 billion in 2025.

What will be the size of the proptech market in 2035?

The proptech market size is projected to reach USD 198.5 billion by 2035.

How much will be the proptech market growth between 2025 and 2035?

The proptech market is expected to grow at a CAGR of 16.1% between 2025 and 2035.

Which property type is projected to lead in the proptech market in 2025?

The residential property segment is projected to lead in the proptech market with 47.8% market share in 2025.

Which end-user segment will contribute significant share in the proptech market in 2025?

In terms of end-user, the real estate agents and brokers segment is expected to command 28% share in the proptech market in 2025.

Explore Similar Insights

Future Market Insights

Proptech Market

Chat With MaRIA

Chat With

MaRIA

Hi There, I am MaRIA, Your Market Research Intelligence Assistant. How may I help you?