The world market for quantum cascade lasers (QCL) is set to grow more over ten years, helped by the rise in their use in sensing gas, checking the air, controlling processes, medical tests, and military systems. The global market for quantum cascade lasers should jump from USD 441.9 million in 2025 to USD 673.3 million by 2035, rising at a yearly rate of 4.3%. Unlike regular lasers, QCLs work in the mid to far-infrared range and can emit special wavelengths, making them good for detailed testing that needs high precision.
As businesses stress safety, keeping the environment clean, and work efficiency, QCLs are more and more found in advanced sensing tools and scientific devices. Also, in defense and flying industries, QCLs get used for infrared measures and lighting targets due to their small size and adjustable performance. The push toward tiny, solidly performing tech is boosting market demand further.
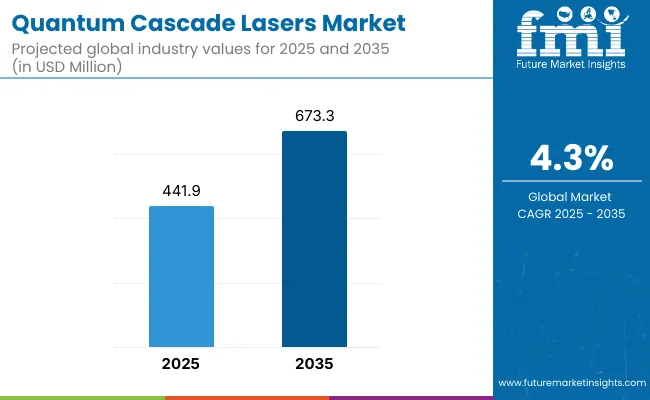
Market Metrics
| Metric | Value |
|---|---|
| Market Size (2025E) | USD 441.9 Million |
| Market Value (2035F) | USD 673.3 Million |
| CAGR (2025 to 2035) | 4.3% |
North America is at the top of the QCL market. This is because lots of money goes into defense tech, industry automation, and monitoring the environment. The USA government’s efforts in homeland safety and updating the military are driving the need for QCL infrared tools. Also, research in light science and studying substances is pushing new ideas and use in health and industry fields. Key QCL companies and new photonics businesses in the area add to this strength.
Europe sees growing need for QCLs, for areas like environmental sensing, monitoring of industrial emissions, and medical tests. Strict EU rules on air cleanliness and greenhouse gases force companies to use precise gas check systems, often using QCLs. Nations such as Germany, France, and the UK are putting money into advanced infrared sensing tech for car safety, process automation, and drug research.
By End User, Asia-Pacific is anticipated to be the highest-growth region, with increasing applications in industrial process control, laser-based communication systems, and medical devices. Indeed countries such as China, Japan and South Korea are investing substantial domestic resources into both optical and quantum technology under national innovation strategies. Increased regional manufacturing and more pressing environmental monitoring needs will work to accelerate QCL-enabled sensing widespread acceptance. This has also led to cost-fed product development through collaborations with academia and industry in the region.
High Cost and Complex Manufacturing
These are relatively expensive to produce because of complicated fabrication processes and special material requirements. This limits their usability for low-cost, high-volume applications. Their integration into end-use systems often requires precise thermal and electronic controls, which can raise the overall system complexity and limit mass adoption on price-sensitive markets.
Rising Demand for High-Precision Sensing Technologies
The demand for high-precision, non-contact sensing is skyrocketing as global industries are transitioning to digitization, automation, and sustainability. This trend opens a huge market opportunity for QCLs in environmental monitoring, leak detection, and medical diagnostics. Miniaturization and cost reductions, along with wavelength customization, are driving a wider rollout into new verticals. This creates new opportunities for the market, especially for QCLs in satellite-based sensors and autonomous vehicle navigation systems.
The quantum cascade lasers Industry will notice significant advancement in the following years 2025 to 2035, as a result of the development of mid-infrared spectrometry, environmental conditions, medical analysis, armed forces process monitor, and result handling. The QCLs are critical for applications which demand highly efficient and wavelength-specific laser output especially in gas analysis, chemical detection and imaging.
Whether it's well-understood microphones and speakers operating near the audible range, or the latest high-frequency ultrasound devices, optimizing low-dimension near-field illumination gives our customers a revolutionary new tool for industries such as homeland security, healthcare, and manufacturing.
Future developments will include portable and miniaturized QCL modules, integration into photonic sensors and the emergence of tunable QCL for multi-target detection. Its growing applicability in non-invasive medical diagnostics such as breath analysis to detect and progress disease at an early stage will unlock new health frontiers.
The growing defense and aerospace spending (especially in the USA, Europe, and China) is another factor that's likely to facilitate market growth as QCLs play a crucial role in infrared countermeasures and chemical threat detection. In addition, joint R&D between academic institutions and manufacturers is anticipated to speed the commercialization of advanced QCL applications.
Market Shifts: 2020 to 2024 vs. 2025 to 2035
| Key Dimensions | 2020 to 2024 |
|---|---|
| Technology Focus | Distributed feedback (DFB), external cavity QCLs |
| Application Focus | Gas sensing, industrial process monitoring |
| Design Characteristics | Laboratory-scale setups |
| Commercialization Level | Niche scientific and industrial use |
| Adoption Geography | North America, Europe |
| Regulatory Landscape | Lab safety compliance |
| R&D Investment Focus | Spectroscopy techniques |
| Key Dimensions | 2025 to 2035 |
|---|---|
| Technology Focus | Tunable, high-power, miniaturized and integrated QCLs |
| Application Focus | Medical diagnostics, defense countermeasures, autonomous system integration |
| Design Characteristics | Portable, chip-scale, ruggedized devices |
| Commercialization Level | Widespread adoption in healthcare, environment, and homeland security |
| Adoption Geography | Asia-Pacific, Middle East, Eastern Europe |
| Regulatory Landscape | Medical device certifications, defense-grade standards |
| R&D Investment Focus | Photonic integration, AI-driven signal analysis, tunable IR spectrum solutions |
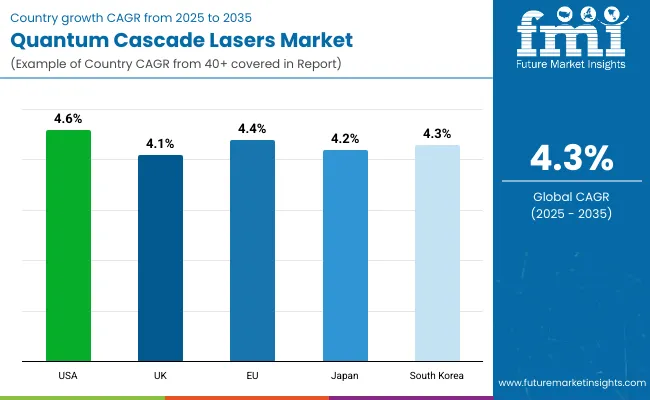
The United States quantum cascade lasers market is primarily driven by its high applications in defense and homeland security areas, where it is used for chemical detection and infrared countermeasures. Innovation is being prodded by investments by DARPA and DoD, alongside strong research done at their national laboratories.
The key factors driving the growth of the market include defense modernization programs, and increasing use in environmental monitoring, security and surveillance, and an increase in commercialization in medical diagnostics.
| Country | CAGR (2025 to 2035) |
|---|---|
| USA | 4.6% |
In the UK, there is growing demand for QCLs for a variety of applications, particularly environmental sensing, industrial gas analysis and medical imaging. UKRI is helping to fund the development of smaller, more powerful QCL systems through academic collaborations.
Some of the trends include photonic chip integration, portable spectroscopy systems, and increased demand for trace gas analysis solutions.
| Country | CAGR (2025 to 2035) |
|---|---|
| UK | 4.1% |
Projects benefiting from the Horizon Europe program further drive the growth of the QCL market in the European Union. Germany and France are leaders not only in spectroscopy but also in defense and optical communication area of research and development.
Market trends include miniaturized QCL modules, growing applications in industrial safety applications, and fewer emission control technologies in line with EU green policies.
| Region | CAGR (2025 to 2035) |
|---|---|
| European Union (EU) | 4.4% |
The growth of Japan's QCL market is also attributed to precision manufacturing, biomedical diagnostics, and semiconductor inspection. QCL-based sensor development and integration with MEMS is being pursued by leading tech companies and universities.
Key drivers are government support for photonics research, and increasing use of QCLs in automotive emissions monitoring and high-speed communication.
| Country | CAGR (2025 to 2035) |
|---|---|
| Japan | 4.2% |
South Korea's QCL market is pushed by money put into defense technology, electronics making, and checking the air. The Ministry of Science and ICT gives funds to research with KAIST and others.
Important trends include small and efficient QCLs, linking with IoT-based monitoring systems, and rise in non-invasive medical checks.
| Country | CAGR (2025 to 2035) |
|---|---|
| South Korea | 4.3% |
The global quantum cascade lasers (QCL) market is anticipated to witness a significant growth between 2025 and 2035 driven by growing demand from environmental monitoring, industrial gas sensing, medical diagnostics, and defense applications. After QCLs were developed in the late 90s, they quickly became preferred for their compact size, tunability, and reliability, and the need for high-performance mid-infrared light sources is only growing. Advances in semiconductor laser design capabilities, especially in the areas of output power and beam quality, are driving the development of both continuous wave (CW) operation and sophisticated packaging schemes like TO3.
The packaging type and operation mode segmentation remain key facets that drive the dynamics of the competitive space, with the TO3 and the continuous wave segments taking shape as distinct frontrunners in 2025, owing to better thermal efficiency and operational characteristics.
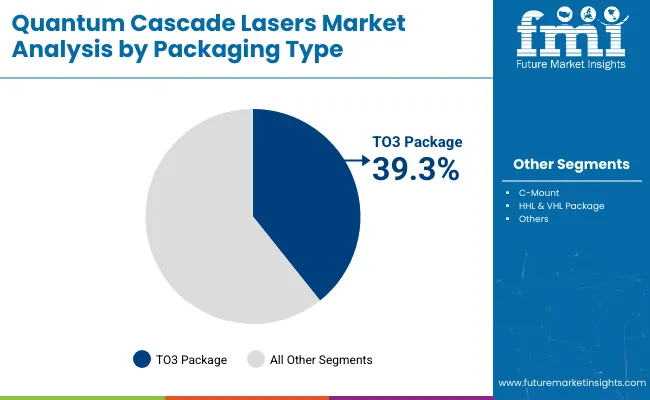
| Packaging Type | Market Share (2025) |
|---|---|
| TO3 Package | 39.3% |
TO3 packaging has the highest penetrations in QCL market, accounting for 39.3% of the total market share in 2025. TO3 packaging is renowned for its robust architecture, enabling superior thermal management, making it perfectly suited for mounting high-power quantum cascade laser chips that necessitate intense thermal dissipation.
Such a format is particularly preferred in industrial-grade and scientific instrumentation systems where extended use, accuracy, and longevity are imperative. The durability of devices designed for defense and environmental sciences is paramount as they often work in extreme conditions and must deliver reliable performance continually the TO3 package provides this longevity.
From high-tech infrared spectroscopy devices to battlefront chemical detectors, to big gas analysis machines. As laser systems continue to get more powerful, there will be a higher demand for packaging that can withstand more heat, as well as more sophisticated electrical interfacing that is less sensitive to thermal expansion, making TO3 even more powerful in the market.
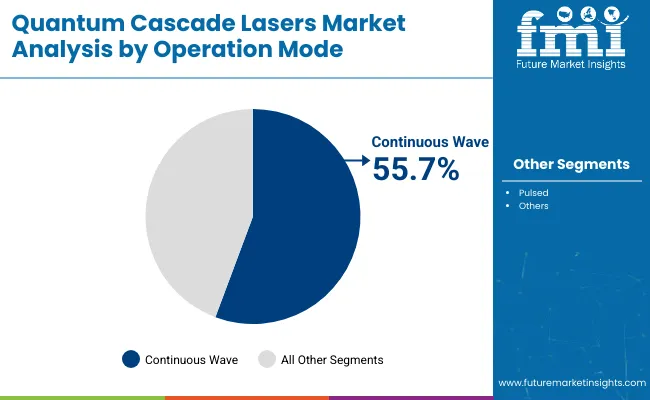
| Operation Mode | Market Share (2025) |
|---|---|
| Continuous Wave | 55.7% |
The CW operation held the highest share of global operation mode, occupying 55.7% of the market in 2025. The CW QCLs have considerable advantages in high precision settings where a smooth, continuous laser output is vital. With stable emission properties, they are ideally used in real-time gas detection, breath analysis, and trace chemical detection, where data consistency and long duration of measurement are two critical performance metrics.
CW QCLs have extensive use in healthcare, including diagnostic devices such as less invasive glucose monitors and breath analyzers where high-resolution spectral analysis improves performance. They are also foundational in emissions monitoring and greenhouse gas analytical systems in environmental applications. The increasing demand for long-range and high-resolution LIDAR systems for autonomous navigation is also anticipated to augment the growth of this segment.
Quantum cascade lasers (QCLs) are growing at a rapid pace, driven by demand across spectroscopy, defense, medical diagnostics, and environmental monitoring, etc. For precision sensing in industrial and security operations, tunable compact mid-IR and THz sources of high resolution, such as QCLs, are becoming increasingly prevalent.
Industry leaders are focusing on fabrication methods, integration with photonic systems, and miniaturization for devices designed to be handheld and field-capable. The increasing emphasis on homeland security and the industrial gas sensing segment, and the growing development of QCL (Quantum Cascade Laser)-based imaging are further driving market competitiveness.
Market Share Analysis by Company
| Company Name | Estimated Market Share (%) |
|---|---|
| Thorlabs, Inc. | 18 - 22% |
| Alpes Lasers SA | 15 - 18% |
| Hamamatsu Photonics K.K. | 12 - 16% |
| mirSense | 10 - 14% |
| AdTech Optics Inc. | 6 - 10% |
| Other Companies (combined) | 25 - 30% |
| Company Name | Key Offerings/Activities |
|---|---|
| Thorlabs, Inc. | In 2024, Thorlabs, Inc., brought out new QCL gas detection tools. Then in 2025, Thorlabs, Inc. set up automated QCL packaging in the USA |
| Alpes Lasers SA | In 2024, Alpes Lasers SA, grew ou r tunable QCL range. By 2025, it teamed up with EU defense on infrared tech. |
| Hamamatsu Photonics K.K. | In 2024, Hamamatsu Photonics K.K., made QCLs with better beams. In 2025, boosted production in Asia-Pacific. |
| mirSense | In 2024, mirSense, made small QCL sensors for safety. Then in 2025, it improved dual-mode use for environmental checks. |
| AdTech Optics Inc. | In 2024, AdTech Optics Inc., gave QCL chips to OEMs. By 2025, it joined up with aerospace firms for top-notch spectroscopic uses. |
Key Company Insights
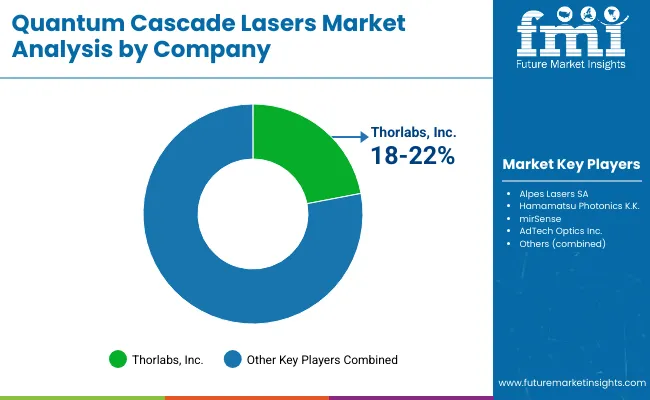
Thorlabs, Inc. (18-22%)
A global leader in photonics, Thorlabs is the dominant player in the QCL component space with its extensive portfolio of turnkey laser modules, fiber-coupled systems and sensing platforms. Its 2025 strategy also focuses on modular integration and scalable production for commercial markets.
Alpes Lasers SA (15-18%)
Alpes Lasers has a well-known reputation in defense and medical applications, based on its specialization on distributed feedback (DFB) QCLs. SBA’s investments in tunability and spectral performance further strengthen its standing in high-value analytical markets.
Hamamatsu Photonics K.K. (12-16%)
Specializing in photonic instrumentation, Hamamatsu is applying its precision engineering towards delivering high-quality QCLs for spectroscopy, with a particular focus on Asia-Pacific. Its expansion in 2025 provides growth in automotive emissions testing and environmental monitoring.
mirSense (10-14%)
mirSense (France) provides compact, rugged QCL solutions for real time sensing in demanding environments. The company’s dual-use capabilities extend from industrial monitoring to defense-related spectroscopy.
AdTech Optics Inc. (6-10%)
AdTech Optics, a niche supplier for QCL chips based in the USA, specializes in OEM-level customization at a smaller scale, mainly cats, industrial and academic research. It remains a leader in high-power, low-divergence QCL chipsets.
Other Key Players (25-30% Combined)
Several other companies play vital roles in regional markets and specialty QCL applications:
The overall market size for the quantum cascade lasers market was USD 441.9 million in 2025.
The quantum cascade lasers market is expected to reach USD 673.3 million in 2035.
Key drivers include increasing demand for advanced spectroscopy applications, growing use in industrial process monitoring, environmental sensing.
The leading regions contributing to the market include North America, Europe, and Asia-Pacific.
The gas sensing and chemical detection segment is expected to lead, driven by heightened environmental regulations and demand for real-time monitoring technologies.


Our Research Products

The "Full Research Suite" delivers actionable market intel, deep dives on markets or technologies, so clients act faster, cut risk, and unlock growth.

The Leaderboard benchmarks and ranks top vendors, classifying them as Established Leaders, Leading Challengers, or Disruptors & Challengers.

Locates where complements amplify value and substitutes erode it, forecasting net impact by horizon

We deliver granular, decision-grade intel: market sizing, 5-year forecasts, pricing, adoption, usage, revenue, and operational KPIs—plus competitor tracking, regulation, and value chains—across 60 countries broadly.

Spot the shifts before they hit your P&L. We track inflection points, adoption curves, pricing moves, and ecosystem plays to show where demand is heading, why it is changing, and what to do next across high-growth markets and disruptive tech

Real-time reads of user behavior. We track shifting priorities, perceptions of today’s and next-gen services, and provider experience, then pace how fast tech moves from trial to adoption, blending buyer, consumer, and channel inputs with social signals (#WhySwitch, #UX).

Partner with our analyst team to build a custom report designed around your business priorities. From analysing market trends to assessing competitors or crafting bespoke datasets, we tailor insights to your needs.
Supplier Intelligence
Discovery & Profiling
Capacity & Footprint
Performance & Risk
Compliance & Governance
Commercial Readiness
Who Supplies Whom
Scorecards & Shortlists
Playbooks & Docs
Category Intelligence
Definition & Scope
Demand & Use Cases
Cost Drivers
Market Structure
Supply Chain Map
Trade & Policy
Operating Norms
Deliverables
Buyer Intelligence
Account Basics
Spend & Scope
Procurement Model
Vendor Requirements
Terms & Policies
Entry Strategy
Pain Points & Triggers
Outputs
Pricing Analysis
Benchmarks
Trends
Should-Cost
Indexation
Landed Cost
Commercial Terms
Deliverables
Brand Analysis
Positioning & Value Prop
Share & Presence
Customer Evidence
Go-to-Market
Digital & Reputation
Compliance & Trust
KPIs & Gaps
Outputs
Full Research Suite comprises of:
Market outlook & trends analysis
Interviews & case studies
Strategic recommendations
Vendor profiles & capabilities analysis
5-year forecasts
8 regions and 60+ country-level data splits
Market segment data splits
12 months of continuous data updates
DELIVERED AS:
PDF EXCEL ONLINE
Quantum Cascade Laser Market Size and Share Forecast Outlook 2025 to 2035
Quantum Photonics Market Size and Share Forecast Outlook 2025 to 2035
Quantum Detector Market Size and Share Forecast Outlook 2025 to 2035
Quantum Imaging Devices Market Analysis - Size, Share, and Forecast Outlook 2025 to 2035
Quantum Sensors Market Size and Share Forecast Outlook 2025 to 2035
Quantum Computing Market Growth – Trends & Forecast 2025 to 2035
Quantum Cryptography Market Insights - Growth & Forecast 2025 to 2035
Quantum Dot Market Analysis by Application, End-Use Industry, Material Type, Technology, and Region Through 2035
Post-Quantum Cryptography (PQC) Migration Market Analysis - Size, Share, and Forecast Outlook 2025 to 2035
Dental Lasers Market Growth – Industry Insights & Forecast 2024-2034
Urology Lasers Market Size and Share Forecast Outlook 2025 to 2035
Anderson Cascade Impactor Market Size and Share Forecast Outlook 2025 to 2035
Cosmetic Lasers Market
Surgical Lasers Market
Ultrafast Lasers Market Analysis - Industry Growth & Forecast 2025 to 2035
Veterinary Lasers Market Size and Share Forecast Outlook 2025 to 2035
Automotive Quantum Computing Market Size and Share Forecast Outlook 2025 to 2035
Integrated Quantum Optical Circuits Market Size and Share Forecast Outlook 2025 to 2035
Ophthalmic Lasers Market Analysis - Innovations & Forecast 2024 to 2034
Dermatology Lasers Market - Demand, Innovations & Forecast 2025 to 2035

Thank you!
You will receive an email from our Business Development Manager. Please be sure to check your SPAM/JUNK folder too.
Chat With
MaRIA