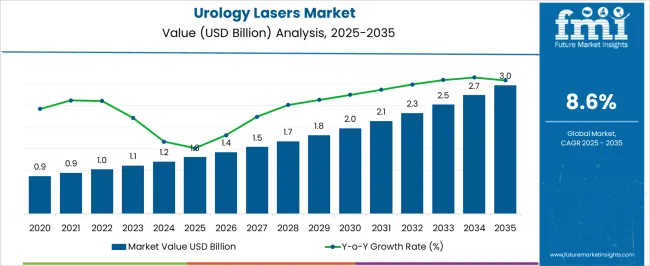
The global urology lasers market is poised to surpass US$ 1.1 billion by 2023, surging at a remarkable CAGR of 9.0% through 2033 to reach US$ 2.6 billion.
The global urology lasers market is projected to witness substantial growth, fueled by the increasing prevalence of urology disorders worldwide and a growing preference for non-invasive surgical procedures.
Factors such as the surge in product approvals and ongoing research and development activities pertaining to urology laser devices are also influencing the market's progression.
Certain challenges are also anticipated to impede the global market's growth, including the high costs associated with urology laser devices and procedures, concerns regarding safety, and potential adverse effects linked to laser treatments.
Attributes | Details |
---|---|
Urology Lasers Market Size (2023) | US$ 1.1 billion |
Urology Lasers Market Projected Size (2033) | US$ 2.6 billion |
Urology Lasers Market Value-based CAGR (2023 to 2033) | 9.0% |
Don't pay for what you don't need
Customize your report by selecting specific countries or regions and save 30%!
The revenue generated by the urology lasers market witnessed a significant increase from 2018 to 2022, driven by the growing demand for advanced urological treatments and the adoption of minimally invasive procedures.
As per the FMI study, the urology lasers industry garnered revenue of US$ 1 billion in 2022 and grew at a 12.2% rate from 2018 to 2022.
The demand outlook for urology lasers is expected to experience a substantial surge. This can be attributed to various factors, including the rising global prevalence of urological disorders, an increasing aging population, technological advancements in laser-based therapies, and a shift towards non-invasive treatment options.
These factors collectively indicate a promising future for the urology lasers industry, with strong growth potential of 9.0% from 2023 to 2033, reaching US$ 2.6 billion by 2033.
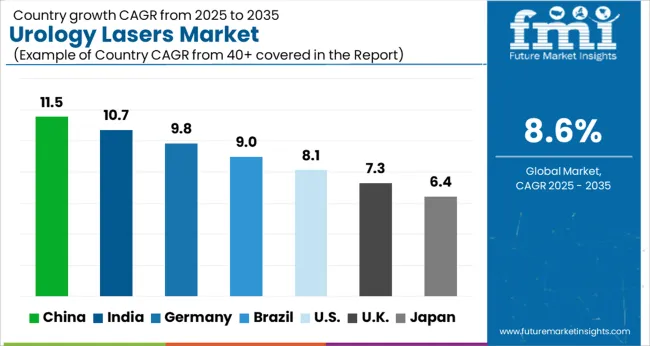
China, with its vast population and increasing prevalence of urological disorders, is projected to offer a multitude of opportunities for the urology lasers market.
The country's growing healthcare infrastructure, rising disposable income, and expanding middle class contribute to increased demand for advanced urological treatments. Additionally, the Chinese government's initiatives to enhance healthcare access and improve medical technology further support market growth.
The rising awareness among healthcare professionals and patients regarding the benefits of urology lasers, coupled with favorable reimbursement policies, creates a conducive environment for market expansion.
China presents a promising landscape for urology laser manufacturers and providers to tap into a vast patient base and establish a strong presence in this rapidly growing market, moving ahead with 8.9% from 2023 to 2033, touching US$ 554.5 million by 2033.
According to the NCBI, fluid, and calcium consumption have a substantial role in the development of urinary stones, causing urolithiasis in 50% of United States patients.
As per FMI, the United States of America offers a promising growth outlook for the urology lasers industry, with a market share of US$ 468.2 million by 2033.
The emphasis on minimally invasive procedures and the adoption of innovative medical technologies drive the adoption of urology lasers. Furthermore, ongoing research and development activities, collaborations between industry players and academic institutions, and a strong regulatory framework foster innovation and support the introduction of new urology laser devices.
The United States hence presents a favorable market landscape for urology laser manufacturers, with ample opportunities for growth and advancement in this dynamic industry.
Get the data you need at a Fraction of the cost
Personalize your report by choosing insights you need
and save 40%!
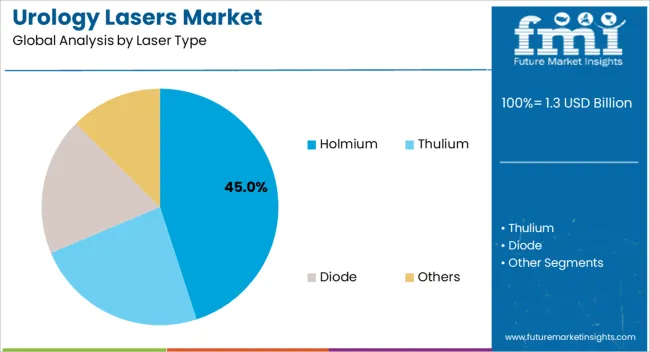
The holmium systems market is expanding as a result of their effectiveness and safety in treating patients without a surgical procedure, in turn, securing a CAGR of 8.9% during the forecast period.
A minimally invasive procedure is favored for the removal of tissues that obstruct urine flow via the prostate, and this is the principal application for which the holmium laser is utilized.
Due to its safety and efficiency in treating patients without an incision process, holmium systems are becoming increasingly popular.
Depending on the size of the prostate, the treatment can take anywhere from 45 to 90 minutes. Patients can be released from the hospital on the same day because this surgery is less intrusive. It is anticipated that these elements may increase demand for urology lasers.
By 2033, the Benign Prostatic Hyperplasia category is anticipated to advance at 8.8% from 2023 to 2033. The development can be due to elements like inactivity, excess weight, and a diet rich in red meat and fat, which may raise the risk of BPH.
Benign Prostatic Hyperplasia (BPH) is predicted to lead the market by application due to several key factors. Firstly, BPH is a common condition among aging males, with a high prevalence globally.
As the population continues to age, the incidence of BPH is expected to rise, creating a growing patient pool.
Secondly, urology lasers offer an effective and minimally invasive treatment option for BPH, providing precise tissue ablation and improved patient outcomes.
The advantages of urology lasers, such as reduced bleeding, shorter hospital stays, and faster recovery times, make them an attractive choice for BPH treatment.
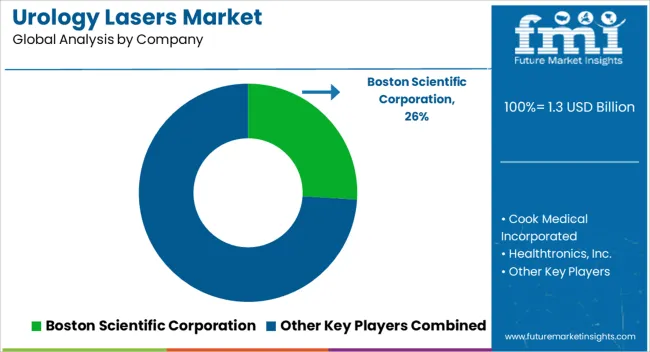
A few prominent firms dominate the market for urology lasers, which is only moderately competitive. Currently, a select few big businesses control the majority of the market in terms of market share.
To maintain their position in the worldwide market, the top companies are engaged in a variety of strategic alliances, including acquisitions and the introduction of new products.
Along with developing cutting-edge laparoscopic urological gadgets, the participants concentrate on analyzing technical developments and putting growth tactics like mergers and acquisitions into practice.
Recent Developments in the Market:
As per FMI, the market for urology lasers is estimated to be US$ 1.1 billion in 2023.
The urology lasers industry secured a CAGR of 12.1% from 2018 to 2022.
The market in China is projected to advance at a rate of 8.9% from 2023 to 2033.
By laser type, the Holmium segment is likely to lead the urology lasers market.
The projected market size for the urology lasers market is likely to be US$ 2.6 billion by 2033.
The market in 2023 is valued at US$ 1.1 billion.
The market rose at a 12.2% CAGR from 2018 to 2022.
The holmium systems market is to secure an 8.9% CAGR by 2033.
By 2033, the United States is estimated to reach US$ 468.2 million.
Boston Scientific Corporation Systems and Cook Medical Incorporated dominate the market.
1. Executive Summary 1.1. Global Market Outlook 1.2. Demand-side Trends 1.3. Supply-side Trends 1.4. Technology Roadmap Analysis 1.5. Analysis and Recommendations 2. Market Overview 2.1. Market Coverage / Taxonomy 2.2. Market Definition / Scope / Limitations 3. Market Background 3.1. Market Dynamics 3.1.1. Drivers 3.1.2. Restraints 3.1.3. Opportunity 3.1.4. Trends 3.2. Scenario Forecast 3.2.1. Demand in Optimistic Scenario 3.2.2. Demand in Likely Scenario 3.2.3. Demand in Conservative Scenario 3.3. Opportunity Map Analysis 3.4. Product Life Cycle Analysis 3.5. Supply Chain Analysis 3.5.1. Supply Side Participants and their Roles 3.5.1.1. Producers 3.5.1.2. Mid-Level Participants (Traders/ Agents/ Brokers) 3.5.1.3. Wholesalers and Distributors 3.5.2. Value Added and Value Created at Node in the Supply Chain 3.5.3. List of Raw Material Suppliers 3.5.4. List of Existing and Potential Buyer’s 3.6. Investment Feasibility Matrix 3.7. Value Chain Analysis 3.7.1. Profit Margin Analysis 3.7.2. Wholesalers and Distributors 3.7.3. Retailers 3.8. PESTLE and Porter’s Analysis 3.9. Regulatory Landscape 3.9.1. By Key Regions 3.9.2. By Key Countries 3.10. Regional Parent Market Outlook 3.11. Production and Consumption Statistics 3.12. Import and Export Statistics 4. Global Market Analysis 2018 to 2022 and Forecast, 2023 to 2033 4.1. Historical Market Size Value (US$ Million) & Volume (Units) Analysis, 2018 to 2022 4.2. Current and Future Market Size Value (US$ Million) & Volume (Units) Projections, 2023 to 2033 4.2.1. Y-o-Y Growth Trend Analysis 4.2.2. Absolute $ Opportunity Analysis 5. Global Market Analysis 2018 to 2022 and Forecast 2023 to 2033, By Laser Type 5.1. Introduction / Key Findings 5.2. Historical Market Size Value (US$ Million) & Volume (Units) Analysis By Laser Type, 2018 to 2022 5.3. Current and Future Market Size Value (US$ Million) & Volume (Units) Analysis and Forecast By Laser Type, 2023 to 2033 5.3.1. Holmium 5.3.2. Thulium 5.3.3. Diode 5.3.4. Others 5.4. Y-o-Y Growth Trend Analysis By Laser Type, 2018 to 2022 5.5. Absolute $ Opportunity Analysis By Laser Type, 2023 to 2033 6. Global Market Analysis 2018 to 2022 and Forecast 2023 to 2033, By Application 6.1. Introduction / Key Findings 6.2. Historical Market Size Value (US$ Million) & Volume (Units) Analysis By Application, 2018 to 2022 6.3. Current and Future Market Size Value (US$ Million) & Volume (Units) Analysis and Forecast By Application, 2023 to 2033 6.3.1. Benign Prostatic Hyperplasia 6.3.2. Urolithiasis 6.3.3. Non-Muscle Invasive Bladder Cancer (NMIBC) 6.3.4. Others 6.4. Y-o-Y Growth Trend Analysis By Application, 2018 to 2022 6.5. Absolute $ Opportunity Analysis By Application, 2023 to 2033 7. Global Market Analysis 2018 to 2022 and Forecast 2023 to 2033, By Region 7.1. Introduction 7.2. Historical Market Size Value (US$ Million) & Volume (Units) Analysis By Region, 2018 to 2022 7.3. Current Market Size Value (US$ Million) & Volume (Units) Analysis and Forecast By Region, 2023 to 2033 7.3.1. North America 7.3.2. Latin America 7.3.3. Western Europe 7.3.4. Eastern Europe 7.3.5. South Asia and Pacific 7.3.6. East Asia 7.3.7. Middle East and Africa 7.4. Market Attractiveness Analysis By Region 8. North America Market Analysis 2018 to 2022 and Forecast 2023 to 2033, By Country 8.1. Historical Market Size Value (US$ Million) & Volume (Units) Trend Analysis By Market Taxonomy, 2018 to 2022 8.2. Market Size Value (US$ Million) & Volume (Units) Forecast By Market Taxonomy, 2023 to 2033 8.2.1. By Country 8.2.1.1. USA 8.2.1.2. Canada 8.2.2. By Laser Type 8.2.3. By Application 8.3. Market Attractiveness Analysis 8.3.1. By Country 8.3.2. By Laser Type 8.3.3. By Application 8.4. Key Takeaways 9. Latin America Market Analysis 2018 to 2022 and Forecast 2023 to 2033, By Country 9.1. Historical Market Size Value (US$ Million) & Volume (Units) Trend Analysis By Market Taxonomy, 2018 to 2022 9.2. Market Size Value (US$ Million) & Volume (Units) Forecast By Market Taxonomy, 2023 to 2033 9.2.1. By Country 9.2.1.1. Brazil 9.2.1.2. Mexico 9.2.1.3. Rest of Latin America 9.2.2. By Laser Type 9.2.3. By Application 9.3. Market Attractiveness Analysis 9.3.1. By Country 9.3.2. By Laser Type 9.3.3. By Application 9.4. Key Takeaways 10. Western Europe Market Analysis 2018 to 2022 and Forecast 2023 to 2033, By Country 10.1. Historical Market Size Value (US$ Million) & Volume (Units) Trend Analysis By Market Taxonomy, 2018 to 2022 10.2. Market Size Value (US$ Million) & Volume (Units) Forecast By Market Taxonomy, 2023 to 2033 10.2.1. By Country 10.2.1.1. Germany 10.2.1.2. UK 10.2.1.3. France 10.2.1.4. Spain 10.2.1.5. Italy 10.2.1.6. Rest of Western Europe 10.2.2. By Laser Type 10.2.3. By Application 10.3. Market Attractiveness Analysis 10.3.1. By Country 10.3.2. By Laser Type 10.3.3. By Application 10.4. Key Takeaways 11. Eastern Europe Market Analysis 2018 to 2022 and Forecast 2023 to 2033, By Country 11.1. Historical Market Size Value (US$ Million) & Volume (Units) Trend Analysis By Market Taxonomy, 2018 to 2022 11.2. Market Size Value (US$ Million) & Volume (Units) Forecast By Market Taxonomy, 2023 to 2033 11.2.1. By Country 11.2.1.1. Poland 11.2.1.2. Russia 11.2.1.3. Czech Republic 11.2.1.4. Romania 11.2.1.5. Rest of Eastern Europe 11.2.2. By Laser Type 11.2.3. By Application 11.3. Market Attractiveness Analysis 11.3.1. By Country 11.3.2. By Laser Type 11.3.3. By Application 11.4. Key Takeaways 12. South Asia and Pacific Market Analysis 2018 to 2022 and Forecast 2023 to 2033, By Country 12.1. Historical Market Size Value (US$ Million) & Volume (Units) Trend Analysis By Market Taxonomy, 2018 to 2022 12.2. Market Size Value (US$ Million) & Volume (Units) Forecast By Market Taxonomy, 2023 to 2033 12.2.1. By Country 12.2.1.1. India 12.2.1.2. Bangladesh 12.2.1.3. Australia 12.2.1.4. New Zealand 12.2.1.5. Rest of South Asia and Pacific 12.2.2. By Laser Type 12.2.3. By Application 12.3. Market Attractiveness Analysis 12.3.1. By Country 12.3.2. By Laser Type 12.3.3. By Application 12.4. Key Takeaways 13. East Asia Market Analysis 2018 to 2022 and Forecast 2023 to 2033, By Country 13.1. Historical Market Size Value (US$ Million) & Volume (Units) Trend Analysis By Market Taxonomy, 2018 to 2022 13.2. Market Size Value (US$ Million) & Volume (Units) Forecast By Market Taxonomy, 2023 to 2033 13.2.1. By Country 13.2.1.1. China 13.2.1.2. Japan 13.2.1.3. South Korea 13.2.2. By Laser Type 13.2.3. By Application 13.3. Market Attractiveness Analysis 13.3.1. By Country 13.3.2. By Laser Type 13.3.3. By Application 13.4. Key Takeaways 14. Middle East and Africa Market Analysis 2018 to 2022 and Forecast 2023 to 2033, By Country 14.1. Historical Market Size Value (US$ Million) & Volume (Units) Trend Analysis By Market Taxonomy, 2018 to 2022 14.2. Market Size Value (US$ Million) & Volume (Units) Forecast By Market Taxonomy, 2023 to 2033 14.2.1. By Country 14.2.1.1. GCC Countries 14.2.1.2. South Africa 14.2.1.3. Israel 14.2.1.4. Rest of MEA 14.2.2. By Laser Type 14.2.3. By Application 14.3. Market Attractiveness Analysis 14.3.1. By Country 14.3.2. By Laser Type 14.3.3. By Application 14.4. Key Takeaways 15. Key Countries Market Analysis 15.1. USA 15.1.1. Pricing Analysis 15.1.2. Market Share Analysis, 2022 15.1.2.1. By Laser Type 15.1.2.2. By Application 15.2. Canada 15.2.1. Pricing Analysis 15.2.2. Market Share Analysis, 2022 15.2.2.1. By Laser Type 15.2.2.2. By Application 15.3. Brazil 15.3.1. Pricing Analysis 15.3.2. Market Share Analysis, 2022 15.3.2.1. By Laser Type 15.3.2.2. By Application 15.4. Mexico 15.4.1. Pricing Analysis 15.4.2. Market Share Analysis, 2022 15.4.2.1. By Laser Type 15.4.2.2. By Application 15.5. Germany 15.5.1. Pricing Analysis 15.5.2. Market Share Analysis, 2022 15.5.2.1. By Laser Type 15.5.2.2. By Application 15.6. UK 15.6.1. Pricing Analysis 15.6.2. Market Share Analysis, 2022 15.6.2.1. By Laser Type 15.6.2.2. By Application 15.7. France 15.7.1. Pricing Analysis 15.7.2. Market Share Analysis, 2022 15.7.2.1. By Laser Type 15.7.2.2. By Application 15.8. Spain 15.8.1. Pricing Analysis 15.8.2. Market Share Analysis, 2022 15.8.2.1. By Laser Type 15.8.2.2. By Application 15.9. Italy 15.9.1. Pricing Analysis 15.9.2. Market Share Analysis, 2022 15.9.2.1. By Laser Type 15.9.2.2. By Application 15.10. Poland 15.10.1. Pricing Analysis 15.10.2. Market Share Analysis, 2022 15.10.2.1. By Laser Type 15.10.2.2. By Application 15.11. Russia 15.11.1. Pricing Analysis 15.11.2. Market Share Analysis, 2022 15.11.2.1. By Laser Type 15.11.2.2. By Application 15.12. Czech Republic 15.12.1. Pricing Analysis 15.12.2. Market Share Analysis, 2022 15.12.2.1. By Laser Type 15.12.2.2. By Application 15.13. Romania 15.13.1. Pricing Analysis 15.13.2. Market Share Analysis, 2022 15.13.2.1. By Laser Type 15.13.2.2. By Application 15.14. India 15.14.1. Pricing Analysis 15.14.2. Market Share Analysis, 2022 15.14.2.1. By Laser Type 15.14.2.2. By Application 15.15. Bangladesh 15.15.1. Pricing Analysis 15.15.2. Market Share Analysis, 2022 15.15.2.1. By Laser Type 15.15.2.2. By Application 15.16. Australia 15.16.1. Pricing Analysis 15.16.2. Market Share Analysis, 2022 15.16.2.1. By Laser Type 15.16.2.2. By Application 15.17. New Zealand 15.17.1. Pricing Analysis 15.17.2. Market Share Analysis, 2022 15.17.2.1. By Laser Type 15.17.2.2. By Application 15.18. China 15.18.1. Pricing Analysis 15.18.2. Market Share Analysis, 2022 15.18.2.1. By Laser Type 15.18.2.2. By Application 15.19. Japan 15.19.1. Pricing Analysis 15.19.2. Market Share Analysis, 2022 15.19.2.1. By Laser Type 15.19.2.2. By Application 15.20. South Korea 15.20.1. Pricing Analysis 15.20.2. Market Share Analysis, 2022 15.20.2.1. By Laser Type 15.20.2.2. By Application 15.21. GCC Countries 15.21.1. Pricing Analysis 15.21.2. Market Share Analysis, 2022 15.21.2.1. By Laser Type 15.21.2.2. By Application 15.22. South Africa 15.22.1. Pricing Analysis 15.22.2. Market Share Analysis, 2022 15.22.2.1. By Laser Type 15.22.2.2. By Application 15.23. Israel 15.23.1. Pricing Analysis 15.23.2. Market Share Analysis, 2022 15.23.2.1. By Laser Type 15.23.2.2. By Application 16. Market Structure Analysis 16.1. Competition Dashboard 16.2. Competition Benchmarking 16.3. Market Share Analysis of Top Players 16.3.1. By Regional 16.3.2. By Laser Type 16.3.3. By Application 17. Competition Analysis 17.1. Competition Deep Dive 17.1.1. Boston Scientific Corporation 17.1.1.1. Overview 17.1.1.2. Product Portfolio 17.1.1.3. Profitability by Market Segments 17.1.1.4. Sales Footprint 17.1.1.5. Strategy Overview 17.1.1.5.1. Marketing Strategy 17.1.1.5.2. Product Strategy 17.1.1.5.3. Channel Strategy 17.1.2. Cook Medical Incorporated 17.1.2.1. Overview 17.1.2.2. Product Portfolio 17.1.2.3. Profitability by Market Segments 17.1.2.4. Sales Footprint 17.1.2.5. Strategy Overview 17.1.2.5.1. Marketing Strategy 17.1.2.5.2. Product Strategy 17.1.2.5.3. Channel Strategy 17.1.3. Healthtronics, Inc. 17.1.3.1. Overview 17.1.3.2. Product Portfolio 17.1.3.3. Profitability by Market Segments 17.1.3.4. Sales Footprint 17.1.3.5. Strategy Overview 17.1.3.5.1. Marketing Strategy 17.1.3.5.2. Product Strategy 17.1.3.5.3. Channel Strategy 17.1.4. Jena Surgical GmbH 17.1.4.1. Overview 17.1.4.2. Product Portfolio 17.1.4.3. Profitability by Market Segments 17.1.4.4. Sales Footprint 17.1.4.5. Strategy Overview 17.1.4.5.1. Marketing Strategy 17.1.4.5.2. Product Strategy 17.1.4.5.3. Channel Strategy 17.1.5. Karl Storz GmbH & Co.Kg 17.1.5.1. Overview 17.1.5.2. Product Portfolio 17.1.5.3. Profitability by Market Segments 17.1.5.4. Sales Footprint 17.1.5.5. Strategy Overview 17.1.5.5.1. Marketing Strategy 17.1.5.5.2. Product Strategy 17.1.5.5.3. Channel Strategy 17.1.6. Lumenis Ltd. 17.1.6.1. Overview 17.1.6.2. Product Portfolio 17.1.6.3. Profitability by Market Segments 17.1.6.4. Sales Footprint 17.1.6.5. Strategy Overview 17.1.6.5.1. Marketing Strategy 17.1.6.5.2. Product Strategy 17.1.6.5.3. Channel Strategy 17.1.7. Olympus Corporation 17.1.7.1. Overview 17.1.7.2. Product Portfolio 17.1.7.3. Profitability by Market Segments 17.1.7.4. Sales Footprint 17.1.7.5. Strategy Overview 17.1.7.5.1. Marketing Strategy 17.1.7.5.2. Product Strategy 17.1.7.5.3. Channel Strategy 17.1.8. Richard Wolf Gmbh 17.1.8.1. Overview 17.1.8.2. Product Portfolio 17.1.8.3. Profitability by Market Segments 17.1.8.4. Sales Footprint 17.1.8.5. Strategy Overview 17.1.8.5.1. Marketing Strategy 17.1.8.5.2. Product Strategy 17.1.8.5.3. Channel Strategy 17.1.9. Starmedtec Gmbh 17.1.9.1. Overview 17.1.9.2. Product Portfolio 17.1.9.3. Profitability by Market Segments 17.1.9.4. Sales Footprint 17.1.9.5. Strategy Overview 17.1.9.5.1. Marketing Strategy 17.1.9.5.2. Product Strategy 17.1.9.5.3. Channel Strategy 17.1.10. Stryker Corporation 17.1.10.1. Overview 17.1.10.2. Product Portfolio 17.1.10.3. Profitability by Market Segments 17.1.10.4. Sales Footprint 17.1.10.5. Strategy Overview 17.1.10.5.1. Marketing Strategy 17.1.10.5.2. Product Strategy 17.1.10.5.3. Channel Strategy 18. Assumptions & Acronyms Used 19. Research Methodology
Explore Healthcare Insights
View Reports