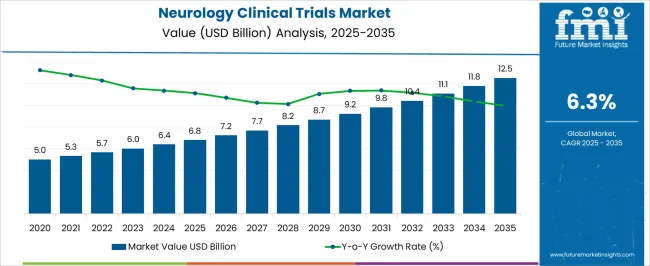
The Neurology Clinical Trials Market is estimated to be valued at USD 6.8 billion in 2025 and is projected to reach USD 12.5 billion by 2035, registering a compound annual growth rate (CAGR) of 6.3% over the forecast period.
| Metric | Value |
|---|---|
| Neurology Clinical Trials Market Estimated Value in (2025 E) | USD 6.8 billion |
| Neurology Clinical Trials Market Forecast Value in (2035 F) | USD 12.5 billion |
| Forecast CAGR (2025 to 2035) | 6.3% |
The neurology clinical trials market is experiencing consistent growth due to the increasing global burden of neurological disorders and the growing need for innovative therapeutic interventions. Advancements in neuroimaging, biomarker validation, and digital health monitoring are enhancing the precision and efficiency of clinical research.
The complexity and variability of neurological conditions have driven demand for adaptive trial designs and targeted therapeutic development. Rising investment by pharmaceutical and biotechnology companies, along with support from academic institutions and patient advocacy groups, is accelerating trial initiation across a range of neurological indications.
Regulatory authorities are also offering incentives such as fast track designations and orphan drug approvals to expedite research efforts. As the prevalence of neurodegenerative and neuroinflammatory diseases continues to rise globally, the outlook for neurology clinical trials remains optimistic, with a strong focus on early phase research, patient centric approaches, and technological integration.
The market is segmented by Phase, Study Design, and Epilepsy and region. By Phase, the market is divided into Phase I, Phase II, Phase III, and Phase IV. In terms of Study Design, the market is classified into Interventional, Observational, and Expanded access. Based on Epilepsy, the market is segmented into Parkinson’s Disease, Huntington’s Disease, Stroke, Traumatic brain Injury (TBI), Amyotrophic Lateral Sclerosis (ALS), Muscle regeneration, and Other Indications. Regionally, the market is classified into North America, Latin America, Western Europe, Eastern Europe, Balkan & Baltic Countries, Russia & Belarus, Central Asia, East Asia, South Asia & Pacific, and the Middle East & Africa.
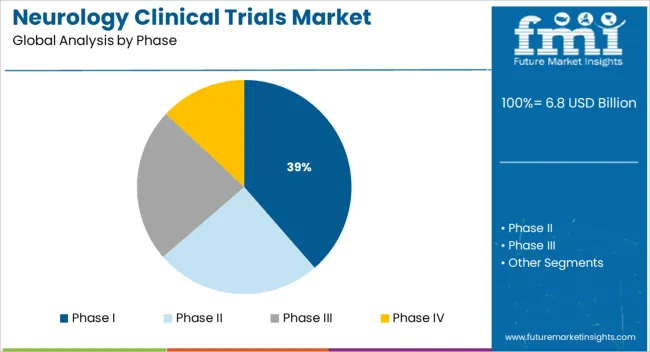
The Phase I segment is projected to account for 38.60% of total market revenue by 2025 within the clinical trial phase category, positioning it as the leading segment. This dominance is driven by the increasing number of novel drug entities entering the development pipeline for neurological conditions.
Early phase trials are critical in assessing safety, tolerability, and pharmacokinetics, which are particularly important for diseases affecting the central nervous system. Due to the complexity and high risk associated with neurology drug development, sponsors are prioritizing Phase I studies to de risk long term investments and gather robust early data.
Additionally, innovation in patient recruitment strategies and the use of advanced biomarkers in first in human studies are strengthening the role of Phase I trials. These trials are also increasingly being conducted in specialized research centers equipped with the necessary infrastructure for neurological assessments, reinforcing their position as the most active segment in the clinical development process.
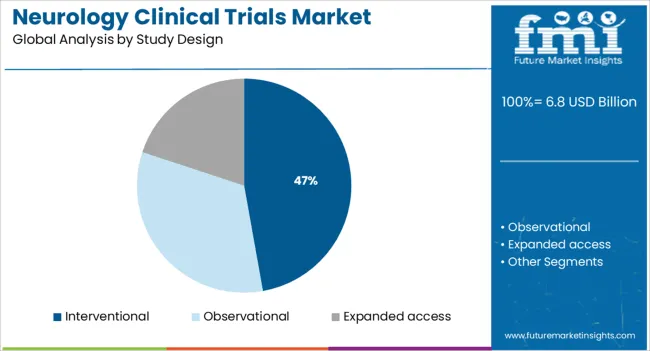
The interventional study design segment is expected to contribute 47.20% of total market revenue by 2025, establishing it as the dominant study type. This growth is fueled by the need to evaluate new therapies through controlled and measurable intervention protocols, particularly in diseases with complex pathophysiology such as neurodegenerative disorders.
Interventional trials allow for the direct assessment of drug efficacy and safety, making them essential in therapeutic validation. Enhanced regulatory clarity and increased sponsor confidence in outcome driven designs have further supported their adoption.
Technological tools such as wearable devices and real time data capture systems are improving trial efficiency and monitoring, enhancing the feasibility of conducting interventional studies even in decentralized settings. This methodological rigor and adaptability have ensured that interventional trials remain the backbone of neurology clinical research.
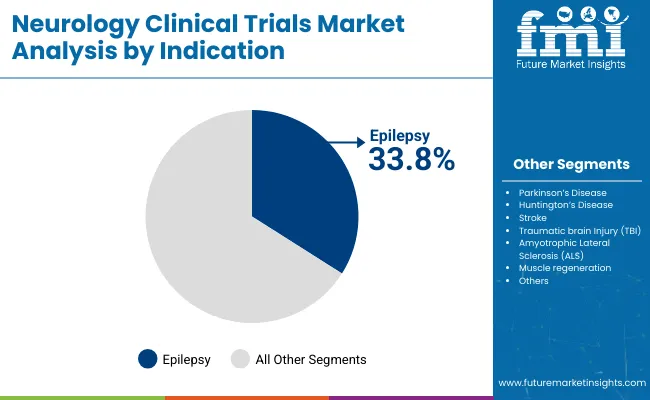
The epilepsy segment is projected to account for 33.80% of the total market revenue by 2025 under the application category, making it the leading indication. The high prevalence of drug resistant epilepsy and the need for more effective and personalized treatment options are key drivers behind this segment’s prominence.
Clinical trials targeting epilepsy benefit from clearly defined endpoints, robust patient registries, and high patient engagement, all of which contribute to efficient trial design and execution. Additionally, the ongoing development of novel anti epileptic drugs, neuromodulation therapies, and gene based interventions is expanding the scope of research activity in this field.
Supportive funding environments and advocacy group involvement have further increased trial enrollment and awareness. As innovation in epilepsy treatment continues to accelerate, this indication remains at the forefront of neurology clinical trials due to its significant unmet medical need and strong research momentum.
Future Market Insights reveals that Interventional study design led the market for neurology clinical trials. Market revenue through interventional study design grew at 5.6% CAGR from 2020 to 2024. While Huntington’s disease maintained the top Indication in neurology, clinical trials with a growth rate of 5.2% from 2020 to 2024.
The market is likely to grow due to an increase in global neurological disorders. This will drive the market for government spending and collaboration from pharmaceutical companies for the collaboration of new drugs and medication.
According to Lancet medical journal, total disability life adjusted years (DALYs) from, non-communicable neurological disorders like stroke, Alzheimer’s disease, dementia, Parkinson’s disease, and headache disorders increased in India and contributed 82.8% in 2020. Neurological disorders like stroke contributed to the highest share of deaths in India followed by Alzheimer’s.
Based on the study, changes in lifestyle habits were a substantial contributor to non-communicable diseases. For instance, high systolic blood pressure, air pollution, and dietary factor contributed to 55.3%, 42.2%, and 28.1% respectively strokes.
The requirement for neurology clinical trials is soaring, but several pharmaceutical companies are leaving the market due to the high cost of clinical trials across therapeutic areas and the high failure rates of clinical trials.
Based on the Tufts Center for the Study of Drug Development, CNS drugs take 18% more time to develop when compared to other drugs, and only 6% of drugs are finally approved out of clinical testing. These statistics are discouraging enough for pharmaceutical companies not to invest in neurological clinical trials.
In order to make the transition from Phase I to Phase II trial, companies require data packages to enhance upcoming investments. Few academic and market scientists refuse to share data resulting in a delay in clinical trials.
On the other hand, diagnosis of the central nervous system (CNS) is studied on the basis of symptoms, and signs, and the reasons are varied in different patients within existing diagnostic categories. This makes the identification of the problem difficult.
Moreover, animal models have not shown effective predictive validity and reproducibility. Animal models of CNS disorders are less understood and are not able to recreate the varied neurological human disorders on their model.
With the rise in neurological diseases, such as Alzheimer’s disease and Huntington's disease neuroscience remains a key domain for the majority of investments due to the high societal and monetary burden. Pharma and medical device companies have joined hands to offer better understanding and improved treatment.
Moreover, the unprecedented rise in neurological disorders has called for the government to support funding for neurology clinical trials.
Scientists at the University of Sheffield’s Neuroscience Institute and NIHR Sheffield Biomedical Research Centre received funding of USD 61 Million from the government to bring suitable treatment options for motor neuron disease (MillionD). The funding is expected to change the clinical trials in the coming years.
The government of Australia invested USD 21.8 Million for the treatment of varied neurological disorders. Around 10 research projects were earmarked in Australia for the treatment of Supranuclear palsy and attempts would be made to reduce fatigue in patients after a stroke.
Furthermore, the Clinical Trials Activity Initiative by the Australian Government aims to provide USD 6.8 Million over 10 years from 2025 to 23 to Australian researchers in order to increase clinical trials in the country.
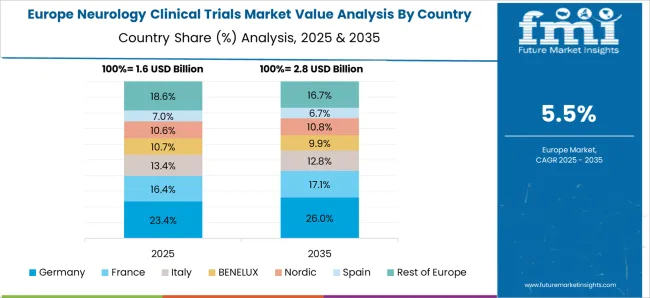
The total number of DALYs resulting from neurological disorders was 5 million in the European Union, in 2020 and 41.1 million in WHO European region. A substantial burden will likely catch the attention of neurological clinical trials in Europe.
Development in the healthcare system has extended life expectancy. An increase in the older population has also come up with the burden of non-communicable neurological diseases which is the main driver for spending in neurology clinical trials in Europe.
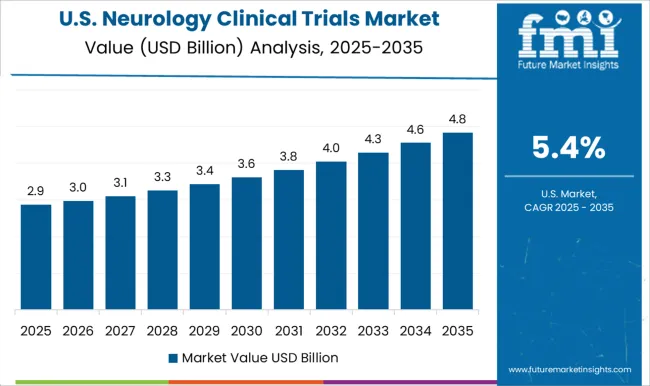
The market for neurology clinical trials in the USA is valued at USD 12.5 billion by 2035. Revenue through neurology clinical trials grew at 5.3% CAGR from 2020 to 2024. The USA contributes to a vast number of neurological patients which drives the need for expanding clinical trials. In 2024, 6.4 million Americans suffered from Alzheimer’s disease. This number is projected to triple to 14 million by 2060.
Companies like Biogen and IQVIA have continuously advanced in innovating new drugs and receiving FDA approvals for neurological disorders in America. Government agencies like the National Institute of Neurological Disorders and Stroke fund clinical trials and numerous research programs to reduce the burden of neurological disorders in the USA. The absolute dollar opportunity growth in the USA is expected to be at USD 6.8 billion during the forecasted period of 2025 to 2035.
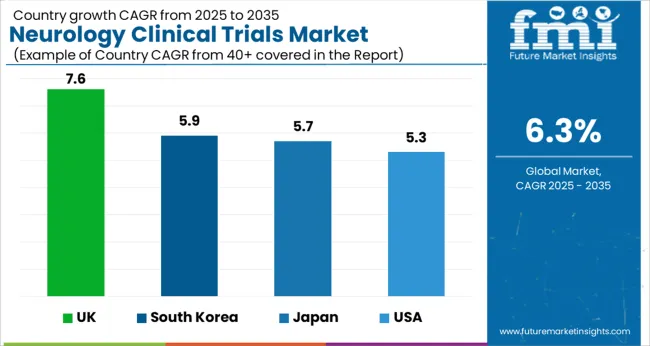
The market for neurology clinical trials in the United Kingdom was valued at USD 6.4 million in 2024. With an absolute dollar opportunity of USD 254 million, the market in the country is projected to reach a valuation of USD 493 million by 2035. From 2025 to 2035, the market in the United Kingdom is projected to grow at a CAGR of 7.6%.
neurology-clinical-trials-market-japan-market-share-analysis-by-phase
In Japan, the neurology clinical trials market in Japan was held at USD 179 million in 2024. By 2035, the market in Japan is expected to reach a valuation of USD 338 million. Growing at a CAGR of 5.7% from 2025 to 2035, the market in the country is likely to gross an absolute dollar opportunity of USD 145 million.
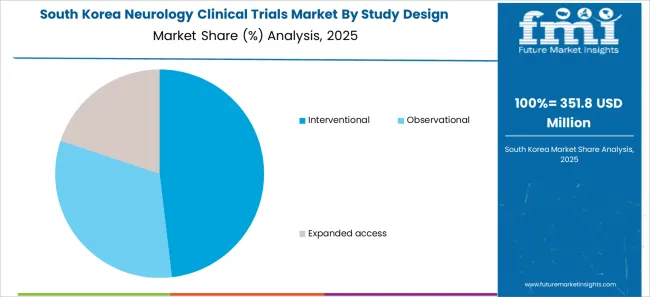
The neurology clinical trials market in South Korea is expected to be valued at USD 192 million by 2035. With a CAGR of 5.9%, the market in South Korea is expected to gross an absolute dollar opportunity of USD 84 million during the forecast period.
Interventional study design dominated the market for neurology clinical trials and accounted for a 5.6% CAGR from 2020 to 2024. It is expected to grow at a rate of 6.5% during the forecasted period.
The interventional study design is preferable in most clinical trials due to its safety and cost-effectiveness and acceptability of the Intervention. Interventional study design assists in gauging the direct impact on treatments or prevention of neurological diseases.
Health organizations and pharmaceutical companies are largely aiming at expanding their manufacturing facilities, investing in Research and Development (R&D), and inventing new drugs for the treatment of neurological disorders.
The key companies operating in the neurology clinical trials market include Novartis, Covance, Medpace, Charles River Laboratories, Syneous Health, Icon Plc, GlaxoSmithKline, Aurora Healthcare, Biogen, and IQVIA.
Some of the recent developments by key providers of neurology clinical trials are as follows:
Similarly, recent developments related to companies involved in Neurology Clinical Trials have been tracked by the team at Future Market Insights, which is available in the full report.
The global neurology clinical trials market is estimated to be valued at USD 6.8 billion in 2025.
The market size for the neurology clinical trials market is projected to reach USD 12.5 billion by 2035.
The neurology clinical trials market is expected to grow at a 6.3% CAGR between 2025 and 2035.
The key product types in neurology clinical trials market are phase i, phase ii, phase iii and phase iv.
In terms of study design, interventional segment to command 47.2% share in the neurology clinical trials market in 2025.


Our Research Products

The "Full Research Suite" delivers actionable market intel, deep dives on markets or technologies, so clients act faster, cut risk, and unlock growth.

The Leaderboard benchmarks and ranks top vendors, classifying them as Established Leaders, Leading Challengers, or Disruptors & Challengers.

Locates where complements amplify value and substitutes erode it, forecasting net impact by horizon

We deliver granular, decision-grade intel: market sizing, 5-year forecasts, pricing, adoption, usage, revenue, and operational KPIs—plus competitor tracking, regulation, and value chains—across 60 countries broadly.

Spot the shifts before they hit your P&L. We track inflection points, adoption curves, pricing moves, and ecosystem plays to show where demand is heading, why it is changing, and what to do next across high-growth markets and disruptive tech

Real-time reads of user behavior. We track shifting priorities, perceptions of today’s and next-gen services, and provider experience, then pace how fast tech moves from trial to adoption, blending buyer, consumer, and channel inputs with social signals (#WhySwitch, #UX).

Partner with our analyst team to build a custom report designed around your business priorities. From analysing market trends to assessing competitors or crafting bespoke datasets, we tailor insights to your needs.
Supplier Intelligence
Discovery & Profiling
Capacity & Footprint
Performance & Risk
Compliance & Governance
Commercial Readiness
Who Supplies Whom
Scorecards & Shortlists
Playbooks & Docs
Category Intelligence
Definition & Scope
Demand & Use Cases
Cost Drivers
Market Structure
Supply Chain Map
Trade & Policy
Operating Norms
Deliverables
Buyer Intelligence
Account Basics
Spend & Scope
Procurement Model
Vendor Requirements
Terms & Policies
Entry Strategy
Pain Points & Triggers
Outputs
Pricing Analysis
Benchmarks
Trends
Should-Cost
Indexation
Landed Cost
Commercial Terms
Deliverables
Brand Analysis
Positioning & Value Prop
Share & Presence
Customer Evidence
Go-to-Market
Digital & Reputation
Compliance & Trust
KPIs & Gaps
Outputs
Full Research Suite comprises of:
Market outlook & trends analysis
Interviews & case studies
Strategic recommendations
Vendor profiles & capabilities analysis
5-year forecasts
8 regions and 60+ country-level data splits
Market segment data splits
12 months of continuous data updates
DELIVERED AS:
PDF EXCEL ONLINE
Neurology Services Market Overview - Growth & Forecast 2025 to 2035
Neurology Digital Therapeutics Market Growth – Trends & Forecast 2024-2034
Clinical Trial Data Management Service Market Size and Share Forecast Outlook 2025 to 2035
Clinical Trial Biorepository & Archiving Solution Market Size and Share Forecast Outlook 2025 to 2035
Clinical Chairs Market Size and Share Forecast Outlook 2025 to 2035
Clinical Avian Nutrition Market Analysis - Size, Share, and Forecast Outlook 2025 to 2035
Clinical Workflow Solution Market Size and Share Forecast Outlook 2025 to 2035
Clinical Research Organization Market Size and Share Forecast Outlook 2025 to 2035
Clinical Trial Packaging Market Size and Share Forecast Outlook 2025 to 2035
Clinical Mobility Market Size and Share Forecast Outlook 2025 to 2035
Clinical Immunodiagnostics Market Size and Share Forecast Outlook 2025 to 2035
Clinical Communication and Collaboration Market Size and Share Forecast Outlook 2025 to 2035
Clinical Oncology Next-generation Sequencing Market Analysis - Size, Share, and Forecast 2025 to 2035
Clinical Decision Support Systems Market Size and Share Forecast Outlook 2025 to 2035
Clinical Refractometer Market Size and Share Forecast Outlook 2025 to 2035
Clinical Next-Generation Sequencing (NGS) Data Analysis Market Analysis by Solution and Services, Technology, End User, and Region through 2035
Clinical Hand Hygiene Products Market – Trends, Growth & Forecast 2025 to 2035
The Clinical Alarm Management Market is segmented by component, deployment mode and end user from 2025 to 2035
Clinical Nutrition Market Insights – Trends & Forecast 2025 to 2035
Clinical Diagnostics Market Insights – Size, Share & Forecast 2025 to 2035

Thank you!
You will receive an email from our Business Development Manager. Please be sure to check your SPAM/JUNK folder too.
Chat With
MaRIA