Recoilless Disruptor Market Analysis - Size, Share, and Forecast Outlook 2025 to 2035

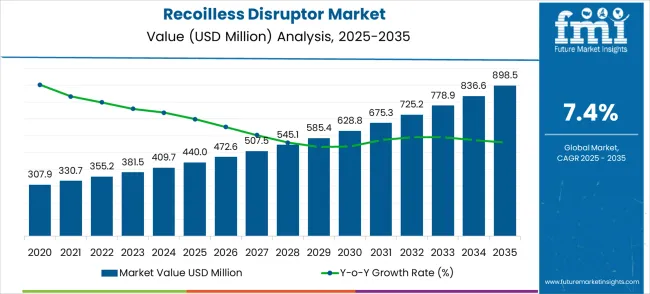
The global recoilless disruptor market is likely to grow from USD 440.0 million in 2025 to approximately USD 898.5 million by 2035, recording an absolute increase of USD 458.5 million over the forecast period. This translates into a total growth of 104.2%, with the market forecast to expand at a compound annual growth rate (CAGR) of 7.4% between 2025 and 2035. The overall market size is expected to grow by nearly 2.04X during the same period, supported by increasing global security threats, growing demand for advanced explosive ordnance disposal equipment, and rising requirements for precise bomb disposal technologies across diverse military, law enforcement, and security applications in the global defense and security industries.
Quick Stats for Recoilless Disruptor Market

  • Recoilless Disruptor Market Value (2025): USD 440.0 million
  • Recoilless Disruptor Market Forecast Value (2035): USD 898.5 million
  • Recoilless Disruptor Market Forecast CAGR: 7.4%
  • Leading Disruptor Diameter: Diameter 0-20mm
  • Key Growth Regions in Recoilless Disruptor Market: Asia Pacific, North America, and Europe
  • Top Key Players in Recoilless Disruptor Market: FFI Tactical, ABP Technologies, ELP, DSE International, EPE, Sarkar Tactical, NIC Instruments, Chemring Technology, Richmond Defense Systems, Al Efah Technologies

Recoilless Disruptor Market Value Analysis

Between 2025 and 2030, the recoilless disruptor market is projected to expand from USD 440.0 million to USD 585.4 million, resulting in a value increase of USD 145.4 million, which represents 31.7% of the total forecast growth for the decade. This phase of development will be shaped by increasing global security concerns, rising adoption of advanced explosive ordnance disposal technologies in military operations, and growing utilization in counter-terrorism activities, bomb squad operations, and security force applications. Defense equipment manufacturers and security technology companies are expanding their disruptor capabilities to address the growing preference for precise and safe explosive neutralization solutions in modern security operations.

Recoilless Disruptor Market Key Takeaways

Metric Value
Estimated Value in (2025E) USD 440.0 million
Forecast Value in (2035F) USD 898.5 million
Forecast CAGR (2025 to 2035) 7.4%

The recoilless disruptor market is segmented into defense and military applications (45%), law enforcement and bomb disposal units (28%), counter-terrorism and homeland security (15%), critical infrastructure protection (7%), and specialized research or training applications (5%). Defense and military adoption dominates due to the need for safe, high-impact solutions to neutralize explosives and hazardous devices. Law enforcement and bomb disposal units rely on disruptors for rapid threat mitigation in urban environments. Counter-terrorism and homeland security operations deploy them for tactical scenarios and protective measures. Critical infrastructure, including airports, power plants, and government buildings, uses recoilless disruptors to safeguard against explosive threats. Specialized research and training applications focus on testing and personnel preparedness.

Key trends include lightweight materials, modular designs, and improved accuracy in threat neutralization. Manufacturers are innovating with enhanced recoil control, portable systems, and remote operation capabilities. Adoption is expanding in military modernization programs, urban security initiatives, and bomb disposal operations. Collaborations between equipment providers and defense or security agencies enable customized, reliable, and high-performance solutions, driving global market growth.

Opportunity Pathways - Recoilless Disruptor Market

The recoilless disruptor market presents significant growth opportunities as global security threats intensify and counter-terrorism capabilities become increasingly critical for military and law enforcement agencies worldwide. With the market projected to expand from USD 440.0 million in 2025 to USD 898.5 million by 2035 at a 7.4% CAGR, defense contractors and security technology providers are positioned to capitalize on rising defense spending, evolving explosive threats, and the imperative for precision explosive ordnance disposal capabilities across diverse operational environments.

The convergence of asymmetric warfare challenges, urban security requirements, and technological advancement in targeting systems creates sustained market expansion opportunities. Geographic growth differentials are particularly pronounced in China (10.0% CAGR) and India (9.3% CAGR), where defense modernization programs and increasing security concerns drive substantial procurement. Technology advancement pathways around precision guidance, enhanced safety features, and specialized threat response offer differentiation opportunities, while diameter 0-20mm systems dominate current demand due to operational versatility.

Military use applications lead market revenue, indicating established foundations for battlefield and security operations, while police use represents expanding civilian security applications. Counter-terrorism requirements and critical infrastructure protection drive sustained procurement, while operator safety and precision targeting demands fuel technological advancement across threat neutralization scenarios.

  • Pathway A - Advanced Targeting & Precision Guidance Systems. Integration of laser targeting, ballistic computers, and precision guidance technologies transforms basic disruptors into intelligent threat neutralization platforms. Companies developing systems with enhanced accuracy, standoff capabilities, and automated targeting features capture premium military and security contracts while improving operator safety and mission effectiveness. Expected revenue pool: USD 180-280 million.
  • Pathway B - Geographic Expansion in High-Growth Defense Markets. China's 10.0% CAGR and India's 9.3% growth present substantial opportunities through defense cooperation agreements, technology transfer partnerships, and local manufacturing initiatives. Regional expansion strategies capturing Asia-Pacific defense modernization and counter-terrorism capability development offer volume growth and strategic market positioning. Revenue opportunity: USD 150-240 million.
  • Pathway C - Counter-Terrorism & Urban Security Specialization. Development of specialized disruptor solutions for urban environments, critical infrastructure protection, and sophisticated improvised explosive device threats enables premium positioning in high-stakes security applications. Enhanced capabilities for confined spaces, precision targeting, and minimal collateral damage command higher margins while addressing evolving threat landscapes. Expected pool: USD 120-190 million.
  • Pathway D - Enhanced Safety & Operator Protection Features. Advancing beyond basic disruptor functionality toward comprehensive operator safety systems with remote operation capabilities, enhanced blast protection, and automated threat assessment. Premium positioning through superior safety features, reduced operator exposure, and enhanced operational confidence enables differentiation in safety-conscious security markets. Revenue potential: USD 100-160 million.
  • Pathway E - Police & Civilian Security Market Expansion. Expanding military-grade disruptor technology toward police bomb squads, airport security, and civilian security applications requires specialized products meeting different operational requirements and regulatory standards. Adaptation of military technology for civilian use creates new market segments with distinct procurement patterns and regulatory compliance needs. Pool: USD 80-130 million.
  • Pathway F - Modular & Scalable System Platforms. The development of modular disruptor systems enabling diameter flexibility, projectile customization, and application-specific configuration creates operational versatility and customer value. Scalable platforms serving multiple threat scenarios and operational requirements enable broader market penetration and recurring component sales. Expected opportunity: USD 70-110 million.
  • Pathway G - Training & Service Excellence Programs. Comprehensive training services, technical support, and operational consultation create competitive advantages while strengthening customer relationships. Specialized operator training programs, maintenance services, and tactical consultation support global deployment scaling and premium service positioning in mission-critical security applications. Revenue pool: USD 50-80 million.

Why is the Recoilless Disruptor Market Growing?

Market expansion is being supported by the increasing global security threats and terrorism concerns, and the corresponding shift toward advanced explosive ordnance disposal technologies that can provide superior precision and safety while meeting operational requirements for effective threat neutralization. Modern military forces and law enforcement agencies are increasingly focused on incorporating advanced disruptor systems to enhance operational capabilities while satisfying demands for operator safety, precision targeting, and reliable threat neutralization. Recoilless disruptor technology's proven ability to deliver superior accuracy, operational flexibility, and enhanced safety margins makes it an essential tool for explosive ordnance disposal, counter-terrorism operations, and security force applications.

The growing focus on urban security and critical infrastructure protection is driving demand for high-quality disruptor systems that can support rapid response capabilities and maintain superior operational effectiveness across airport security, government facility protection, and public event security applications. Security forces' preference for equipment that combines precision targeting with operational safety is creating opportunities for innovative disruptor implementations in both traditional military and emerging civilian security applications. The rising influence of asymmetric warfare and sophisticated explosive threats is also contributing to increased adoption of advanced disruptor systems that can provide reliable performance against evolving security challenges.

Analyzing Recoilless Disruptor Market by Leading Segments

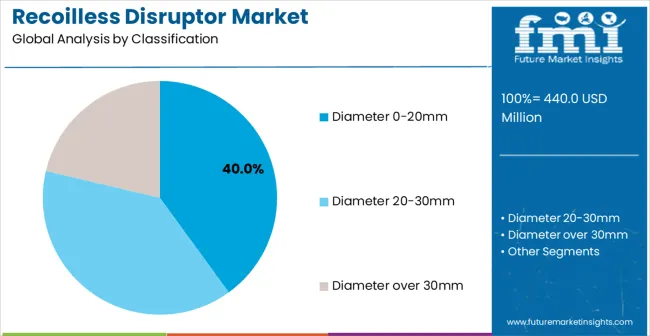
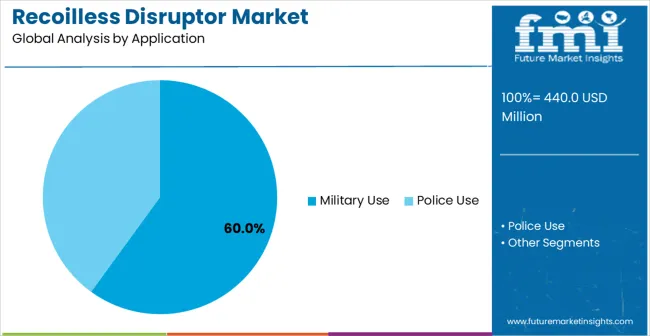
The recoilless disruptor market is expanding with increasing adoption in defense and security operations. Disruptors with diameters of 20–30 mm dominate the segment, accounting for approximately 50% of the market share, offering optimal balance between portability, projectile velocity (up to 90 m/s), and target neutralization effectiveness. In terms of application, military use leads with about 60% of the market, reflecting demand for rapid, accurate, and safe explosive ordinance disposal and breaching operations. Growth is driven by rising defense budgets, modernization of military equipment, and the need for lightweight, high-performance disruptors suitable for tactical operations.
20-30 mm Disruptors Lead Demand in 2025

Recoilless Disruptor Market Analysis By Classification

Disruptors with diameters of 20–30 mm account for approximately 50% of the market, making them the most widely adopted size. These devices provide projectile velocities of 80–90 m/s and can neutralize explosive devices from distances up to 10 meters. Key manufacturers include Chemring, L3Harris, NAMMO, and Med-Eng. This size range balances portability for field operators with sufficient kinetic impact to safely disable explosive threats. Their compact design allows rapid deployment in urban and tactical environments, making them the preferred choice for EOD teams.
  • Projectile velocities of 80–90 m/s with effective neutralization range up to 10 m
  • Compact and lightweight for rapid field deployment
  • Balances portability with operational effectiveness for tactical missions

Military Applications Likely to Dominate Recoilless Disruptor Market in 2025

Recoilless Disruptor Market Analysis By Application

Military use accounts for approximately 60% of the application segment, making it the largest market for recoilless disruptors. These devices are deployed in explosive ordinance disposal, tactical breaching, and urban combat operations. Leading suppliers such as Chemring, L3Harris, NAMMO, and Med-Eng provide models optimized for precision, safety, and portability under extreme conditions. Segment growth is fueled by modernization of military EOD units, increasing global defense spending, and the rising need for lightweight, effective tools for counter-IED and tactical operations.

  • Used for explosive ordinance disposal, tactical breaching, and urban combat
  • Designed for portability and precision under extreme field conditions
  • Growth driven by defense modernization and increasing EOD operations

What are the Drivers, Restraints, and Key Trends of the Recoilless Disruptor Market?

The recoilless disruptor market is advancing steadily due to increasing global security threats and growing demand for advanced explosive ordnance disposal technologies that focus on precision and safety across military operations, counter-terrorism activities, and law enforcement applications. The market faces challenges, including stringent regulatory requirements for defense equipment, high development costs for advanced systems, and the specialized nature of operator training requirements. Innovation in targeting systems and precision technologies continues to influence market development and expansion patterns.

Expansion of Counter-Terrorism and Urban Security Applications

The growing adoption of recoilless disruptors in counter-terrorism operations and urban security applications is enabling security forces to achieve precise threat neutralization that provides enhanced operational safety while supporting rapid response capabilities and effective threat management. Counter-terrorism applications provide exceptional precision requirements while allowing more sophisticated threat assessment across various urban environments and security scenarios. Security agencies are increasingly recognizing the competitive advantages of advanced disruptor technology for homeland security operations and critical infrastructure protection.

Integration of Advanced Targeting and Precision Guidance Systems

Modern recoilless disruptor manufacturers are incorporating laser targeting systems, ballistic computers, and precision guidance technologies to enhance accuracy, improve operational effectiveness, and meet demands for reliable threat neutralization in complex operational environments. These technologies improve targeting precision while enabling new applications, including standoff operations and enhanced operator safety protocols. Advanced system integration also allows manufacturers to support premium market positioning and operational excellence beyond traditional explosive ordnance disposal equipment.
Analysis of the Recoilless Disruptor Market by Key Country

Recoilless Disruptor Market Cagr Analysis By Country

Country CAGR (2025-2035)
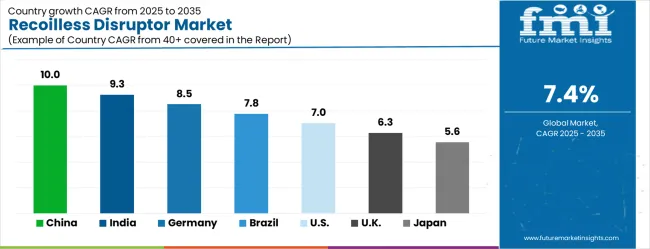
China 10.0%
India 9.3%
Germany 8.5%
Brazil 7.8%
USA 7.0%
UK 6.3%
Japan 5.6%

The recoilless disruptor market is experiencing robust growth globally, with China leading at a 10.0% CAGR through 2035, driven by increasing defense spending, growing security concerns, and rising investment in advanced military technologies and counter-terrorism capabilities. India follows at 9.3%, supported by expanding defense modernization programs, increasing security threats, and growing demand for sophisticated explosive ordnance disposal equipment.

Germany shows growth at 8.5%, prioritizing precision engineering excellence and defense technology export development. Brazil records 7.8%, focusing on internal security enhancement and counter-terrorism capability development. The USA demonstrates 7.0% growth, prioritizing homeland security and military operational effectiveness. The UK exhibits 6.3% growth, supported by its established defense technology heritage and security force modernization. Japan shows 5.6% growth, prioritizing technological innovation and security infrastructure enhancement.

The report covers an in-depth analysis of 40+ countries, Top-performing countries are highlighted below.

China Leads Global Market Growth with Defense Modernization

The recoilless disruptors market in China is projected to exhibit exceptional growth with a CAGR of 10.0% through 2035, driven by rapidly expanding defense spending and increasing focus on modernizing military explosive ordnance disposal capabilities across People's Liberation Army units and specialized security forces. The country's growing focus on counter-terrorism preparedness and border security is creating substantial demand for advanced disruptor systems in both military and security applications. Major defense manufacturers and technology companies are establishing comprehensive development and production capabilities to serve both domestic security requirements and export markets.

  • Rising defense modernization programs and expanding security force capabilities are driving demand for recoilless disruptors across military units, security forces, and specialized counter-terrorism teams throughout major Chinese military regions and urban security centers.
  • Strong government investment in security technologies and growing focus on counter-terrorism capabilities are supporting the rapid adoption of advanced disruptor systems among security agencies seeking to enhance operational effectiveness and personnel safety.

India Demonstrates Strong Market Potential with Security Enhancement Impact

The recoilless disruptors market in India is expanding at a CAGR of 9.3%, supported by comprehensive defense modernization programs, increasing security threats along borders and in urban areas, and growing investment in advanced explosive ordnance disposal technologies across military and paramilitary forces. The country's expanding security infrastructure and rising counter-terrorism requirements are driving demand for sophisticated disruptor solutions across both military and civilian security applications. International defense companies and domestic manufacturers are establishing comprehensive production and service capabilities to address growing market demand for advanced security equipment.

  • Rising security threats and expanding defense modernization initiatives are creating opportunities for recoilless disruptor adoption across military explosive ordnance disposal units, paramilitary forces, and specialized security teams in major Indian cities and border regions.
  • Growing government focus on internal security and counter-terrorism preparedness is driving adoption of advanced disruptor technologies among security agencies seeking to enhance threat neutralization capabilities and operational safety standards.

Germany Maintains Strong Position with Defense Technology Excellence

The recoilless disruptors market in Germany is projected to grow at a CAGR of 8.5% through 2035, driven by the country's leadership in defense technology development, precision engineering excellence, and strong export capabilities in military and security equipment markets. Germany's sophisticated defense industry and commitment to technological innovation are creating substantial demand for high-precision disruptor systems across both domestic security forces and international export applications. Leading defense manufacturers and technology suppliers are establishing comprehensive development strategies to serve both German security requirements and European export markets.

  • Rising defense technology innovation and precision engineering excellence are driving demand for recoilless disruptors across German security forces, defense contractors, and equipment exporters seeking to maintain Germany's reputation for superior defense technology and engineering quality.
  • Strong engineering expertise and export market development are supporting the adoption of advanced disruptor systems among manufacturers and security agencies seeking to differentiate their capabilities and maintain competitive advantages in international defense markets.

Brazil Strengthens Market with Security Infrastructure Development

Demand of recoilless disruptors in Brazil is projected to grow at a CAGR of 7.8% through 2035, supported by the country's expanding internal security requirements, growing counter-terrorism capabilities, and increasing investment in specialized security equipment for major events and urban security operations. Brazilian security forces are increasingly adopting advanced disruptor technologies to enhance threat response capabilities and improve operational safety standards. The country's strategic security challenges continue to drive innovation in explosive ordnance disposal applications and equipment adoption.
  • Strong internal security development and counter-terrorism capability expansion are driving demand for recoilless disruptors across military police units, federal security forces, and specialized counter-terrorism teams seeking to enhance operational effectiveness in urban environments.
  • Growing focus on major event security and urban threat response is supporting the adoption of advanced disruptor technologies among security agencies seeking to improve threat neutralization capabilities and operational safety protocols.

USA Anchors Growth with Homeland Security Leadership

Recoilless Disruptor Market Country Value Analysis

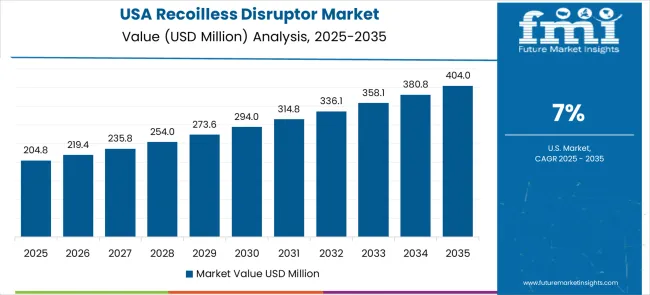
The recoilless disruptors industry in the United States is projected to grow at a CAGR of 7.0% through 2035, supported by the country's comprehensive homeland security infrastructure, advanced military operational requirements, and leadership in defense technology development and security equipment innovation. American military and security forces prioritize operational effectiveness, safety, and technological advancement, making advanced disruptor systems essential equipment for both military operations and domestic security applications. The country's extensive defense research and development capabilities support continued market development and technology advancement.

  • Advanced homeland security capabilities and military operational excellence are driving demand for sophisticated disruptor systems across military explosive ordnance disposal units, federal security agencies, and specialized counter-terrorism teams serving both domestic and international missions.
  • Strong focus on operational safety and technological innovation is encouraging security agencies to adopt advanced disruptor technologies that support superior threat neutralization capabilities and maintain competitive advantages in defense and security operations.

United Kingdom Demonstrates Stable Growth with Defense Heritage

The recoilless disruptors market in the United Kingdom is projected to grow at a CAGR of 6.3% through 2035, supported by the country's established defense technology heritage, comprehensive security force capabilities, and traditional leadership in military equipment development and explosive ordnance disposal expertise. UK security forces' focus on operational excellence and safety creates steady demand for advanced disruptor systems across both military and civilian security applications. The country's expertise in defense technology drives consistent adoption of precision security equipment.
  • Defense technology heritage and security force excellence are driving steady demand for recoilless disruptors across military units, police specialist teams, and security contractors seeking to maintain the UK's reputation for superior security capabilities and operational effectiveness.
  • Strong focus on operational safety and defense innovation is supporting the adoption of advanced disruptor systems among security professionals and defense contractors serving both domestic security requirements and international export markets.

Japan Focuses on Technological Innovation and Security Enhancement

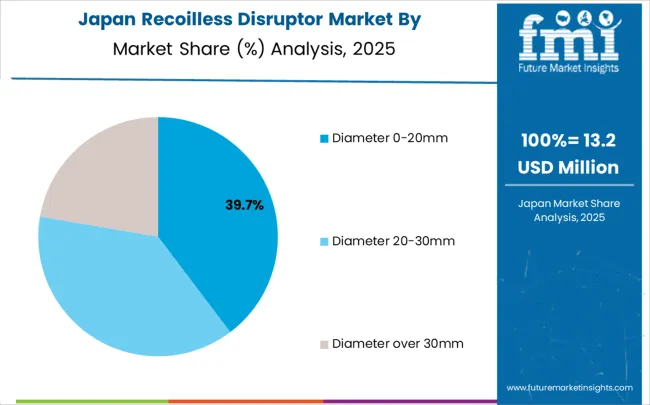
Recoilless Disruptor Market Japan Market Share Analysis By Classification

The demand of recoilless disruptors in Japan is projected to grow at a CAGR of 5.6% through 2035, supported by the country's commitment to technological innovation, growing security infrastructure requirements, and focus on advanced defense technology development and precision engineering capabilities. Japan's security sector continues to prioritize innovation and technological excellence while working to enhance security capabilities through advanced equipment development and precision manufacturing expertise.
  • Technological innovation focus and security enhancement initiatives are driving the development of advanced disruptor solutions that improve operational capabilities while supporting Japan's reputation for technological excellence and precision manufacturing leadership.
  • Strong technology development heritage and security infrastructure modernization are supporting the development of specialized disruptor applications among manufacturers and security agencies seeking to maintain competitive advantages through superior technology integration and innovative design features.

Europe Market Split by Country

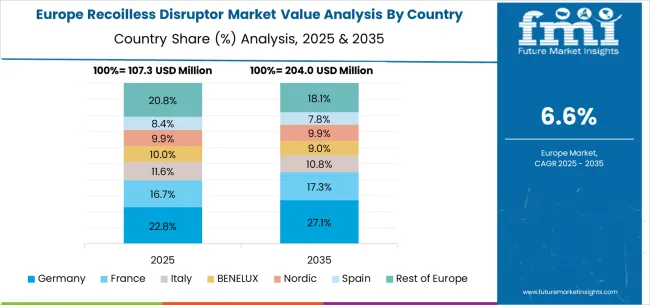
Recoilless Disruptor Market Europe Country Market Share Analysis, 2025 & 2035

The recoilless disruptor market in Europe is projected to grow from USD 158.7 million in 2025 to USD 324.1 million by 2035, registering a CAGR of 7.4% over the forecast period. Germany is expected to maintain its leadership position with a 31.2% market share in 2025, declining slightly to 30.7% by 2035, supported by its advanced defense technology sector, precision engineering excellence, and comprehensive export capabilities serving European and international security markets.

The United Kingdom follows with a 24.8% share in 2025, projected to reach 24.5% by 2035, driven by established defense technology heritage, comprehensive security force capabilities, and strong military equipment development traditions. France holds a 19.4% share in 2025, expected to maintain 19.6% by 2035, supported by a strong defense industry and growing investment in counter-terrorism technologies. Italy commands a 12.1% share in 2025, projected to reach 12.4% by 2035, while Spain accounts for 7.3% in 2025, expected to reach 7.6% by 2035.

The Netherlands maintains a 2.1% share in 2025, growing to 2.2% by 2035. The Rest of Europe region, including Nordic countries, Eastern Europe, Belgium, Switzerland, and Austria, is anticipated to hold 3.1% in 2025, growing to 3.0% by 2035, attributed to mixed growth patterns with increasing adoption of advanced security technologies in some Eastern European markets balanced by specialized market requirements in smaller Western European countries implementing security modernization programs.
Competitive Landscape of the Recoilless Disruptor Market

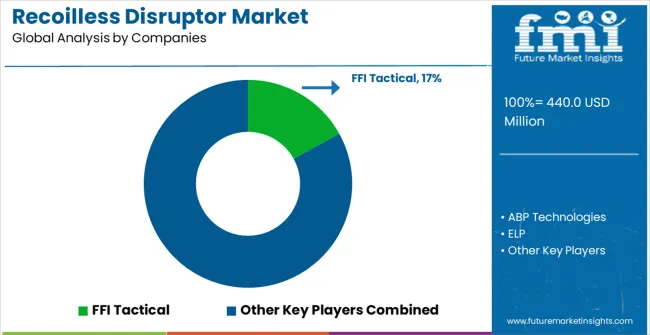
Recoilless Disruptor Market Analysis By Company

The recoilless disruptor market is characterized by competition among specialized defense equipment manufacturers, advanced security technology providers, and integrated military systems suppliers. Companies are investing in precision targeting technologies, advanced projectile design, safety enhancement systems, and comprehensive training programs to deliver consistent, high-performance, and operationally reliable disruptor solutions. Innovation in guidance systems, targeting accuracy, and operator safety features is central to strengthening market position and operational effectiveness.

FFI Tactical leads the market with a strong focus on tactical equipment innovation and comprehensive explosive ordnance disposal solutions, offering advanced disruptor systems with focus on precision targeting and operational safety. ABP Technologies provides specialized defense equipment capabilities with a focus on precision engineering and military application expertise. ELP delivers advanced security technology solutions with a focus on operational effectiveness and safety enhancement. DSE International specializes in defense and security equipment with prioritizing on international market development and technical excellence. EPE focuses on explosive ordnance disposal equipment with prioritizing on precision targeting and operational reliability. Sarkar Tactical prioritizing on tactical security solutions with a focus on specialized applications and technical support.

Key Players in the Recoilless Disruptor Market

  • FFI Tactical
  • ABP Technologies
  • ELP
  • DSE International
  • EPE
  • Sarkar Tactical
  • NIC Instruments
  • Chemring Technology
  • Richmond Defense Systems
  • Al Efah Technologies

Scope of the Report

Items Values
Quantitative Units (2025) USD 440.0 million
Disruptor Diameter Diameter 0-20mm, Diameter 20-30mm, Diameter over 30mm
Application Military Use, Police Use
Regions Covered North America, Europe, Asia Pacific, Latin America, Middle East & Africa
Countries Covered United States, Canada, United Kingdom, Germany, France, China, Japan, South Korea, India, Brazil, Australia and 40+ countries
Key Companies Profiled FFI Tactical, ABP Technologies, ELP, DSE International, EPE, Sarkar Tactical, NIC Instruments, Chemring Technology, Richmond Defense Systems, and Al Efah Technologies
Additional Attributes Dollar sales by disruptor diameter and application, regional demand trends, competitive landscape, technological advancements in targeting systems, precision enhancement programs, safety improvement initiatives, and specialized security application strategies

Recoilless Disruptor Market by Segments

Disruptor Diameter:

  • Diameter 0-20mm
  • Diameter 20-30mm
  • Diameter over 30mm

Application:

  • Military Use
  • Police Use

Region:

North America

  • United States
  • Canada
  • Mexico

Europe

  • Germany
  • United Kingdom
  • France
  • Italy
  • Spain
  • Nordic
  • BENELUX
  • Rest of Europe

Asia Pacific

  • China
  • Japan
  • South Korea
  • India
  • ASEAN
  • Australia & New Zealand
  • Rest of Asia Pacific

Latin America

  • Brazil
  • Chile
  • Rest of Latin America

Middle East & Africa

  • Kingdom of Saudi Arabia
  • Other GCC Countries
  • Turkey
  • South Africa
  • Other African Union
  • Rest of Middle East & Africa

Frequently Asked Questions

How big is the recoilless disruptor market in 2025?

The global recoilless disruptor market is estimated to be valued at USD 440.0 million in 2025.

What will be the size of recoilless disruptor market in 2035?

The market size for the recoilless disruptor market is projected to reach USD 898.5 million by 2035.

How much will be the recoilless disruptor market growth between 2025 and 2035?

The recoilless disruptor market is expected to grow at a 7.4% CAGR between 2025 and 2035.

What are the key product types in the recoilless disruptor market?

The key product types in recoilless disruptor market are diameter 0-20mm, diameter 20-30mm and diameter over 30mm.

Which application segment to contribute significant share in the recoilless disruptor market in 2025?

In terms of application, military use segment to command 60.0% share in the recoilless disruptor market in 2025.

Table of Content

  1. Executive Summary
    • Global Market Outlook
    • Demand to side Trends
    • Supply to side Trends
    • Technology Roadmap Analysis
    • Analysis and Recommendations
  2. Market Overview
    • Market Coverage / Taxonomy
    • Market Definition / Scope / Limitations
  3. Market Background
    • Market Dynamics
      • Drivers
      • Restraints
      • Opportunity
      • Trends
    • Scenario Forecast
      • Demand in Optimistic Scenario
      • Demand in Likely Scenario
      • Demand in Conservative Scenario
    • Opportunity Map Analysis
    • Product Life Cycle Analysis
    • Supply Chain Analysis
    • Investment Feasibility Matrix
    • Value Chain Analysis
    • PESTLE and Porter’s Analysis
    • Regulatory Landscape
    • Regional Parent Market Outlook
    • Production and Consumption Statistics
    • Import and Export Statistics
  4. Global Market Analysis 2020 to 2024 and Forecast, 2025 to 2035
    • Historical Market Size Value (USD Million) Analysis, 2020 to 2024
    • Current and Future Market Size Value (USD Million) Projections, 2025 to 2035
      • Y to o to Y Growth Trend Analysis
      • Absolute $ Opportunity Analysis
  5. Global Market Pricing Analysis 2020 to 2024 and Forecast 2025 to 2035
  6. Global Market Analysis 2020 to 2024 and Forecast 2025 to 2035, By Classification
    • Introduction / Key Findings
    • Historical Market Size Value (USD Million) Analysis By Classification , 2020 to 2024
    • Current and Future Market Size Value (USD Million) Analysis and Forecast By Classification , 2025 to 2035
      • Diameter 0-20mm
      • Diameter 20-30mm
      • Diameter over 30mm
    • Y to o to Y Growth Trend Analysis By Classification , 2020 to 2024
    • Absolute $ Opportunity Analysis By Classification , 2025 to 2035
  7. Global Market Analysis 2020 to 2024 and Forecast 2025 to 2035, By Application
    • Introduction / Key Findings
    • Historical Market Size Value (USD Million) Analysis By Application, 2020 to 2024
    • Current and Future Market Size Value (USD Million) Analysis and Forecast By Application, 2025 to 2035
      • Military Use
      • Police Use
    • Y to o to Y Growth Trend Analysis By Application, 2020 to 2024
    • Absolute $ Opportunity Analysis By Application, 2025 to 2035
  8. Global Market Analysis 2020 to 2024 and Forecast 2025 to 2035, By Region
    • Introduction
    • Historical Market Size Value (USD Million) Analysis By Region, 2020 to 2024
    • Current Market Size Value (USD Million) Analysis and Forecast By Region, 2025 to 2035
      • North America
      • Latin America
      • Western Europe
      • Eastern Europe
      • East Asia
      • South Asia and Pacific
      • Middle East & Africa
    • Market Attractiveness Analysis By Region
  9. North America Market Analysis 2020 to 2024 and Forecast 2025 to 2035, By Country
    • Historical Market Size Value (USD Million) Trend Analysis By Market Taxonomy, 2020 to 2024
    • Market Size Value (USD Million) Forecast By Market Taxonomy, 2025 to 2035
      • By Country
        • USA
        • Canada
        • Mexico
      • By Classification
      • By Application
    • Market Attractiveness Analysis
      • By Country
      • By Classification
      • By Application
    • Key Takeaways
  10. Latin America Market Analysis 2020 to 2024 and Forecast 2025 to 2035, By Country
    • Historical Market Size Value (USD Million) Trend Analysis By Market Taxonomy, 2020 to 2024
    • Market Size Value (USD Million) Forecast By Market Taxonomy, 2025 to 2035
      • By Country
        • Brazil
        • Chile
        • Rest of Latin America
      • By Classification
      • By Application
    • Market Attractiveness Analysis
      • By Country
      • By Classification
      • By Application
    • Key Takeaways
  11. Western Europe Market Analysis 2020 to 2024 and Forecast 2025 to 2035, By Country
    • Historical Market Size Value (USD Million) Trend Analysis By Market Taxonomy, 2020 to 2024
    • Market Size Value (USD Million) Forecast By Market Taxonomy, 2025 to 2035
      • By Country
        • Germany
        • UK
        • Italy
        • Spain
        • France
        • Nordic
        • BENELUX
        • Rest of Western Europe
      • By Classification
      • By Application
    • Market Attractiveness Analysis
      • By Country
      • By Classification
      • By Application
    • Key Takeaways
  12. Eastern Europe Market Analysis 2020 to 2024 and Forecast 2025 to 2035, By Country
    • Historical Market Size Value (USD Million) Trend Analysis By Market Taxonomy, 2020 to 2024
    • Market Size Value (USD Million) Forecast By Market Taxonomy, 2025 to 2035
      • By Country
        • Russia
        • Poland
        • Hungary
        • Balkan & Baltic
        • Rest of Eastern Europe
      • By Classification
      • By Application
    • Market Attractiveness Analysis
      • By Country
      • By Classification
      • By Application
    • Key Takeaways
  13. East Asia Market Analysis 2020 to 2024 and Forecast 2025 to 2035, By Country
    • Historical Market Size Value (USD Million) Trend Analysis By Market Taxonomy, 2020 to 2024
    • Market Size Value (USD Million) Forecast By Market Taxonomy, 2025 to 2035
      • By Country
        • China
        • Japan
        • South Korea
      • By Classification
      • By Application
    • Market Attractiveness Analysis
      • By Country
      • By Classification
      • By Application
    • Key Takeaways
  14. South Asia and Pacific Market Analysis 2020 to 2024 and Forecast 2025 to 2035, By Country
    • Historical Market Size Value (USD Million) Trend Analysis By Market Taxonomy, 2020 to 2024
    • Market Size Value (USD Million) Forecast By Market Taxonomy, 2025 to 2035
      • By Country
        • India
        • ASEAN
        • Australia & New Zealand
        • Rest of South Asia and Pacific
      • By Classification
      • By Application
    • Market Attractiveness Analysis
      • By Country
      • By Classification
      • By Application
    • Key Takeaways
  15. Middle East & Africa Market Analysis 2020 to 2024 and Forecast 2025 to 2035, By Country
    • Historical Market Size Value (USD Million) Trend Analysis By Market Taxonomy, 2020 to 2024
    • Market Size Value (USD Million) Forecast By Market Taxonomy, 2025 to 2035
      • By Country
        • Kingdom of Saudi Arabia
        • Other GCC Countries
        • Turkiye
        • South Africa
        • Other African Union
        • Rest of Middle East & Africa
      • By Classification
      • By Application
    • Market Attractiveness Analysis
      • By Country
      • By Classification
      • By Application
    • Key Takeaways
  16. Key Countries Market Analysis
    • USA
      • Pricing Analysis
      • Market Share Analysis, 2024
        • By Classification
        • By Application
    • Canada
      • Pricing Analysis
      • Market Share Analysis, 2024
        • By Classification
        • By Application
    • Mexico
      • Pricing Analysis
      • Market Share Analysis, 2024
        • By Classification
        • By Application
    • Brazil
      • Pricing Analysis
      • Market Share Analysis, 2024
        • By Classification
        • By Application
    • Chile
      • Pricing Analysis
      • Market Share Analysis, 2024
        • By Classification
        • By Application
    • Germany
      • Pricing Analysis
      • Market Share Analysis, 2024
        • By Classification
        • By Application
    • UK
      • Pricing Analysis
      • Market Share Analysis, 2024
        • By Classification
        • By Application
    • Italy
      • Pricing Analysis
      • Market Share Analysis, 2024
        • By Classification
        • By Application
    • Spain
      • Pricing Analysis
      • Market Share Analysis, 2024
        • By Classification
        • By Application
    • France
      • Pricing Analysis
      • Market Share Analysis, 2024
        • By Classification
        • By Application
    • India
      • Pricing Analysis
      • Market Share Analysis, 2024
        • By Classification
        • By Application
    • ASEAN
      • Pricing Analysis
      • Market Share Analysis, 2024
        • By Classification
        • By Application
    • Australia & New Zealand
      • Pricing Analysis
      • Market Share Analysis, 2024
        • By Classification
        • By Application
    • China
      • Pricing Analysis
      • Market Share Analysis, 2024
        • By Classification
        • By Application
    • Japan
      • Pricing Analysis
      • Market Share Analysis, 2024
        • By Classification
        • By Application
    • South Korea
      • Pricing Analysis
      • Market Share Analysis, 2024
        • By Classification
        • By Application
    • Russia
      • Pricing Analysis
      • Market Share Analysis, 2024
        • By Classification
        • By Application
    • Poland
      • Pricing Analysis
      • Market Share Analysis, 2024
        • By Classification
        • By Application
    • Hungary
      • Pricing Analysis
      • Market Share Analysis, 2024
        • By Classification
        • By Application
    • Kingdom of Saudi Arabia
      • Pricing Analysis
      • Market Share Analysis, 2024
        • By Classification
        • By Application
    • Turkiye
      • Pricing Analysis
      • Market Share Analysis, 2024
        • By Classification
        • By Application
    • South Africa
      • Pricing Analysis
      • Market Share Analysis, 2024
        • By Classification
        • By Application
  17. Market Structure Analysis
    • Competition Dashboard
    • Competition Benchmarking
    • Market Share Analysis of Top Players
      • By Regional
      • By Classification
      • By Application
  18. Competition Analysis
    • Competition Deep Dive
      • FFI Tactical
        • Overview
        • Product Portfolio
        • Profitability by Market Segments (Product/Age /Sales Channel/Region)
        • Sales Footprint
        • Strategy Overview
          • Marketing Strategy
          • Product Strategy
          • Channel Strategy
      • ABP Technologies
      • ELP
      • DSE International
      • EPE
      • Sarkar Tactical
      • NIC Instruments
      • Chemring Technology
      • Richmond Defence Systems
      • Al Efah Technologies
      • Beijing TopSky Tech
      • Beijing Heweiyongtai Sci & Tech
      • Beijing TopTech Technology
      • Shenzhen CSENDU
  19. Assumptions & Acronyms Used
  20. Research Methodology

List of Tables

  • Table 1: Global Market Value (USD Million) Forecast by Region, 2020 to 2035
  • Table 2: Global Market Value (USD Million) Forecast by Classification , 2020 to 2035
  • Table 3: Global Market Value (USD Million) Forecast by Application, 2020 to 2035
  • Table 4: North America Market Value (USD Million) Forecast by Country, 2020 to 2035
  • Table 5: North America Market Value (USD Million) Forecast by Classification , 2020 to 2035
  • Table 6: North America Market Value (USD Million) Forecast by Application, 2020 to 2035
  • Table 7: Latin America Market Value (USD Million) Forecast by Country, 2020 to 2035
  • Table 8: Latin America Market Value (USD Million) Forecast by Classification , 2020 to 2035
  • Table 9: Latin America Market Value (USD Million) Forecast by Application, 2020 to 2035
  • Table 10: Western Europe Market Value (USD Million) Forecast by Country, 2020 to 2035
  • Table 11: Western Europe Market Value (USD Million) Forecast by Classification , 2020 to 2035
  • Table 12: Western Europe Market Value (USD Million) Forecast by Application, 2020 to 2035
  • Table 13: Eastern Europe Market Value (USD Million) Forecast by Country, 2020 to 2035
  • Table 14: Eastern Europe Market Value (USD Million) Forecast by Classification , 2020 to 2035
  • Table 15: Eastern Europe Market Value (USD Million) Forecast by Application, 2020 to 2035
  • Table 16: East Asia Market Value (USD Million) Forecast by Country, 2020 to 2035
  • Table 17: East Asia Market Value (USD Million) Forecast by Classification , 2020 to 2035
  • Table 18: East Asia Market Value (USD Million) Forecast by Application, 2020 to 2035
  • Table 19: South Asia and Pacific Market Value (USD Million) Forecast by Country, 2020 to 2035
  • Table 20: South Asia and Pacific Market Value (USD Million) Forecast by Classification , 2020 to 2035
  • Table 21: South Asia and Pacific Market Value (USD Million) Forecast by Application, 2020 to 2035
  • Table 22: Middle East & Africa Market Value (USD Million) Forecast by Country, 2020 to 2035
  • Table 23: Middle East & Africa Market Value (USD Million) Forecast by Classification , 2020 to 2035
  • Table 24: Middle East & Africa Market Value (USD Million) Forecast by Application, 2020 to 2035

List of Figures

  • Figure 1: Global Market Pricing Analysis
  • Figure 2: Global Market Value (USD Million) Forecast 2020-2035
  • Figure 3: Global Market Value Share and BPS Analysis by Classification , 2025 and 2035
  • Figure 4: Global Market Y to o to Y Growth Comparison by Classification , 2025-2035
  • Figure 5: Global Market Attractiveness Analysis by Classification
  • Figure 6: Global Market Value Share and BPS Analysis by Application, 2025 and 2035
  • Figure 7: Global Market Y to o to Y Growth Comparison by Application, 2025-2035
  • Figure 8: Global Market Attractiveness Analysis by Application
  • Figure 9: Global Market Value (USD Million) Share and BPS Analysis by Region, 2025 and 2035
  • Figure 10: Global Market Y to o to Y Growth Comparison by Region, 2025-2035
  • Figure 11: Global Market Attractiveness Analysis by Region
  • Figure 12: North America Market Incremental Dollar Opportunity, 2025-2035
  • Figure 13: Latin America Market Incremental Dollar Opportunity, 2025-2035
  • Figure 14: Western Europe Market Incremental Dollar Opportunity, 2025-2035
  • Figure 15: Eastern Europe Market Incremental Dollar Opportunity, 2025-2035
  • Figure 16: East Asia Market Incremental Dollar Opportunity, 2025-2035
  • Figure 17: South Asia and Pacific Market Incremental Dollar Opportunity, 2025-2035
  • Figure 18: Middle East & Africa Market Incremental Dollar Opportunity, 2025-2035
  • Figure 19: North America Market Value Share and BPS Analysis by Country, 2025 and 2035
  • Figure 20: North America Market Value Share and BPS Analysis by Classification , 2025 and 2035
  • Figure 21: North America Market Y to o to Y Growth Comparison by Classification , 2025-2035
  • Figure 22: North America Market Attractiveness Analysis by Classification
  • Figure 23: North America Market Value Share and BPS Analysis by Application, 2025 and 2035
  • Figure 24: North America Market Y to o to Y Growth Comparison by Application, 2025-2035
  • Figure 25: North America Market Attractiveness Analysis by Application
  • Figure 26: Latin America Market Value Share and BPS Analysis by Country, 2025 and 2035
  • Figure 27: Latin America Market Value Share and BPS Analysis by Classification , 2025 and 2035
  • Figure 28: Latin America Market Y to o to Y Growth Comparison by Classification , 2025-2035
  • Figure 29: Latin America Market Attractiveness Analysis by Classification
  • Figure 30: Latin America Market Value Share and BPS Analysis by Application, 2025 and 2035
  • Figure 31: Latin America Market Y to o to Y Growth Comparison by Application, 2025-2035
  • Figure 32: Latin America Market Attractiveness Analysis by Application
  • Figure 33: Western Europe Market Value Share and BPS Analysis by Country, 2025 and 2035
  • Figure 34: Western Europe Market Value Share and BPS Analysis by Classification , 2025 and 2035
  • Figure 35: Western Europe Market Y to o to Y Growth Comparison by Classification , 2025-2035
  • Figure 36: Western Europe Market Attractiveness Analysis by Classification
  • Figure 37: Western Europe Market Value Share and BPS Analysis by Application, 2025 and 2035
  • Figure 38: Western Europe Market Y to o to Y Growth Comparison by Application, 2025-2035
  • Figure 39: Western Europe Market Attractiveness Analysis by Application
  • Figure 40: Eastern Europe Market Value Share and BPS Analysis by Country, 2025 and 2035
  • Figure 41: Eastern Europe Market Value Share and BPS Analysis by Classification , 2025 and 2035
  • Figure 42: Eastern Europe Market Y to o to Y Growth Comparison by Classification , 2025-2035
  • Figure 43: Eastern Europe Market Attractiveness Analysis by Classification
  • Figure 44: Eastern Europe Market Value Share and BPS Analysis by Application, 2025 and 2035
  • Figure 45: Eastern Europe Market Y to o to Y Growth Comparison by Application, 2025-2035
  • Figure 46: Eastern Europe Market Attractiveness Analysis by Application
  • Figure 47: East Asia Market Value Share and BPS Analysis by Country, 2025 and 2035
  • Figure 48: East Asia Market Value Share and BPS Analysis by Classification , 2025 and 2035
  • Figure 49: East Asia Market Y to o to Y Growth Comparison by Classification , 2025-2035
  • Figure 50: East Asia Market Attractiveness Analysis by Classification
  • Figure 51: East Asia Market Value Share and BPS Analysis by Application, 2025 and 2035
  • Figure 52: East Asia Market Y to o to Y Growth Comparison by Application, 2025-2035
  • Figure 53: East Asia Market Attractiveness Analysis by Application
  • Figure 54: South Asia and Pacific Market Value Share and BPS Analysis by Country, 2025 and 2035
  • Figure 55: South Asia and Pacific Market Value Share and BPS Analysis by Classification , 2025 and 2035
  • Figure 56: South Asia and Pacific Market Y to o to Y Growth Comparison by Classification , 2025-2035
  • Figure 57: South Asia and Pacific Market Attractiveness Analysis by Classification
  • Figure 58: South Asia and Pacific Market Value Share and BPS Analysis by Application, 2025 and 2035
  • Figure 59: South Asia and Pacific Market Y to o to Y Growth Comparison by Application, 2025-2035
  • Figure 60: South Asia and Pacific Market Attractiveness Analysis by Application
  • Figure 61: Middle East & Africa Market Value Share and BPS Analysis by Country, 2025 and 2035
  • Figure 62: Middle East & Africa Market Value Share and BPS Analysis by Classification , 2025 and 2035
  • Figure 63: Middle East & Africa Market Y to o to Y Growth Comparison by Classification , 2025-2035
  • Figure 64: Middle East & Africa Market Attractiveness Analysis by Classification
  • Figure 65: Middle East & Africa Market Value Share and BPS Analysis by Application, 2025 and 2035
  • Figure 66: Middle East & Africa Market Y to o to Y Growth Comparison by Application, 2025-2035
  • Figure 67: Middle East & Africa Market Attractiveness Analysis by Application
  • Figure 68: Global Market - Tier Structure Analysis
  • Figure 69: Global Market - Company Share Analysis
Dashboard
Dashboard
Dashboard
Dashboard
Dashboard
Dashboard

Full Research Suite comprises of:

Market outlook & trends analysis

Market outlook & trends analysis

Interviews & case studies

Interviews & case studies

Strategic recommendations

Strategic recommendations

Vendor profiles & capabilities analysis

Vendor profiles & capabilities analysis

5-year forecasts

5-year forecasts

8 regions and 60+ country-level data splits

8 regions and 60+ country-level data splits

Market segment data splits

Market segment data splits

12 months of continuous data updates

12 months of continuous data updates

DELIVERED AS:

PDF EXCEL ONLINE

Full Research Suite


$5000

$7500

$10000

Buy Report Now
Future Market Insights

Recoilless Disruptor Market

Chat With MaRIA

Chat With

MaRIA

Hi There, I am MaRIA, Your Market Research Intelligence Assistant. How may I help you?