Rubber-to-Metal Adhesion Market Size and Share Forecast Outlook 2025 to 2035

The rubber-to-metal adhesion market is projected to grow from USD 1.5 billion in 2025 to USD 2.7 billion by 2035, registering a CAGR of 6.1%. Annual gains steadily increase from USD 0.09 billion in 2026 to USD 0.17 billion by 2035.
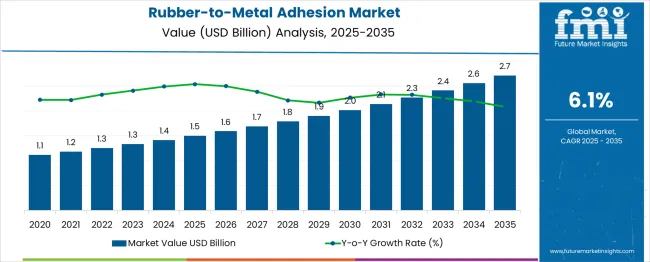
Quick Stats for Rubber to Metal Adhesion Market

  • Rubber-to-Metal Adhesion Market Size (2025): USD 1.5 billion
  • Projected Rubber-to-Metal Adhesion Market Size (2035): USD 2.7 billion
  • Forecast CAGR of Rubber-to-Metal Adhesion Market (2025 to 2035): 6.1%
  • Leading Segment of Rubber-to-Metal Adhesion Market (2025): Adhesives (48%)
  • Key Growth Regions of Rubber-to-Metal Adhesion Market: South Asia
  • Top Key Players of Rubber-to-Metal Adhesion Market: Lord Corporation (Parker Hannifin), 3M Company, Dow Inc., H.B. Fuller, Sika AG.

Rubber To Metal Adhesion Market Market Value Analysis

Metric Value
Industry Size (2025E) USD 1.5 billion
Industry Value (2035F) USD 2.7 billion
CAGR (2025 to 2035) 6.1%

This consistent rise highlights strong demand in the automotive, construction, and machinery sectors, where bonding strength and vibration damping are critical. Early-stage growth is driven by tire and bushing applications, while later years see broader industrial usage in anti-vibration mounts and sealing systems.

Technological improvements in adhesives, such as waterborne chemistries and dual-cure systems, support adoption. Regional momentum builds in Asia and Eastern Europe due to OEM expansions and cost-effective contract manufacturing.

The rubber-to-metal adhesion market holds distinct yet niche shares within its parent markets. In the rubber-to-metal bonded articles market, it constitutes nearly 100% since adhesives are essential for manufacturing vibration-damping mounts and bushings. Within the global adhesives and sealants market, rubber-to-metal adhesion accounts for about 1-2%, serving a specialized industrial need.

In the rubber-based adhesives market, it captures an estimated 5-8% share, driven by automotive and machinery applications. Across the automotive components market, rubber-to-metal adhesion contributes approximately 3-5%, mainly in engine mounts, suspension, and NVH systems. In the industrial machinery and aerospace markets, it comprises 2-4%, enabling critical sealing and isolation functions.

Analyzing Rubber-to-Metal Adhesion Market by Top Investment Segments

The industry has been segmented by product type, bonding technology, substrate type, end-use industry, and region. Product offerings include adhesives and primers. Bonding technologies cover direct and indirect bonding methods. Substrate types include natural rubber, synthetic rubber, and others.

Key end-use industries comprise automotive, industrial machinery, construction, and aerospace. Regionally, the industry spans North America, Europe, Asia Pacific, Latin America, and the Middle East & Africa, with demand shaped by vehicle production rates, polymer innovation, and regulatory shifts toward material safety and performance standards.
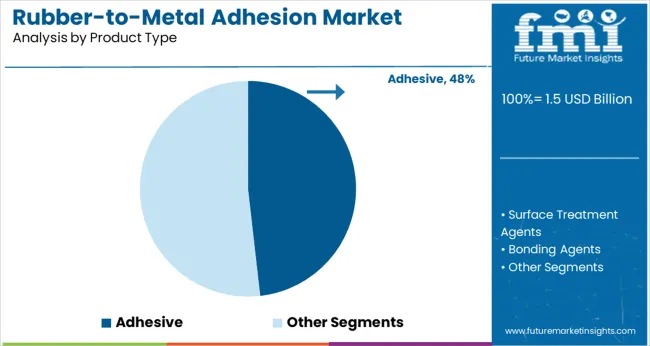
Adhesives Drive Core Product Demand at 48% Share

Rubber To Metal Adhesion Market Analysis By Product Type

Adhesives led the product type segment with a 48% share in 2025, supported by their versatility in bonding rubber to various metal substrates. Between 2025 and 2027, adoption expanded across USA tire manufacturing plants and European anti-vibration component suppliers.

From 2028 to 2031, solvent-based and waterborne adhesive innovations improved compatibility with high-performance elastomers in electric vehicle parts. Asia Pacific witnessed rapid uptake in India and China as localized manufacturing grew. Adhesives remained critical in molding applications involving bushings, engine mounts, and seals across the automotive and rail sectors.
  • Used in anti-vibration parts across European automotive suppliers
  • Widely applied in EV motor mounts and suspension bushings
  • Adopted in India for localized shock absorber production

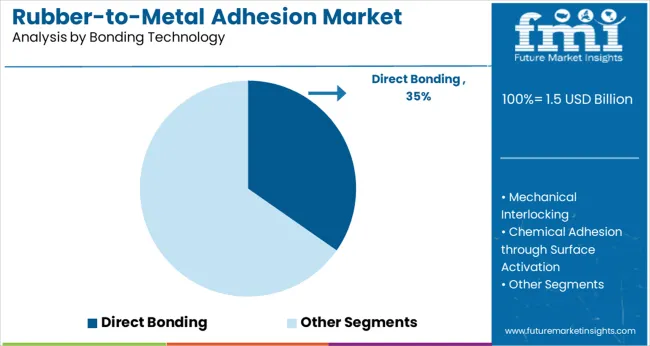
Direct Bonding Emerges as Preferred Manufacturing Technique

Rubber To Metal Adhesion Market Analysis By Bonding Technology

Direct bonding accounted for 35% of the bonding technology segment in 2025, driven by improved durability, chemical resistance, and faster production workflows. From 2025 to 2027, North American OEMs integrated direct bonding in brake systems and chassis dampers. Between 2028 and 2030, Japanese electronics firms adopted this method in compact rubber-metal isolators.

Growth was further supported by automated bonding systems used in German automotive Tier-1 suppliers. Despite rising complexity in rubber-metal combinations, direct bonding continued to dominate due to low surface preparation requirements and consistent bond integrity.
  • Adopted in brake pads and engine dampers by USAOEMs
  • Used in Japan for isolators in compact electronics systems
  • Supported by robotic application lines in European factories

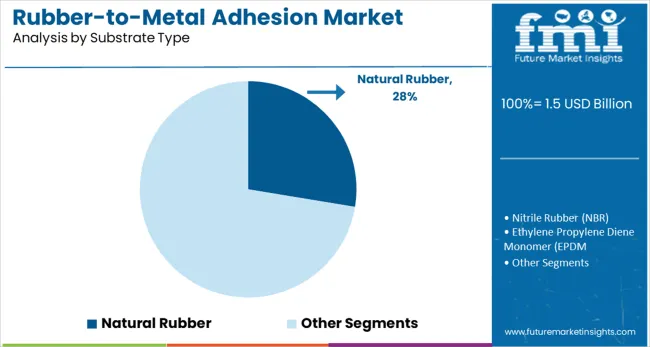
Natural Rubber Secures Leading Substrate Role

Rubber To Metal Adhesion Market Analysis By Substrate Type

Natural rubber held a 28% share in 2025 as the primary substrate due to its elasticity and vibration absorption properties. Southeast Asian countries, particularly Thailand and Indonesia, served as major sourcing hubs.

From 2025 to 2028, usage in commercial vehicle bushings and engine mounts drove volume in the APAC region. By 2030, demand rose in Europe for agricultural and heavy equipment tires using natural rubber compounds. Its compatibility with common adhesives and mold-release cycles reinforced its position in bonded automotive and industrial parts.
  • Sourced primarily from Southeast Asia for cost and quality control
  • Used in APAC for suspension and bushing systems
  • Employed in heavy-duty tires and industrial isolators in Europe

Automotive Applications Anchor End-Use Adoption

Rubber To Metal Adhesion Market Analysis By End Use Industry

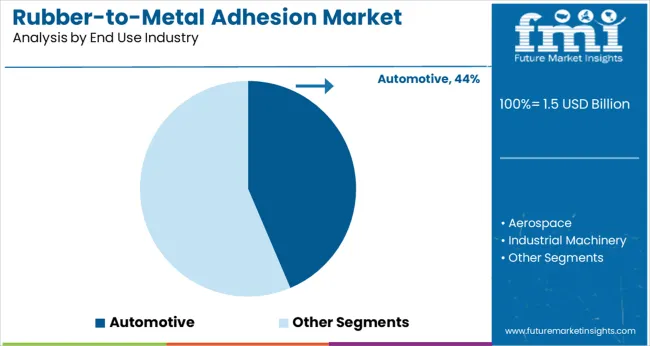
The automotive industry led the end-use segment with a 44% share in 2025, driven by demand for bonded parts like suspension systems, engine mounts, and vibration isolators. Between 2025 and 2027, EV growth boosted adhesive demand in battery casings and e-axle assemblies.

From 2028 onward, global vehicle electrification targets and lightweighting strategies increased the need for flexible rubber-metal interfaces. OEMs across Germany, South Korea, and the USA specified multi-substrate adhesion in their component procurement cycles. High-performance bonding technologies remained integral to thermal insulation, sealing, and NVH (noise, vibration, and harshness) management.

  • Utilized in EV e-axle systems and motor insulators
  • Required by OEMs for lightweight vibration control modules
  • Employed across Tier-1 suppliers in Europe and East Asia

Top Rubber-to-Metal Adhesion Market Dynamics

The industry is evolving as industries seek durable, flexible bonding solutions for vibration damping, corrosion resistance, and high-stress environments. While demand is rising in automotive, aerospace, and industrial machinery, challenges persist due to raw material cost fluctuations and complex approval pathways.

Adhesive Integration Expands Across Mobility and Machinery

Rubber-to-metal adhesives are being increasingly adopted in sectors like automotive and aerospace for bonding components such as engine mounts, vibration isolators, and suspension systems. These adhesives enhance structural performance by minimizing vibration, noise, and fatigue.

Their ability to reduce part count and support lightweighting goals has made them a preferred choice in high-performance assemblies. Advanced formulations also offer rapid curing, better heat resistance, and compatibility with a range of metal and rubber substrates.

  • Automotive and aerospace applications drive large-scale usage
  • Adhesives support reduced part count and system weight
  • Enhanced flexibility and peel strength improve bond longevity

Material Cost Pressure and Regulatory Complexity

The industry faces persistent challenges from volatile raw material prices, especially in rubber compounds, solvents, and synthetic resins. These fluctuations complicate budgeting and supply chain planning. Environmental and safety regulations vary by region, creating delays in formulation approvals and increasing R&D costs.

Furthermore, traditional sectors that rely on mechanical fasteners and molded bonding alternatives remain hesitant to adopt adhesives, especially where production is highly standardized.
  • Raw material instability disrupts cost planning and supply continuity
  • Environmental safety norms increase formulation and testing cycles
  • Competing joining methods slow adhesive adoption in conventional setups

Top Countries Formulating, Processing, and Scaling Rubber to Metal Adhesion Solutions

Rubber To Metal Adhesion Market Cagr Analysis By Country

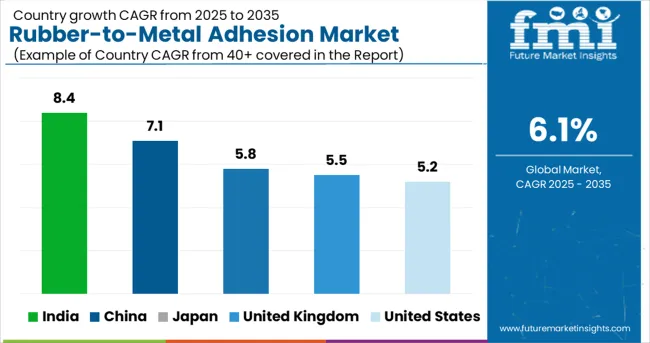
The global CAGR for the rubber-to-metal adhesion market is projected at 6.1% from 2025 to 2035. India leads among the profiled countries with 8.4%, exceeding the global pace by over 35%, followed by China at 7.1%.

These BRICS economies are scaling adhesive technologies in response to surging demand for engine mounts, bushings, and suspension components in domestic automotive and rail sectors. Japan, the United Kingdom, and the United States post 5.8%, 5.5%, and 5.2% respectively, reflecting below-average growth.

India’s performance is underpinned by backward integration across adhesive manufacturing and component molding in tiered auto clusters. China’s trajectory is fueled by the rapid adoption of industrial vibration dampening and growing exports in bonded assemblies. Slower gains in OECD markets are linked to high regulatory thresholds, slower equipment modernization, and reshoring-induced volatility in Tier 1 supplier contracts. These five nations were selected as strategic references from over 40 markets evaluated.

Countries CAGR (2025 to 2035)
United States 5.2%
United Kingdom 5.5%
India 8.4%
China 7.1%
Japan 5.8%

Demand Outlook for Rubber-to-Metal Adhesion in the United States

Sale of rubber-to-metal adhesion in the United States is growing at a CAGR of 5.2% from 2025 to 2035. Growth is expected to be driven by advancements in automotive suspension systems, vibration isolators, and electric vehicle mounts. Applications in aerospace and heavy machinery are also expanding as OEMs seek higher performance and longer durability.

Between 2020 and 2024, demand remained steady, supported by automotive OEMs in the Midwest and renewed interest in reindustrialization initiatives across the South.

  • Suspension bushings and mounts represented over 42 percent of total demand by 2024
  • Heavy equipment OEMs adopted new primer systems across 12 states
  • Midwest-based Tier 1 suppliers expanded localized adhesive procurement post-2022

Sales Analysis of Rubber-to-Metal Adhesion in the United Kingdom

The United Kingdom market is projected to grow at a CAGR of 5.5% from 2025 to 2035. Demand is anticipated to rise due to material substitution in automotive NVH components, railway couplings, and wind energy damping systems. Lightweighting strategies in transport and marine segments are creating new adhesive bonding opportunities.

Between 2020 and 2024, industry activity was largely driven by post-Brexit investment in localized supply chains and limited import substitution in industrial manufacturing zones.

  • Railcar refurbishments in Northern England will use rubber-metal bonds in 37 projects by 2024
  • Wind turbine manufacturers tested new adhesive chemistries in offshore systems
  • EV component suppliers increased dual-layer adhesive demand by 2.7× during 2020-2024

In-depth Analysis of Rubber-to-Metal Adhesion Market in India

Demand for rubber-to-metal adhesive in India is forecast to expand at a CAGR of 8.4% between 2025 and 2035, the fastest among all major economies. Demand is expected to rise from automotive parts manufacturing, railway modernization, and two-wheeler engine systems.

Domestic suppliers are investing in local formulation plants to serve Tier 1 and Tier 2 automotive vendors. From 2020 to 2024, adoption was primarily limited to OEM-specified use cases, with wider adoption emerging only post-PLI scheme rollout in the auto sector.

  • Engine mounting applications accounted for 48 percent of adhesive consumption by 2024
  • Seven new formulation plants were commissioned between 2022 and 2024
  • Use in rubber-metal coupling systems rose 3.4× across major auto clusters

Opportunity Analysis of Rubber-to-Metal Adhesion in China

The China market is projected to grow at a CAGR of 7.1% from 2025 to 2035. Rising investments in EV platforms, high-speed rail, and construction equipment manufacturing will shape long-term demand. Increased focus on vertical integration by domestic adhesive companies is expected to strengthen supply security.

From 2020 to 2024, applications were concentrated in shock absorber components and bushings for commercial vehicles, with joint ventures and licensing agreements enabling technology localization.

  • EV component makers increased adhesive demand by 3.1× from 2021 to 2024
  • Over 20 shock absorber manufacturers shifted to hybrid bonding systems by 2024
  • Provincial subsidies supported adhesive plant expansion in five industrial parks

Demand Analysis for Rubber-to-Metal Adhesion in Japan

Japan market is expected to expand at a CAGR of 5.8% from 2025 to 2035. Growth is expected to be supported by integration in electric powertrain mounts, high-durability vibration dampers, and industrial automation components. Adhesive bonding is also replacing mechanical joining in niche aerospace and robotics applications.

Between 2020 and 2024, adoption was stable, with moderate innovation driven by OEMs in Kansai and Chubu regions focusing on heat- and oil-resistant bonding agents.
  • Rubber-to-metal bonding was used in over 70 percent of EV drivetrain mounts by 2024
  • Four robotic arm manufacturers adopted custom adhesive interfaces in 2023-2024
  • Kansai-based suppliers introduced two new solvent-free adhesive series in 2022

Competitive Landscape of Rubber-to-Metal Adhesion Market

Rubber To Metal Adhesion Market Analysis By Company

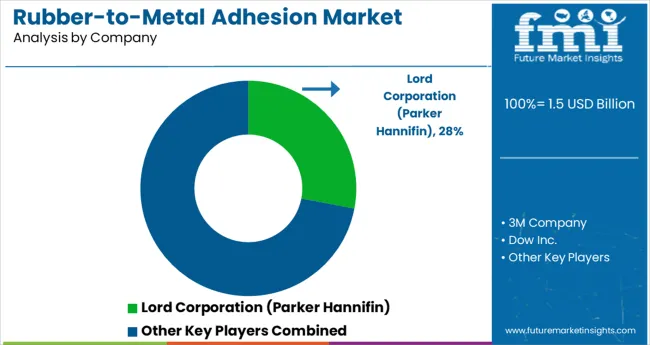
The rubber-to-metal adhesion market is characterized by specialized adhesive manufacturers supporting critical bonding needs across automotive, construction, and industrial machinery sectors. Lord Corporation (a Parker Hannifin brand) remains a benchmark in NVH (noise, vibration, and harshness) bonding systems, with robust adoption across OEM platforms.

3M Company provides a broad range of bonding tapes, sealants, and adhesives for diverse metal-rubber applications. Dow Inc. focuses on silicone and hybrid chemistries engineered for durability under extreme temperatures and mechanical stress. H.B. Fuller tailors industrial-grade bonding solutions for heavy equipment and rail infrastructure.

Sika AG holds a strong footprint in elastomeric adhesives for structural and mobility systems. Henkel’s LOCTITE line is widely applied in damping and dynamic joints. Chemence Performance Materials is emerging with custom bonding agents for engineered rubber-metal interfaces. These players advance formulation science, substrate compatibility, and application-specific performance.

Leading Company - Lord Corporation (Parker Hannifin)Industry Share - ~28%

Recent Industry News

  • In July 2024, Parker Lord hosted a technical seminar showcasing advancements in its Chemlok® adhesive range. The event highlighted both coldbond and water-based formulations for rubber-to-substrate bonding, underscoring the company’s continued innovation in high-performance adhesives for automotive and industrial applications.
  • In 2024, 3M continued the global rollout of its Neoprene High Performance Rubber and Gasket Adhesive 1300, a solvent-based adhesive known for high immediate handling strength and excellent heat resistance (up to 300°F / 148 °C). The product is widely used in rubber-to-metal bonding across industrial and automotive maintenance applications.

Leading Companies in Rubber- to -Metal Adhesion Market

  • Lord Corporation (Parker Hannifin)
  • 3M Company
  • Dow Inc.
  • H.B. Fuller
  • Sika AG
  • Henkel AG & Co. KGaA
  • Chemence Performance Materials

Research Coverage and Scope Summary

Report Attributes Details
Industry Size (2025) USD 1.5 billion
Projected Industry Size (2035) USD 2.7 billion
CAGR (2025 to 2035) 6.1%
Base Year for Estimation 2024
Historical Period 2020 to 2024
Projections Period 2025 to 2035
Quantitative Units USD billion for value and thousand metric tons for volume
Product Types Analyzed (Segment 1) Surface Treatment Agents, Adhesives, and Bonding Agents
Bonding Technologies Analyzed (Segment 2) Direct Bonding, Mechanical Interlocking, Chemical Adhesion through Surface Activation, Hybrid Systems
Substrate Types Analyzed (Segment 3) Natural Rubber, Nitrile Rubber (NBR), Ethylene Propylene Diene Monomer ( EPDM), Silicone Rubber, Others.
End Use Industries Analyzed (Segment 4) Automotive, Aerospace, Industrial Machinery, Railway, Construction Equipment
Countries Covered United States, Canada, Germany, United Kingdom, France, Italy, Spain, China, India, Japan, South Korea, Australia, Brazil, Mexico, Argentina, Saudi Arabia, UAE, South Africa
Key Players Lord Corporation (Parker Hannifin), 3M Company, Dow Inc., H.B. Fuller, Sika AG, Henkel AG & Co. KGaA, Chemence Performance Materials
Additional Attributes Dollar sales, share by bonding type and substrate, demand from vibration-damping components in automotive, growth in chemical surface activation, regional diversification of OEM suppliers

Key Segments

By Product Type:

This includes Surface Treatment Agents, Adhesives, and Bonding Agents

By Bonding Technology:

The segment is categorized into Direct Bonding, Mechanical Interlocking, Chemical Adhesion through Surface Activation, and Hybrid Systems.

By Substrate Type:

The industry is segmented into Natural Rubber, Nitrile Rubber (NBR), Ethylene Propylene Diene Monomer (EPDM), Silicone Rubber, and Others.

By End Use Industry:

This segment covers Automotive, Aerospace, Industrial Machinery, Railway, and Construction Equipment applications.

By Region:

Regional analysis includes North America, Europe, Asia Pacific, Latin America, and the Middle East & Africa.

Table of Content

  1. Executive Summary
    • Global Market Outlook
    • Demand-side Trends
    • Supply-side Trends
    • Technology Roadmap Analysis
    • Analysis and Recommendations
  2. Market Overview
    • Market Coverage / Taxonomy
    • Market Definition / Scope / Limitations
  3. Market Background
    • Market Dynamics
      • Drivers
      • Restraints
      • Opportunity
      • Trends
    • Scenario Forecast
      • Demand in Optimistic Scenario
      • Demand in Likely Scenario
      • Demand in Conservative Scenario
    • Opportunity Map Analysis
    • Product Life Cycle Analysis
    • Supply Chain Analysis
      • Supply Side Participants and their Roles
        • Producers
        • Mid-Level Participants (Traders/ Agents/ Brokers)
        • Wholesalers and Distributors
      • Value Added and Value Created at Node in the Supply Chain
      • List of Raw Material Suppliers
      • List of Existing and Potential Buyer’s
    • Investment Feasibility Matrix
    • Value Chain Analysis
      • Profit Margin Analysis
      • Wholesalers and Distributors
      • Retailers
    • PESTLE and Porter’s Analysis
    • Regulatory Landscape
      • By Key Regions
      • By Key Countries
    • Regional Parent Market Outlook
    • Production and Consumption Statistics
    • Import and Export Statistics
  4. Global Market Analysis 2020 to 2024 and Forecast, 2025 to 2035
    • Historical Market Size Value (USD Billion) & Volume (Thousand MT) Analysis, 2020 to 2024
    • Current and Future Market Size Value (USD Billion) & Volume (Thousand MT) Projections, 2025 to 2035
      • Y-o-Y Growth Trend Analysis
      • Absolute $ Opportunity Analysis
  5. Global Market Pricing Analysis 2020 to 2024 and Forecast 2025 to 2035
  6. Global Market Analysis 2020 to 2024 and Forecast 2025 to 2035, By Product Type
    • Introduction / Key Findings
    • Historical Market Size Value (USD Billion) & Volume (Thousand MT) Analysis By Product Type, 2020 to 2024
    • Current and Future Market Size Value (USD Billion) & Volume (Thousand MT) Analysis and Forecast By Product Type, 2025 to 2035
      • Surface Treatment Agents
      • Adhesives
      • Bonding Agents
    • Y-o-Y Growth Trend Analysis By Product Type, 2020 to 2024
    • Absolute $ Opportunity Analysis By Product Type, 2025 to 2035
  7. Global Market Analysis 2020 to 2024 and Forecast 2025 to 2035, By Bonding Technology
    • Introduction / Key Findings
    • Historical Market Size Value (USD Billion) & Volume (Thousand MT) Analysis By Bonding Technology, 2020 to 2024
    • Current and Future Market Size Value (USD Billion) & Volume (Thousand MT) Analysis and Forecast By Bonding Technology, 2025 to 2035
      • Direct Bonding
      • Mechanical Interlocking
      • Chemical Adhesion(Surface Activation)
      • Hybrid Systems
    • Y-o-Y Growth Trend Analysis By Bonding Technology, 2020 to 2024
    • Absolute $ Opportunity Analysis By Bonding Technology, 2025 to 2035
  8. Global Market Analysis 2020 to 2024 and Forecast 2025 to 2035, By Substrate Type
    • Introduction / Key Findings
    • Historical Market Size Value (USD Billion) & Volume (Thousand MT) Analysis By Substrate Type, 2020 to 2024
    • Current and Future Market Size Value (USD Billion) & Volume (Thousand MT) Analysis and Forecast By Substrate Type, 2025 to 2035
      • Natural Rubber
      • Nitrile Rubber (NBR)
      • Ethylene Propylene Diene Monomer (EPDM)
      • Silicone Rubber
      • Others
    • Y-o-Y Growth Trend Analysis By Substrate Type, 2020 to 2024
    • Absolute $ Opportunity Analysis By Substrate Type, 2025 to 2035
  9. Global Market Analysis 2020 to 2024 and Forecast 2025 to 2035, By End Use Industry
    • Introduction / Key Findings
    • Historical Market Size Value (USD Billion) & Volume (Thousand MT) Analysis By End Use Industry, 2020 to 2024
    • Current and Future Market Size Value (USD Billion) & Volume (Thousand MT) Analysis and Forecast By End Use Industry, 2025 to 2035
      • Automotive
      • Aerospace
      • Industrial Machinery
      • Railway
      • Construction Equipment
    • Y-o-Y Growth Trend Analysis By End Use Industry, 2020 to 2024
    • Absolute $ Opportunity Analysis By End Use Industry, 2025 to 2035
  10. Global Market Analysis 2020 to 2024 and Forecast 2025 to 2035, By Region
    • Introduction
    • Historical Market Size Value (USD Billion) & Volume (Thousand MT) Analysis By Region, 2020 to 2024
    • Current Market Size Value (USD Billion) & Volume (Thousand MT) Analysis and Forecast By Region, 2025 to 2035
      • North America
      • Latin America
      • Western Europe
      • Eastern Europe
      • East Asia
      • South Asia & Pacific
      • Middle East and Africa
    • Market Attractiveness Analysis By Region
  11. North America Market Analysis 2020 to 2024 and Forecast 2025 to 2035, By Country
    • Historical Market Size Value (USD Billion) & Volume (Thousand MT) Trend Analysis By Market Taxonomy, 2020 to 2024
    • Market Size Value (USD Billion) & Volume (Thousand MT) Forecast By Market Taxonomy, 2025 to 2035
      • By Country
        • USA
        • Canada
        • Mexico
      • By Product Type
      • By Bonding Technology
      • By Substrate Type
      • By End Use Industry
    • Market Attractiveness Analysis
      • By Country
      • By Product Type
      • By Bonding Technology
      • By Substrate Type
      • By End Use Industry
    • Key Takeaways
  12. Latin America Market Analysis 2020 to 2024 and Forecast 2025 to 2035, By Country
    • Historical Market Size Value (USD Billion) & Volume (Thousand MT) Trend Analysis By Market Taxonomy, 2020 to 2024
    • Market Size Value (USD Billion) & Volume (Thousand MT) Forecast By Market Taxonomy, 2025 to 2035
      • By Country
        • Brazil
        • Argentina
        • Rest of LATAM
      • By Product Type
      • By Bonding Technology
      • By Substrate Type
      • By End Use Industry
    • Market Attractiveness Analysis
      • By Country
      • By Product Type
      • By Bonding Technology
      • By Substrate Type
      • By End Use Industry
    • Key Takeaways
  13. Western Europe Market Analysis 2020 to 2024 and Forecast 2025 to 2035, By Country
    • Historical Market Size Value (USD Billion) & Volume (Thousand MT) Trend Analysis By Market Taxonomy, 2020 to 2024
    • Market Size Value (USD Billion) & Volume (Thousand MT) Forecast By Market Taxonomy, 2025 to 2035
      • By Country
        • Germany
        • Italy
        • France
        • UK
        • Spain
        • BENELUX
        • Nordic
        • Rest of W.Europe
      • By Product Type
      • By Bonding Technology
      • By Substrate Type
      • By End Use Industry
    • Market Attractiveness Analysis
      • By Country
      • By Product Type
      • By Bonding Technology
      • By Substrate Type
      • By End Use Industry
    • Key Takeaways
  14. Eastern Europe Market Analysis 2020 to 2024 and Forecast 2025 to 2035, By Country
    • Historical Market Size Value (USD Billion) & Volume (Thousand MT) Trend Analysis By Market Taxonomy, 2020 to 2024
    • Market Size Value (USD Billion) & Volume (Thousand MT) Forecast By Market Taxonomy, 2025 to 2035
      • By Country
        • Russia
        • Hungary
        • Poland
        • Balkan & Baltics
        • Rest of E. Europe
      • By Product Type
      • By Bonding Technology
      • By Substrate Type
      • By End Use Industry
    • Market Attractiveness Analysis
      • By Country
      • By Product Type
      • By Bonding Technology
      • By Substrate Type
      • By End Use Industry
    • Key Takeaways
  15. East Asia Market Analysis 2020 to 2024 and Forecast 2025 to 2035, By Country
    • Historical Market Size Value (USD Billion) & Volume (Thousand MT) Trend Analysis By Market Taxonomy, 2020 to 2024
    • Market Size Value (USD Billion) & Volume (Thousand MT) Forecast By Market Taxonomy, 2025 to 2035
      • By Country
        • China
        • Japan
        • South Korea
      • By Product Type
      • By Bonding Technology
      • By Substrate Type
      • By End Use Industry
    • Market Attractiveness Analysis
      • By Country
      • By Product Type
      • By Bonding Technology
      • By Substrate Type
      • By End Use Industry
    • Key Takeaways
  16. South Asia & Pacific Market Analysis 2020 to 2024 and Forecast 2025 to 2035, By Country
    • Historical Market Size Value (USD Billion) & Volume (Thousand MT) Trend Analysis By Market Taxonomy, 2020 to 2024
    • Market Size Value (USD Billion) & Volume (Thousand MT) Forecast By Market Taxonomy, 2025 to 2035
      • By Country
        • India
        • Australia & New Zealand
        • ASEAN
        • Rest of SAP
      • By Product Type
      • By Bonding Technology
      • By Substrate Type
      • By End Use Industry
    • Market Attractiveness Analysis
      • By Country
      • By Product Type
      • By Bonding Technology
      • By Substrate Type
      • By End Use Industry
    • Key Takeaways
  17. Middle East and Africa Market Analysis 2020 to 2024 and Forecast 2025 to 2035, By Country
    • Historical Market Size Value (USD Billion) & Volume (Thousand MT) Trend Analysis By Market Taxonomy, 2020 to 2024
    • Market Size Value (USD Billion) & Volume (Thousand MT) Forecast By Market Taxonomy, 2025 to 2035
      • By Country
        • GCC Countries
        • Northern Africa
        • South Africa
        • Turkiye
        • Rest of MEA
      • By Product Type
      • By Bonding Technology
      • By Substrate Type
      • By End Use Industry
    • Market Attractiveness Analysis
      • By Country
      • By Product Type
      • By Bonding Technology
      • By Substrate Type
      • By End Use Industry
    • Key Takeaways
  18. Key Countries Market Analysis
    • USA
      • Pricing Analysis
      • Market Share Analysis, 2024
        • By Product Type
        • By Bonding Technology
        • By Substrate Type
        • By End Use Industry
    • Canada
      • Pricing Analysis
      • Market Share Analysis, 2024
        • By Product Type
        • By Bonding Technology
        • By Substrate Type
        • By End Use Industry
    • Brazil
      • Pricing Analysis
      • Market Share Analysis, 2024
        • By Product Type
        • By Bonding Technology
        • By Substrate Type
        • By End Use Industry
    • Mexico
      • Pricing Analysis
      • Market Share Analysis, 2024
        • By Product Type
        • By Bonding Technology
        • By Substrate Type
        • By End Use Industry
    • Argentina
      • Pricing Analysis
      • Market Share Analysis, 2024
        • By Product Type
        • By Bonding Technology
        • By Substrate Type
        • By End Use Industry
  19. Market Structure Analysis
    • Competition Dashboard
    • Competition Benchmarking
    • Market Share Analysis of Top Players
      • By Regional
      • By Product Type
      • By Bonding Technology
      • By Substrate Type
      • By End Use Industry
  20. Competition Analysis
    • Competition Deep Dive
      • Lord Corporation (Parker Hannifin)
        • Overview
        • Product Portfolio
        • Profitability by Market Segments (Product/Age /Sales Channel/Region)
        • Sales Footprint
        • Strategy Overview
          • Marketing Strategy
          • Product Strategy
          • Channel Strategy
      • 3M Company
        • Overview
        • Product Portfolio
        • Profitability by Market Segments (Product/Age /Sales Channel/Region)
        • Sales Footprint
        • Strategy Overview
          • Marketing Strategy
          • Product Strategy
          • Channel Strategy
      • Dow Inc.
        • Overview
        • Product Portfolio
        • Profitability by Market Segments (Product/Age /Sales Channel/Region)
        • Sales Footprint
        • Strategy Overview
          • Marketing Strategy
          • Product Strategy
          • Channel Strategy
      • H.B. Fuller
        • Overview
        • Product Portfolio
        • Profitability by Market Segments (Product/Age /Sales Channel/Region)
        • Sales Footprint
        • Strategy Overview
          • Marketing Strategy
          • Product Strategy
          • Channel Strategy
      • Sika AG
        • Overview
        • Product Portfolio
        • Profitability by Market Segments (Product/Age /Sales Channel/Region)
        • Sales Footprint
        • Strategy Overview
          • Marketing Strategy
          • Product Strategy
          • Channel Strategy
      • Henkel AG & Co. KGaA
        • Overview
        • Product Portfolio
        • Profitability by Market Segments (Product/Age /Sales Channel/Region)
        • Sales Footprint
        • Strategy Overview
          • Marketing Strategy
          • Product Strategy
          • Channel Strategy
      • Chemence Performance Materials
        • Overview
        • Product Portfolio
        • Profitability by Market Segments (Product/Age /Sales Channel/Region)
        • Sales Footprint
        • Strategy Overview
          • Marketing Strategy
          • Product Strategy
          • Channel Strategy
  21. Assumptions & Acronyms Used
  22. Research Methodology

List of Tables

  • Table 1: Global Market Value (USD Billion) Forecast by Region, 2020-2035
  • Table 2: Global Market Volume (Thousand MT) Forecast by Region, 2020-2035
  • Table 3: Global Market Value (USD Billion) Forecast by Product Type, 2020-2035
  • Table 4: Global Market Volume (Thousand MT) Forecast by Product Type, 2020-2035
  • Table 5: Global Market Value (USD Billion) Forecast by Bonding Technology, 2020-2035
  • Table 6: Global Market Volume (Thousand MT) Forecast by Bonding Technology, 2020-2035
  • Table 7: Global Market Value (USD Billion) Forecast by Substrate Type, 2020-2035
  • Table 8: Global Market Volume (Thousand MT) Forecast by Substrate Type, 2020-2035
  • Table 9: Global Market Value (USD Billion) Forecast by End Use Industry, 2020-2035
  • Table 10: Global Market Volume (Thousand MT) Forecast by End Use Industry, 2020-2035
  • Table 11: North America Market Value (USD Billion) Forecast by Country, 2020-2035
  • Table 12: North America Market Volume (Thousand MT) Forecast by Country, 2020-2035
  • Table 13: North America Market Value (USD Billion) Forecast by Product Type, 2020-2035
  • Table 14: North America Market Volume (Thousand MT) Forecast by Product Type, 2020-2035
  • Table 15: North America Market Value (USD Billion) Forecast by Bonding Technology, 2020-2035
  • Table 16: North America Market Volume (Thousand MT) Forecast by Bonding Technology, 2020-2035
  • Table 17: North America Market Value (USD Billion) Forecast by Substrate Type, 2020-2035
  • Table 18: North America Market Volume (Thousand MT) Forecast by Substrate Type, 2020-2035
  • Table 19: North America Market Value (USD Billion) Forecast by End Use Industry, 2020-2035
  • Table 20: North America Market Volume (Thousand MT) Forecast by End Use Industry, 2020-2035
  • Table 21: Latin America Market Value (USD Billion) Forecast by Country, 2020-2035
  • Table 22: Latin America Market Volume (Thousand MT) Forecast by Country, 2020-2035
  • Table 23: Latin America Market Value (USD Billion) Forecast by Product Type, 2020-2035
  • Table 24: Latin America Market Volume (Thousand MT) Forecast by Product Type, 2020-2035
  • Table 25: Latin America Market Value (USD Billion) Forecast by Bonding Technology, 2020-2035
  • Table 26: Latin America Market Volume (Thousand MT) Forecast by Bonding Technology, 2020-2035
  • Table 27: Latin America Market Value (USD Billion) Forecast by Substrate Type, 2020-2035
  • Table 28: Latin America Market Volume (Thousand MT) Forecast by Substrate Type, 2020-2035
  • Table 29: Latin America Market Value (USD Billion) Forecast by End Use Industry, 2020-2035
  • Table 30: Latin America Market Volume (Thousand MT) Forecast by End Use Industry, 2020-2035
  • Table 31: Western Europe Market Value (USD Billion) Forecast by Country, 2020-2035
  • Table 32: Western Europe Market Volume (Thousand MT) Forecast by Country, 2020-2035
  • Table 33: Western Europe Market Value (USD Billion) Forecast by Product Type, 2020-2035
  • Table 34: Western Europe Market Volume (Thousand MT) Forecast by Product Type, 2020-2035
  • Table 35: Western Europe Market Value (USD Billion) Forecast by Bonding Technology, 2020-2035
  • Table 36: Western Europe Market Volume (Thousand MT) Forecast by Bonding Technology, 2020-2035
  • Table 37: Western Europe Market Value (USD Billion) Forecast by Substrate Type, 2020-2035
  • Table 38: Western Europe Market Volume (Thousand MT) Forecast by Substrate Type, 2020-2035
  • Table 39: Western Europe Market Value (USD Billion) Forecast by End Use Industry, 2020-2035
  • Table 40: Western Europe Market Volume (Thousand MT) Forecast by End Use Industry, 2020-2035
  • Table 41: Eastern Europe Market Value (USD Billion) Forecast by Country, 2020-2035
  • Table 42: Eastern Europe Market Volume (Thousand MT) Forecast by Country, 2020-2035
  • Table 43: Eastern Europe Market Value (USD Billion) Forecast by Product Type, 2020-2035
  • Table 44: Eastern Europe Market Volume (Thousand MT) Forecast by Product Type, 2020-2035
  • Table 45: Eastern Europe Market Value (USD Billion) Forecast by Bonding Technology, 2020-2035
  • Table 46: Eastern Europe Market Volume (Thousand MT) Forecast by Bonding Technology, 2020-2035
  • Table 47: Eastern Europe Market Value (USD Billion) Forecast by Substrate Type, 2020-2035
  • Table 48: Eastern Europe Market Volume (Thousand MT) Forecast by Substrate Type, 2020-2035
  • Table 49: Eastern Europe Market Value (USD Billion) Forecast by End Use Industry, 2020-2035
  • Table 50: Eastern Europe Market Volume (Thousand MT) Forecast by End Use Industry, 2020-2035
  • Table 51: East Asia Market Value (USD Billion) Forecast by Country, 2020-2035
  • Table 52: East Asia Market Volume (Thousand MT) Forecast by Country, 2020-2035
  • Table 53: East Asia Market Value (USD Billion) Forecast by Product Type, 2020-2035
  • Table 54: East Asia Market Volume (Thousand MT) Forecast by Product Type, 2020-2035
  • Table 55: East Asia Market Value (USD Billion) Forecast by Bonding Technology, 2020-2035
  • Table 56: East Asia Market Volume (Thousand MT) Forecast by Bonding Technology, 2020-2035
  • Table 57: East Asia Market Value (USD Billion) Forecast by Substrate Type, 2020-2035
  • Table 58: East Asia Market Volume (Thousand MT) Forecast by Substrate Type, 2020-2035
  • Table 59: East Asia Market Value (USD Billion) Forecast by End Use Industry, 2020-2035
  • Table 60: East Asia Market Volume (Thousand MT) Forecast by End Use Industry, 2020-2035
  • Table 61: South Asia & Pacific Market Value (USD Billion) Forecast by Country, 2020-2035
  • Table 62: South Asia & Pacific Market Volume (Thousand MT) Forecast by Country, 2020-2035
  • Table 63: South Asia & Pacific Market Value (USD Billion) Forecast by Product Type, 2020-2035
  • Table 64: South Asia & Pacific Market Volume (Thousand MT) Forecast by Product Type, 2020-2035
  • Table 65: South Asia & Pacific Market Value (USD Billion) Forecast by Bonding Technology, 2020-2035
  • Table 66: South Asia & Pacific Market Volume (Thousand MT) Forecast by Bonding Technology, 2020-2035
  • Table 67: South Asia & Pacific Market Value (USD Billion) Forecast by Substrate Type, 2020-2035
  • Table 68: South Asia & Pacific Market Volume (Thousand MT) Forecast by Substrate Type, 2020-2035
  • Table 69: South Asia & Pacific Market Value (USD Billion) Forecast by End Use Industry, 2020-2035
  • Table 70: South Asia & Pacific Market Volume (Thousand MT) Forecast by End Use Industry, 2020-2035
  • Table 71: Middle East and Africa Market Value (USD Billion) Forecast by Country, 2020-2035
  • Table 72: Middle East and Africa Market Volume (Thousand MT) Forecast by Country, 2020-2035
  • Table 73: Middle East and Africa Market Value (USD Billion) Forecast by Product Type, 2020-2035
  • Table 74: Middle East and Africa Market Volume (Thousand MT) Forecast by Product Type, 2020-2035
  • Table 75: Middle East and Africa Market Value (USD Billion) Forecast by Bonding Technology, 2020-2035
  • Table 76: Middle East and Africa Market Volume (Thousand MT) Forecast by Bonding Technology, 2020-2035
  • Table 77: Middle East and Africa Market Value (USD Billion) Forecast by Substrate Type, 2020-2035
  • Table 78: Middle East and Africa Market Volume (Thousand MT) Forecast by Substrate Type, 2020-2035
  • Table 79: Middle East and Africa Market Value (USD Billion) Forecast by End Use Industry, 2020-2035
  • Table 80: Middle East and Africa Market Volume (Thousand MT) Forecast by End Use Industry, 2020-2035

List of Figures

  • Figure 1: Global Market Volume (Thousand MT) Forecast 2020-2035
  • Figure 2: Global Market Pricing Analysis
  • Figure 3: Global Market Value (USD Billion) Forecast 2020-2035
  • Figure 4: Global Market Value Share and BPS Analysis by Product Type, 2025 and 2035
  • Figure 5: Global Market Y-o-Y Growth Comparison by Product Type, 2025-2035
  • Figure 6: Global Market Attractiveness Analysis by Product Type
  • Figure 7: Global Market Value Share and BPS Analysis by Bonding Technology, 2025 and 2035
  • Figure 8: Global Market Y-o-Y Growth Comparison by Bonding Technology, 2025-2035
  • Figure 9: Global Market Attractiveness Analysis by Bonding Technology
  • Figure 10: Global Market Value Share and BPS Analysis by Substrate Type, 2025 and 2035
  • Figure 11: Global Market Y-o-Y Growth Comparison by Substrate Type, 2025-2035
  • Figure 12: Global Market Attractiveness Analysis by Substrate Type
  • Figure 13: Global Market Value Share and BPS Analysis by End Use Industry, 2025 and 2035
  • Figure 14: Global Market Y-o-Y Growth Comparison by End Use Industry, 2025-2035
  • Figure 15: Global Market Attractiveness Analysis by End Use Industry
  • Figure 16: Global Market Value (USD Billion) Share and BPS Analysis by Region, 2025 and 2035
  • Figure 17: Global Market Y-o-Y Growth Comparison by Region, 2025-2035
  • Figure 18: Global Market Attractiveness Analysis by Region
  • Figure 19: North America Market Incremental $ Opportunity, 2025-2035
  • Figure 20: Latin America Market Incremental $ Opportunity, 2025-2035
  • Figure 21: Western Europe Market Incremental $ Opportunity, 2025-2035
  • Figure 22: Eastern Europe Market Incremental $ Opportunity, 2025-2035
  • Figure 23: East Asia Market Incremental $ Opportunity, 2025-2035
  • Figure 24: South Asia & Pacific Market Incremental $ Opportunity, 2025-2035
  • Figure 25: Middle East and Africa Market Incremental $ Opportunity, 2025-2035
  • Figure 26: North America Market Value Share and BPS Analysis by Country, 2025 and 2035
  • Figure 27: North America Market Value Share and BPS Analysis by Product Type, 2025 and 2035
  • Figure 28: North America Market Y-o-Y Growth Comparison by Product Type, 2025-2035
  • Figure 29: North America Market Attractiveness Analysis by Product Type
  • Figure 30: North America Market Value Share and BPS Analysis by Bonding Technology, 2025 and 2035
  • Figure 31: North America Market Y-o-Y Growth Comparison by Bonding Technology, 2025-2035
  • Figure 32: North America Market Attractiveness Analysis by Bonding Technology
  • Figure 33: North America Market Value Share and BPS Analysis by Substrate Type, 2025 and 2035
  • Figure 34: North America Market Y-o-Y Growth Comparison by Substrate Type, 2025-2035
  • Figure 35: North America Market Attractiveness Analysis by Substrate Type
  • Figure 36: North America Market Value Share and BPS Analysis by End Use Industry, 2025 and 2035
  • Figure 37: North America Market Y-o-Y Growth Comparison by End Use Industry, 2025-2035
  • Figure 38: North America Market Attractiveness Analysis by End Use Industry
  • Figure 39: Latin America Market Value Share and BPS Analysis by Country, 2025 and 2035
  • Figure 40: Latin America Market Value Share and BPS Analysis by Product Type, 2025 and 2035
  • Figure 41: Latin America Market Y-o-Y Growth Comparison by Product Type, 2025-2035
  • Figure 42: Latin America Market Attractiveness Analysis by Product Type
  • Figure 43: Latin America Market Value Share and BPS Analysis by Bonding Technology, 2025 and 2035
  • Figure 44: Latin America Market Y-o-Y Growth Comparison by Bonding Technology, 2025-2035
  • Figure 45: Latin America Market Attractiveness Analysis by Bonding Technology
  • Figure 46: Latin America Market Value Share and BPS Analysis by Substrate Type, 2025 and 2035
  • Figure 47: Latin America Market Y-o-Y Growth Comparison by Substrate Type, 2025-2035
  • Figure 48: Latin America Market Attractiveness Analysis by Substrate Type
  • Figure 49: Latin America Market Value Share and BPS Analysis by End Use Industry, 2025 and 2035
  • Figure 50: Latin America Market Y-o-Y Growth Comparison by End Use Industry, 2025-2035
  • Figure 51: Latin America Market Attractiveness Analysis by End Use Industry
  • Figure 52: Western Europe Market Value Share and BPS Analysis by Country, 2025 and 2035
  • Figure 53: Western Europe Market Value Share and BPS Analysis by Product Type, 2025 and 2035
  • Figure 54: Western Europe Market Y-o-Y Growth Comparison by Product Type, 2025-2035
  • Figure 55: Western Europe Market Attractiveness Analysis by Product Type
  • Figure 56: Western Europe Market Value Share and BPS Analysis by Bonding Technology, 2025 and 2035
  • Figure 57: Western Europe Market Y-o-Y Growth Comparison by Bonding Technology, 2025-2035
  • Figure 58: Western Europe Market Attractiveness Analysis by Bonding Technology
  • Figure 59: Western Europe Market Value Share and BPS Analysis by Substrate Type, 2025 and 2035
  • Figure 60: Western Europe Market Y-o-Y Growth Comparison by Substrate Type, 2025-2035
  • Figure 61: Western Europe Market Attractiveness Analysis by Substrate Type
  • Figure 62: Western Europe Market Value Share and BPS Analysis by End Use Industry, 2025 and 2035
  • Figure 63: Western Europe Market Y-o-Y Growth Comparison by End Use Industry, 2025-2035
  • Figure 64: Western Europe Market Attractiveness Analysis by End Use Industry
  • Figure 65: Eastern Europe Market Value Share and BPS Analysis by Country, 2025 and 2035
  • Figure 66: Eastern Europe Market Value Share and BPS Analysis by Product Type, 2025 and 2035
  • Figure 67: Eastern Europe Market Y-o-Y Growth Comparison by Product Type, 2025-2035
  • Figure 68: Eastern Europe Market Attractiveness Analysis by Product Type
  • Figure 69: Eastern Europe Market Value Share and BPS Analysis by Bonding Technology, 2025 and 2035
  • Figure 70: Eastern Europe Market Y-o-Y Growth Comparison by Bonding Technology, 2025-2035
  • Figure 71: Eastern Europe Market Attractiveness Analysis by Bonding Technology
  • Figure 72: Eastern Europe Market Value Share and BPS Analysis by Substrate Type, 2025 and 2035
  • Figure 73: Eastern Europe Market Y-o-Y Growth Comparison by Substrate Type, 2025-2035
  • Figure 74: Eastern Europe Market Attractiveness Analysis by Substrate Type
  • Figure 75: Eastern Europe Market Value Share and BPS Analysis by End Use Industry, 2025 and 2035
  • Figure 76: Eastern Europe Market Y-o-Y Growth Comparison by End Use Industry, 2025-2035
  • Figure 77: Eastern Europe Market Attractiveness Analysis by End Use Industry
  • Figure 78: East Asia Market Value Share and BPS Analysis by Country, 2025 and 2035
  • Figure 79: East Asia Market Value Share and BPS Analysis by Product Type, 2025 and 2035
  • Figure 80: East Asia Market Y-o-Y Growth Comparison by Product Type, 2025-2035
  • Figure 81: East Asia Market Attractiveness Analysis by Product Type
  • Figure 82: East Asia Market Value Share and BPS Analysis by Bonding Technology, 2025 and 2035
  • Figure 83: East Asia Market Y-o-Y Growth Comparison by Bonding Technology, 2025-2035
  • Figure 84: East Asia Market Attractiveness Analysis by Bonding Technology
  • Figure 85: East Asia Market Value Share and BPS Analysis by Substrate Type, 2025 and 2035
  • Figure 86: East Asia Market Y-o-Y Growth Comparison by Substrate Type, 2025-2035
  • Figure 87: East Asia Market Attractiveness Analysis by Substrate Type
  • Figure 88: East Asia Market Value Share and BPS Analysis by End Use Industry, 2025 and 2035
  • Figure 89: East Asia Market Y-o-Y Growth Comparison by End Use Industry, 2025-2035
  • Figure 90: East Asia Market Attractiveness Analysis by End Use Industry
  • Figure 91: South Asia & Pacific Market Value Share and BPS Analysis by Country, 2025 and 2035
  • Figure 92: South Asia & Pacific Market Value Share and BPS Analysis by Product Type, 2025 and 2035
  • Figure 93: South Asia & Pacific Market Y-o-Y Growth Comparison by Product Type, 2025-2035
  • Figure 94: South Asia & Pacific Market Attractiveness Analysis by Product Type
  • Figure 95: South Asia & Pacific Market Value Share and BPS Analysis by Bonding Technology, 2025 and 2035
  • Figure 96: South Asia & Pacific Market Y-o-Y Growth Comparison by Bonding Technology, 2025-2035
  • Figure 97: South Asia & Pacific Market Attractiveness Analysis by Bonding Technology
  • Figure 98: South Asia & Pacific Market Value Share and BPS Analysis by Substrate Type, 2025 and 2035
  • Figure 99: South Asia & Pacific Market Y-o-Y Growth Comparison by Substrate Type, 2025-2035
  • Figure 100: South Asia & Pacific Market Attractiveness Analysis by Substrate Type
  • Figure 101: South Asia & Pacific Market Value Share and BPS Analysis by End Use Industry, 2025 and 2035
  • Figure 102: South Asia & Pacific Market Y-o-Y Growth Comparison by End Use Industry, 2025-2035
  • Figure 103: South Asia & Pacific Market Attractiveness Analysis by End Use Industry
  • Figure 104: Middle East and Africa Market Value Share and BPS Analysis by Country, 2025 and 2035
  • Figure 105: Middle East and Africa Market Value Share and BPS Analysis by Product Type, 2025 and 2035
  • Figure 106: Middle East and Africa Market Y-o-Y Growth Comparison by Product Type, 2025-2035
  • Figure 107: Middle East and Africa Market Attractiveness Analysis by Product Type
  • Figure 108: Middle East and Africa Market Value Share and BPS Analysis by Bonding Technology, 2025 and 2035
  • Figure 109: Middle East and Africa Market Y-o-Y Growth Comparison by Bonding Technology, 2025-2035
  • Figure 110: Middle East and Africa Market Attractiveness Analysis by Bonding Technology
  • Figure 111: Middle East and Africa Market Value Share and BPS Analysis by Substrate Type, 2025 and 2035
  • Figure 112: Middle East and Africa Market Y-o-Y Growth Comparison by Substrate Type, 2025-2035
  • Figure 113: Middle East and Africa Market Attractiveness Analysis by Substrate Type
  • Figure 114: Middle East and Africa Market Value Share and BPS Analysis by End Use Industry, 2025 and 2035
  • Figure 115: Middle East and Africa Market Y-o-Y Growth Comparison by End Use Industry, 2025-2035
  • Figure 116: Middle East and Africa Market Attractiveness Analysis by End Use Industry
  • Figure 117: Global Market - Tier Structure Analysis
  • Figure 118: Global Market - Company Share Analysis

Frequently Asked Questions

What is the projected industry value of the rubber-to-metal adhesion market in 2025?

The industry is projected to reach USD 1.5 billion in 2025.

What is the expected global CAGR for the rubber-to-metal adhesion market from 2025 to 2035?

The industry is expected to grow at a CAGR of 6.1% from 2025 to 2035.

Which segment is expected to dominate the rubber-to-metal adhesion market in 2025?

Adhesives are expected to capture 48% of the industry in 2025.

Which region is forecasted to show significant growth in the rubber-to-metal adhesion market by 2035?

The Asia Pacific region, particularly India, is projected to register a CAGR of 8.4% from 2025 to 2035.

What is the forecasted industry value of the rubber-to-metal adhesion market by 2035?

The industry is projected to reach USD 2.7 billion by 2035.

Explore Similar Insights

Future Market Insights

Rubber-to-metal Adhesion Market