The Anti-Adhesion Barrier Gels Market is estimated to be valued at USD 119.0 million in 2025 and is projected to reach USD 266.5 million by 2035, registering a compound annual growth rate (CAGR) of 8.4% over the forecast period.
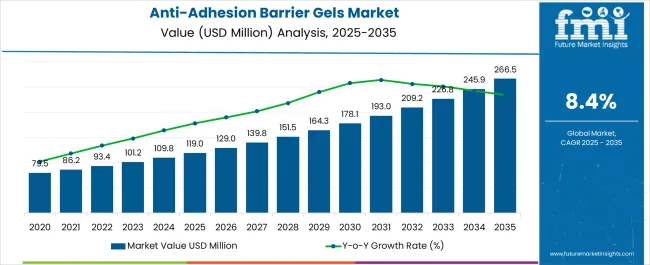
| Metric | Value |
|---|---|
| Anti-Adhesion Barrier Gels Market Estimated Value in (2025 E) | USD 119.0 million |
| Anti-Adhesion Barrier Gels Market Forecast Value in (2035 F) | USD 266.5 million |
| Forecast CAGR (2025 to 2035) | 8.4% |
The anti-adhesion barrier gels market is gaining momentum due to the increasing number of surgical procedures, heightened awareness of postoperative complications, and the growing clinical preference for adhesion prevention technologies. With rising surgical volumes in general, gynecological, orthopedic, and cardiovascular disciplines, demand has intensified for effective solutions that reduce the risk of internal tissue adhesions.
Regulatory approvals for biocompatible formulations and clinical emphasis on minimizing readmission rates and post-surgical interventions have further encouraged adoption. Industry players are investing in formulation innovation using biodegradable polymers and bioactive ingredients that improve efficacy and resorption rates.
The ongoing shift toward minimally invasive surgeries is also supporting growth, as anti-adhesion gels offer an efficient method for targeted, localized delivery with minimal systemic effects. Looking ahead, strategic collaborations between biotech firms and surgical device manufacturers are expected to pave the way for next-generation product development tailored to specific surgical indications.
The market is segmented by Product Type, Application Category, and End User and region. By Product Type, the market is divided into Hyaluronic acid, Carboxymethylcellulose, and Polyethylene oxides. In terms of Application Category, the market is classified into Surgical Applications and Trauma Cases. Based on End User, the market is segmented into Hospitals, Ambulatory Surgical Centers, and Specialty Clinics. Regionally, the market is classified into North America, Latin America, Western Europe, Eastern Europe, Balkan & Baltic Countries, Russia & Belarus, Central Asia, East Asia, South Asia & Pacific, and the Middle East & Africa.
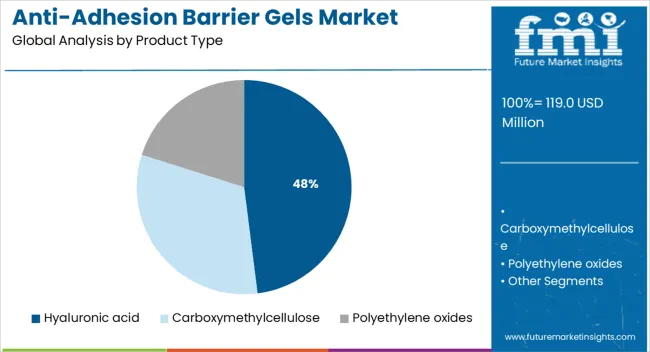
Hyaluronic acid-based formulations are projected to hold 48.0% of the total market revenue in 2025, making this the leading product type in the anti-adhesion barrier gels landscape. This segment’s prominence is being driven by the material’s excellent biocompatibility, viscoelastic properties, and ability to form protective barriers at surgical sites.
Hyaluronic acid’s natural occurrence in the human body reduces immunogenic risk, making it suitable across a wide range of procedures, including abdominal, pelvic, and spinal surgeries. Additionally, its ease of application and resorbability have improved surgical workflow and patient compliance.
The capacity to be used alone or in combination with other polymers has broadened its usage across complex and repeat interventions. As hospitals and surgical centers prioritize patient safety and outcomes, hyaluronic acid continues to be favored for its clinically validated performance and regenerative potential.
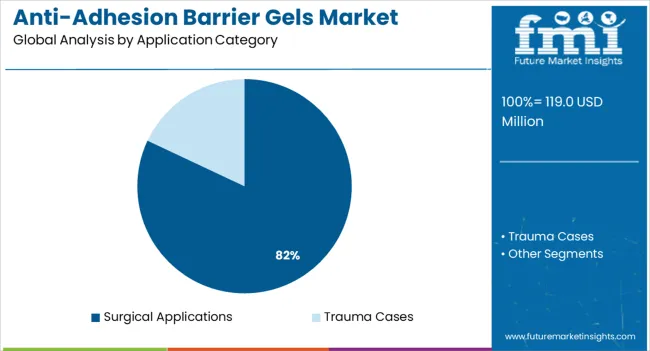
Surgical applications are expected to contribute 82.0% of the anti-adhesion barrier gels market revenue by 2025, establishing this as the dominant application category. This leadership is attributed to the high incidence of postoperative adhesion formation, particularly in abdominal and pelvic surgeries, where tissues are frequently manipulated.
Anti-adhesion gels have become standard adjuncts in these scenarios due to their ability to reduce adhesion severity and improve post-surgical recovery. Enhanced procedural outcomes, reduced length of stay, and fewer follow-up surgeries have positioned surgical usage as the most value-generating category.
As procedure-specific formulations and indication-based product lines are launched, the adoption rate is anticipated to further increase across global surgical practices.
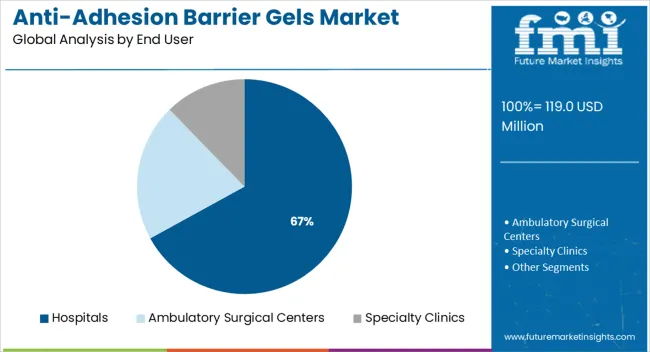
Hospitals are anticipated to account for 67.0% of the total market revenue in 2025, making them the primary end user of anti-adhesion barrier gels. This dominance is driven by the high concentration of complex surgical procedures performed in hospital settings, where the use of advanced intraoperative materials is strongly emphasized.
Centralized purchasing, protocol-driven surgical standards, and surgeon familiarity with branded adhesion prevention solutions have bolstered uptake in this segment. Moreover, hospitals often serve as early adopters of innovative formulations due to their access to surgical specialists, training programs, and institutional support for evidence-based products.
As reimbursement systems increasingly favor interventions that reduce complication rates, hospitals are expected to continue leading demand for anti-adhesion technologies.
The global sales of the anti-adhesion barrier gels market are anticipated to rise at a CAGR of 8.4% between 2025 and 2035, owing to the Increase in the volume of sports-related injuries and subsequent surgeries.
The global anti-adhesion barrier gels market holds around 8.7% share of the overall global adhesion barriers market with an approximate value of around USD 1.0 Billion.
The incidence of accidental injuries has increased drastically over the last decade. Every year nearly 7 lacs or more children of age group 14 and younger are treated for injuries related to sports in hospital emergency rooms. The increasing number of leg-related accidents and adhesion is anticipated to further spur the demand for adhesion barrier gel and drive the global market over the forecast period.
The rising incidence of injuries at workplaces has also resulted in high demand for adhesion barrier gel. Among American children, traumatic brain injuries due to recreational activities are approximately 21 percent of all TBI cases.
There has been a noticeable rise in the number of cancer patients, patients with osteoporosis, arthritis, cardiovascular diseases, burns, and trauma cases. The target pool of patients undergoing fracture repair surgery, spine surgery, arthroplasty surgery, and coronary artery bypass grafting has been on a consistent rise.
Hence, a large target patient pool, with a consistent rise in chronic diseases, and patients requiring adhesion barriers during the operating procedure are projected to create numerous opportunities for manufacturers in the global anti-adhesion barrier gels market.
Thus, owing to the above-mentioned factors, the global anti-adhesion barrier gels market is expected to grow at a lucrative pace, and reach a valuation of around USD 266.5 Million during the year 2035.
The market for anti-adhesion barrier gels is anticipated to expand due to the growing need and demand for adhesion prevention and the growing incidence of Adhesive Small Bowel Obstruction (ASBO).
Post-surgical adhesions in pelvic and abdominal surgeries are becoming a common concern for physicians as well as for patients. For instance, as per the latest publication of Cellmid Limited - a developer of midkine antibodies for adhesion treatment, 95% of abdominal surgeries eventually lead to complications arising from tissue adhesions and 6% of cases lead to readmission.
Intra-abdominal adhesions are the most common and serious cause of small bowel obstruction (SBO) and 65-75% of SBO cases are associated with postoperative adhesions. As per survey results from the Department of Surgery, University of Calgary, 5.7% of hospital readmissions in Canada are related to adhesions and 3.8% of them require surgical management
Investing in business inorganically has been the hallmark to bring strong business growth and most players in the adhesion barriers market are following this trend, which directly contributes to revenue growth, increasing product portfolio, and expanding presence and distribution network in different geographies.
In both open and laparoscopic surgery, adhesion barriers lower the incidence of adhesion and the incidence of adhesion small intestinal obstruction. Compared to open surgery with no adhesion barrier, costs are lower. In laparoscopic procedures, the use of anti-adhesion barriers can be economically advantageous.
Additionally, adhesion barriers are the most effective at preventing post-operative adhesions in cardiovascular procedures due to their high penetration rate.
The market for anti-adhesion barrier gels is expected to grow as a result of the rise in the number of surgical procedures in different medical streams. However, some elements may limit its capacity to expand.
The high cost of surgeries along with the cost of adhesion barriers that are used in surgery or post-surgery is expected to hamper the growth of the adhesion barriers market in most emerging countries. This is mainly because there is a limitation in proper reimbursement scenarios for using adhesion barrier-based surgery.
Surgeons are reluctant to utilize adhesion barriers despite being aware of the harmful effect of adhesion because there is a dearth of limited solid clinical evidence demonstrating the efficacy and safety of commercially available adhesion barrier solutions.
Adhesion barrier safety and effectiveness problems can make it challenging for businesses to obtain marketing permits for their goods. Additionally, because of inadequate clinical results, licensed adhesion barrier products have been removed from the market during the past few years.
All these factors are expected to hamper the growth of the anti-adhesion barrier gels market over the forecast duration.
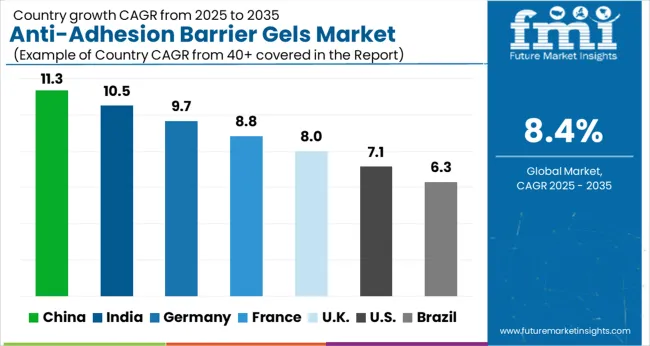
The USA dominates the North American region with a total market share of around 90.5% in 2024 and is expected to continue to experience the same growth throughout the forecast period.
In the USA, more than 9 lacs of cardiac surgeries are performed annually. The development of numerous underlying techniques is fueling the rapid growth of the USA cardiac surgery market which is expected to significantly boost the anti-adhesion barrier gels market.
Similarly, there are also an increased number of sports activities and participation in the USA as compared to the other regions. Hence the use of anti-adhesion barrier gels is more here and will continue the same trend in the future years as well.
India holds the highest market share of 50.2% in the South Asia region and will expand with growing numbers in the future.
Due to its enormous population and expanding healthcare industry, India is the most profitable healthcare market. The prevalence of these diseases is developing in this area at an alarming speed due to the vast and expanding population. The requirement for better healthcare facilities, medical devices, and innovations in the area is being driven by the region's rapidly aging population, the epidemiological transition from infectious to chronic diseases, rising life expectancy, expansion of private hospitals in rural areas, and rising demand for surgical interventions.
Germany held a market share of around 20.3% in the European market in 2024 and is expected to expand at a CAGR of about 9.5%.
Germany also has an increasing rate of surgeries in the European region. There are a high number of gynaecological surgeries performed every year in Germany which utilizes these products at large numbers, and hence, this region will show lucrative growth in the forecast years in the anti-adhesion barrier gels market.
The hyaluronic acid segment is leading the global market with a 42.2% revenue share in 2024 and is expected to give high growth at a CAGR rate of 9.8% by the end of the forecast period.
Use of hyaluronic acid, particularly among women of childbearing age, to stop the deteriorating impact of postsurgical adhesion on fertility. A key contributing factor to postoperative intestinal blockage, abdominal pain, and infertility is intraperitoneal adhesions. Hyaluronic acid creates an anti-adhesion barrier by adhering to the abdomen wall and tissue surface. The properties and application of hyaluronic acid make it the most demanded product.
Surgical Applications held the highest market share value of 65.3% in the year 2024. Surgeries are increasing at a rapid rate due to the prevailing chronic diseases worldwide.
Adhesion barrier gels are used to minimize aberrant internal scarring (adhesions) after surgery or during surgery. Application of the adhesion barrier gel during spine surgeries; such as lumbar laminectomy or laminotomy is simple and takes only seconds.
The gel coats and isolates nerve fibers and dura, serving as a protective physical barrier that can reduce the formation of epidural fibrosis (adhesions) and can limit the exposure of nerves to biochemical irritants produced during surgery that may cause pain.
Hospitals held the highest market share value of 66.5% during the year 2024. Hospitals are the primary places where complicated and technologically advanced surgical procedures are undertaken. The large number of surgical procedures in hospitals together with growing awareness about the usage of anti-adhesion barrier gels during surgical procedures have made it a dominant end user.
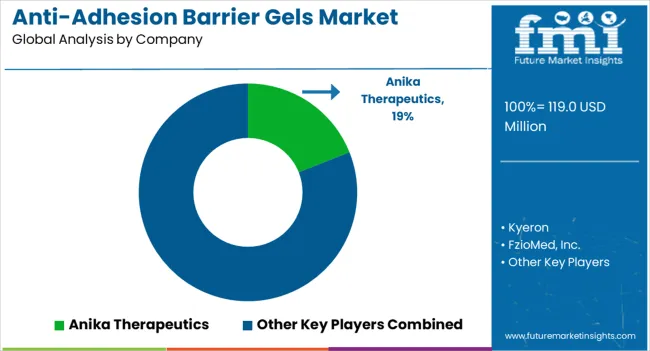
Manufacturers compete on pricing by combining their products in economical packages. A rise in awareness has transformed the market's dynamics. Big manufacturers are starting to grow their businesses by making sizeable investments in companies that manufacture anti-adhesion barrier gels, as stated hereunder.
Similarly, recent developments related to companies manufacturing anti-adhesion barrier gels products have been tracked by the team. These are available in Future Market Insights, full report.
| Attribute | Details |
|---|---|
| Forecast Period | 2025 to 2035 |
| Historical Data Available for | 2020 to 2024 |
| Market Analysis | USD Million for Value |
| Key Regions Covered | North America, Latin America, Europe, South Asia, East Asia, Oceania, and Middle East & Africa |
| Key Countries Covered | USA, Canada, Brazil, Mexico, Argentina, UK, Germany, Italy, Russia, Spain, France, BENELUX, India, Thailand, Indonesia, Malaysia, Japan, China, South Korea, Australia, New Zealand, Turkey, GCC Countries, North Africa, and South Africa |
| Key Market Segments Covered | Product, Application, End User, and Region |
| Key Companies Profiled | LG Chem Life Sciences Company; Anika Therapeutics; FzioMed, Inc.; Normedi Nordic; Betatech; Bioscompass; Klas; Terumo; BioRegen Biomedical; CGBIO; Shing Poong Pharma Co.LTD; Hangzhou Singclean Medical Products Co., Ltd.; Genewel; Kyeron; Hanohai Biological; PlantTec Medical GmbH |
| Pricing | Available upon Request |
The global anti-adhesion barrier gels market is estimated to be valued at USD 119.0 million in 2025.
The market size for the anti-adhesion barrier gels market is projected to reach USD 266.5 million by 2035.
The anti-adhesion barrier gels market is expected to grow at a 8.4% CAGR between 2025 and 2035.
The key product types in anti-adhesion barrier gels market are hyaluronic acid, carboxymethylcellulose and polyethylene oxides.
In terms of application category, surgical applications segment to command 82.0% share in the anti-adhesion barrier gels market in 2025.


Our Research Products

The "Full Research Suite" delivers actionable market intel, deep dives on markets or technologies, so clients act faster, cut risk, and unlock growth.

The Leaderboard benchmarks and ranks top vendors, classifying them as Established Leaders, Leading Challengers, or Disruptors & Challengers.

Locates where complements amplify value and substitutes erode it, forecasting net impact by horizon

We deliver granular, decision-grade intel: market sizing, 5-year forecasts, pricing, adoption, usage, revenue, and operational KPIs—plus competitor tracking, regulation, and value chains—across 60 countries broadly.

Spot the shifts before they hit your P&L. We track inflection points, adoption curves, pricing moves, and ecosystem plays to show where demand is heading, why it is changing, and what to do next across high-growth markets and disruptive tech

Real-time reads of user behavior. We track shifting priorities, perceptions of today’s and next-gen services, and provider experience, then pace how fast tech moves from trial to adoption, blending buyer, consumer, and channel inputs with social signals (#WhySwitch, #UX).

Partner with our analyst team to build a custom report designed around your business priorities. From analysing market trends to assessing competitors or crafting bespoke datasets, we tailor insights to your needs.
Supplier Intelligence
Discovery & Profiling
Capacity & Footprint
Performance & Risk
Compliance & Governance
Commercial Readiness
Who Supplies Whom
Scorecards & Shortlists
Playbooks & Docs
Category Intelligence
Definition & Scope
Demand & Use Cases
Cost Drivers
Market Structure
Supply Chain Map
Trade & Policy
Operating Norms
Deliverables
Buyer Intelligence
Account Basics
Spend & Scope
Procurement Model
Vendor Requirements
Terms & Policies
Entry Strategy
Pain Points & Triggers
Outputs
Pricing Analysis
Benchmarks
Trends
Should-Cost
Indexation
Landed Cost
Commercial Terms
Deliverables
Brand Analysis
Positioning & Value Prop
Share & Presence
Customer Evidence
Go-to-Market
Digital & Reputation
Compliance & Trust
KPIs & Gaps
Outputs
Full Research Suite comprises of:
Market outlook & trends analysis
Interviews & case studies
Strategic recommendations
Vendor profiles & capabilities analysis
5-year forecasts
8 regions and 60+ country-level data splits
Market segment data splits
12 months of continuous data updates
DELIVERED AS:
PDF EXCEL ONLINE
Barrier System Market Forecast Outlook 2025 to 2035
Barrier Packaging Market Size and Share Forecast Outlook 2025 to 2035
Barrier Coated Papers Market Size and Share Forecast Outlook 2025 to 2035
Barrier Tube Packaging Market Size and Share Forecast Outlook 2025 to 2035
Barrier Resins Market Size and Share Forecast Outlook 2025 to 2035
Barrier Material Market Size and Share Forecast Outlook 2025 to 2035
Barrier Shrink Bags Market Analysis - Size, Share, and Forecast 2025 to 2035
Barrier Coated Paper Industry Analysis in Europe - Demand, Growth & Future Outlook 2025 to 2035
Market Share Insights for Barrier Shrink Bag Providers
Key Players & Market Share in the Barrier Coated Paper Industry
Barrier Coatings for Packaging Market Trends - Growth & Forecast 2025 to 2035
Competitive Landscape of Barrier Packaging Providers
Barrier Film Market Trends & Industry Growth Forecast 2025 to 2035
Europe Barrier Packaging Market Growth – Demand & Forecast 2024-2034
Korea Barrier Coated Paper Market Growth – Trends & Forecast 2023-2033
Japan Barrier Coated Paper Market Growth – Trends & Forecast 2023-2033
Barrier Bags Market
USA Barrier Coated Paper Market Size and Share Forecast Outlook 2025 to 2035
Air Barrier Market Size and Share Forecast Outlook 2025 to 2035
Non-Barrier Bag Market Size and Share Forecast Outlook 2025 to 2035

Thank you!
You will receive an email from our Business Development Manager. Please be sure to check your SPAM/JUNK folder too.
Chat With
MaRIA