
- Market Size (2026)
- USD 816.4 Mn
- Forecast (2036)
- USD 1561.5 Mn
- CAGR (2026 to 2036)
- 6.7%
How big is Saccharin Market in 2026?
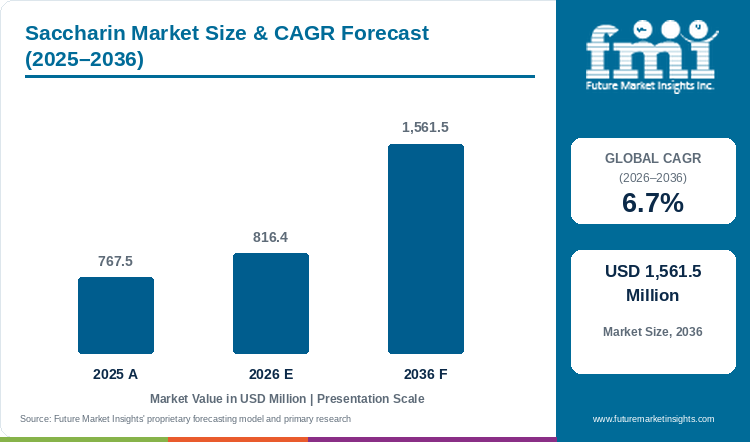
With a valuation of USD 767.5 million in 2025 and moving to USD 816.4 million in 2026, the saccharin market is positioned to attain USD 1,561.5 million by 2036, exhibiting a CAGR of 6.7%.
Soft drink bottlers and toothpaste manufacturers are expanding bulk saccharin procurement because national sugar taxes and updated European safety limits make saccharin the most cost-effective zero-calorie sweetener available. Global saccharin market valuation moved between a 2025 mark of USD 767.5 million and a 2026 mark of USD 816.4 million, while ten-year demand climbs to a 2036 target of USD 1,561.5 million under a 6.7% CAGR. Sodium Saccharin Dihydrate Crystalline captures 58.1% of 2026 chemical form demand because it dissolves rapidly in cold water and mixes easily into beverage syrups and mouthwashes. Commercial adoption accelerated after European food regulators raised the acceptable daily intake for E954 saccharin from 5 to 9 mg per kilogram of body weight, confirming that commercial beverage concentrations pose no health risk. Because saccharin delivers 300 times the sweetness of sugar at a fraction of the cost, demand is growing faster than broader soft drink reformulation systems at 4.1% CAGR. Ingredient suppliers are launching blended sweetness systems to help bottlers capture these savings, as Cargill demonstrated in September 2026 when it introduced its Sweetmix portfolio at Fi Asia. FMI market monitoring confirms that metallic aftertastes at high single-sweetener dosages require formulators to blend saccharin with co-sweeteners or flavor modulators through 2036.
Key Market Trends & Insights
- By chemical form: Sodium Saccharin Dihydrate Crystalline holds an estimated 58.1% share in 2026 because rapid cold-water solubility and zero caloric load simplify liquid beverage and oral-care compounding.
- By physical appearance: Granular White Free-Flowing Crystals represent 56.5% in 2026 as 20-to-40 mesh crystalline cuts prevent caking and dust bridging in industrial hoppers.
- By core application: Diet Carbonated Soft Drinks and Fountain Syrups account for 35.3% in 2026 because heat-stable fountain concentrates require non-hydrolyzing sweetness under acidic storage.
- By mesh & purity grade: USP and EP Pharmaceutical Grade secures 52.4% in 2026 owing to strict heavy-metal and ortho-toluenesulfonamide impurity limits below 10 ppm.
- By distribution channel: Direct to CPG and Pharma Manufacturers commands 55.2% in 2026 through multi-year quality audits and co-sweetener sensory calibration.
Regional Highlights
- Top national expansion: Mexico leads national growth projections at an 8.1% CAGR through 2036 under front-of-pack warning labels and carbonated beverage calorie-reduction taxes.
- Broader country progression: Brazil climbs at a 7.4% CAGR ahead of China at 7.1% and France at 6.5%, whereas the United Kingdom progresses at a 6.1% CAGR and Japan records 6.0%.
Market Size & Forecast
Table 1: Market Size and Forecast for the Saccharin Market (USD million and CAGR percentage), 2025 to 2036
| Metric | Value |
|---|---|
| 2025 Market Size | USD 767.5 million |
| Estimated Market Size in 2026 | USD 816.4 million |
| Projected Market Size by 2036 | USD 1,561.5 million |
| CAGR, 2026 to 2036 | 6.7% |
| Added Market Value, 2026 to 2036 | USD 745.1 million |
Beverage bottlers and pharmaceutical syrup producers face a persistent shelf-life problem when heat-sensitive sweeteners such as aspartame break down and lose sweetness inside warm warehouses. Saccharin remains stable across acidic soft drinks and high-temperature processing, which allows manufacturers to guarantee consistent sweetness over a six-month retail shelf life. Because of this stability and low cost per sweetness unit, beverage formulators use sodium saccharin to anchor low-calorie drink recipes. In October 2025, an analytical survey in the International Journal of Environmental Research and Public Health tested 43 commercial soft drinks and found saccharin in 44.2% of samples at a median level of 19.76 mg/L. These findings show how bottlers routinely pair saccharin with high-intensity sweeteners to keep retail drink prices affordable while staying well below legal limits.
Sweetened-Product and Active-Dosage Sizing
Table 2: Sweetened-Product and Active-Dosage Sizing for the Saccharin Market (USD million and operational ranges), 2025 to 2036
| Metric | 2025 | 2026 | 2036 |
|---|---|---|---|
| Market size (USD million) | 767.5 | 816.4 | 1,561.5 |
| Sweetened beverage & oral-care volume (million metric tons) | 142.0 to 156.0 | 150.5 to 165.0 | 275.0 to 302.0 |
| Commercial saccharin salt volume (thousand metric tons) | 46.5 to 51.0 | 49.2 to 54.0 | 88.5 to 97.0 |
| Sweetening cost per metric ton of finished product (USD) | 5.1 to 5.6 | 5.2 to 5.7 | 5.4 to 6.0 |
Operational note: Sweetened-volume ranges apply standard 15 to 100 mg/L saccharin dosing in diet beverages and 500 to 2,500 mg/kg in oral-care dentifrices and pharmaceutical syrups.
Toothpaste manufacturers and chewable tablet producers require non-fermenting sweeteners that do not promote tooth decay or react with fluoride and mineral abrasives during tube storage. Natural sugars ferment in oral bacteria and cause browning reactions in compressed tablets, whereas sodium saccharin remains chemically inert. Consequently, global oral-care and pharmaceutical brands combine purified saccharin with sugar substitutes such as sorbitol to mask bitter active ingredients in toothpaste and pediatric syrups.
Per Capita & Commercial Bottling and Oral-Care Line Sizing
Table 3: Per Capita and Formulation Line Market Value Indicators for the Saccharin Market (USD), 2025 to 2036
| Metric | 2025 | 2026 | 2036 |
|---|---|---|---|
| Global population (billion) | 8.2 | 8.3 | 9.0 |
| Market value per 1,000 people (USD) | 93.6 | 98.4 | 173.5 |
| Annual market value per formulation line (USD thousand) | 24.8 to 27.5 | 26.3 to 29.2 | 48.0 to 53.5 |
| Co-blended & pharmaceutical USP/EP share (%) | 62.0% to 66.0% | 64.0% to 68.0% | 74.0% to 78.0% |
Table 4: Industrial Formulation Line & Channel Indicators for the Saccharin Market (USD and percentages), 2026
| Metric | Value | Institutional Reference Basis |
|---|---|---|
| Market size, 2026 | USD 816.4 million | 2026 global market value baseline |
| Commercial beverage, oral-care & plating lines | 29,500 lines | Global diet bottling, toothpaste, pharma & plating plants |
| Market value per formulation line | USD 27,674.6 | Annualized saccharin procurement per line |
| Direct to CPG and Pharma value, 2026 | USD 450.7 million | 55.2% distribution channel allocation |
When beverage formulators use saccharin alone at high concentrations, consumers notice a lingering metallic aftertaste that limits repeat purchases of zero-sugar drinks. To solve this sensory hurdle without giving up saccharin's low cost, R&D teams blend sodium saccharin at a 1-to-10 ratio with cyclamate or stevia glycosides so the two sweeteners mask each other's off-notes. Bottlers also pair these blends with sugar reduction mouthfeel recovery additives so diet fountain sodas replicate the syrupy body of full-sugar drinks.
Analyst Perspective
"Beverage and oral-care buyers no longer treat saccharin as an outdated tabletop packet filler because EFSA's decision to raise the safe daily intake to 9 mg/kg has unlocked major cost savings in European and Latin American reformulation. Suppliers that combine high-purity Maumee-route saccharin with bitter-masking co-sweeteners will win large-volume contracts across soft drink and toothpaste plants."
- Nandini Roy Choudhury, Principal Consultant, Future Market Insights.
How is the saccharin market segmented?
The saccharin market is segmented by chemical form, physical appearance, core application, mesh and purity grade, and distribution channel. In 2026, Sodium Saccharin Dihydrate Crystalline is projected at 58.1%, Granular White Free-Flowing Crystals at 56.5%, Diet Carbonated Soft Drinks and Fountain Syrups at 35.3%, USP and EP Pharmaceutical Grade at 52.4%, and Direct to CPG and Pharma Manufacturers at 55.2%.
By chemical form: Sodium Saccharin Dihydrate Crystalline and Calcium Saccharin Low-Sodium Formulation lead demand. Insoluble Acid Saccharin and Potassium Saccharin Specialty Salt complete the category.
By physical appearance: Granular White Free-Flowing Crystals and Spray-Dried Soluble Fine Powder anchor commercial supply. Compressed Tabletop Effervescent Tablets and Aqueous Liquid Sweetener Concentrates serve retail and liquid lines.
By core application: Diet Carbonated Soft Drinks and Fountain Syrups and Tabletop Sweetener Pink Sachets and Tablets represent primary volume. Oral Care Toothpastes and Breath Sprays and Pharmaceutical Syrups and Electroplating Additive capture specialty demand.
By mesh & purity grade: USP and EP Pharmaceutical Grade and FCC Food and Beverage Grade lead procurement. Industrial Bright Nickel Electroplating Grade and Feed Palatability Sweetener Grade serve technical markets.
By distribution channel: Direct to CPG and Pharma Manufacturers and Specialty Chemical and Food Ingredient Distributors handle bulk contracts. Retail Private-Label Co-Packers and Online B2B Chemical Procurement supply secondary accounts.
Why does Sodium Saccharin Dihydrate Crystalline lead the chemical form category?
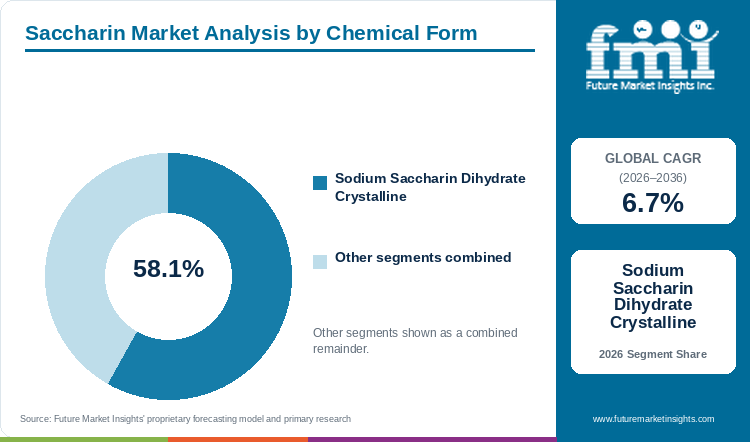
Sodium Saccharin Dihydrate Crystalline holds an estimated 58.1% of chemical form demand in 2026, anchored by 1,000 g/L cold-water solubility and 300-fold sweetness potency.
Table 5: Chemical Form Share for the Saccharin Market (percentage share), 2026
| Chemical Form | Share (2026) |
|---|---|
| Sodium Saccharin Dihydrate Crystalline | 58.1% |
| Other Segments Combined | 41.9%* |
| Total | 100.0% |
*Note: Remaining chemical form categories account for the balance of 2026 global saccharin demand.
Table 6: Chemical Form Leadership and Market Growth for the Saccharin Market (segment and CAGR percentage), 2026 to 2036
| Metric | Value |
|---|---|
| Global CAGR (2026 to 2036) | 6.7% |
| Leading Segment | Sodium Saccharin Dihydrate Crystalline |
Sodium Saccharin Dihydrate Crystalline leads the chemical form segment because it dissolves at up to 1,000 grams per liter of water at room temperature, whereas insoluble acid saccharin barely dissolves without alkali neutralization. Beverage syrup rooms and mouthwash plants operating continuous mixing tanks need a sweetener salt that dissolves instantly without heating kettles or clogging inline filters. High-volume buyers of sodium saccharin standardize on the crystalline sodium dihydrate form to speed up batch mixing and cut energy costs.
- Sodium Saccharin Dihydrate Crystalline holds 58.1% of chemical form value in 2026 because instant cold-water solubility and 300-fold sweetness potency streamline liquid batching.
- Updated additive regulations maintained by the FDA in February 2025 confirm that saccharin is approved across commercial beverages and tabletop sweeteners with an acceptable daily intake of 15 mg/kg body weight, supporting bulk sodium salt demand.
What sustains Granular White Free-Flowing Crystals leadership in the physical appearance segment?
Granular White Free-Flowing Crystals represent 56.5% of the physical appearance category in 2026, supported by dust-free hopper flow and low moisture caking.
Granular White Free-Flowing Crystals capture the largest share of physical appearance demand because 20-to-40 mesh crystals pour cleanly from bulk bags without creating dust clouds or caking in humid plants. Fine milled powders cling to stainless-steel hopper walls and require mechanical vibrators to discharge evenly into mixing vats. Tabletop co-packers and beverage blenders combining saccharin with low-calorie sweeteners prefer granular crystals for accurate high-speed packet filling and pneumatic conveying.
- Granular White Free-Flowing Crystals represent 56.5% of the physical appearance segment in 2026 as beverage and tabletop plants prioritize dust-free pneumatic conveying.
- To explain why processors favor crystalline saccharin over peptide sweeteners, a September 2025 review in Foods showed that crystalline saccharin retains 100% sweetness potency across high-heat baking and acidic beverage storage where aspartame degrades.
How do Diet Carbonated Soft Drinks and Fountain Syrups lead the core application category?
Diet Carbonated Soft Drinks and Fountain Syrups account for 35.3% of core application demand in 2026, driven by acidic shelf stability in post-mix fountain syrups.
Diet Carbonated Soft Drinks and Fountain Syrups represent the largest application because post-mix fountain syrups shipped in unrefrigerated bags require an acid-stable sweetener that never loses potency. In price-sensitive Latin American and Asian markets, soft drink bottlers face steep sugar excise taxes as well as consumer resistance to price hikes. Manufacturers of soft drinks concentrates blend 20 to 80 mg/L of sodium saccharin with sucralose or acesulfame potassium to cut syrup sweetening costs by 35% to 45%.
- Diet Carbonated Soft Drinks and Fountain Syrups account for 35.3% of core application demand in 2026 because fountain bag-in-box syrups require acid-stable zero-calorie sweetness.
- This commercial blending practice was confirmed in October 2025 when a liquid-chromatography study in Applied Sciences analyzed retail carbonated drinks and verified widespread co-formulation of saccharin and cyclamate for stable shelf-life sweetness.
Why does USP and EP Pharmaceutical Grade lead the mesh & purity grade category?
USP and EP Pharmaceutical Grade secures 52.4% of mesh and purity grade value in 2026, supported by Maumee-route synthesis and oral-care and drug monograph compliance.
USP and EP Pharmaceutical Grade leads mesh and purity demand because multinational toothpaste and drug manufacturers require ortho-toluenesulfonamide impurities to remain below 10 parts per million. Rather than stocking separate technical and food grades across multiple warehouses, global consumer-health companies purchase USP and EP grade saccharin via the phthalic anhydride Maumee process for both oral-care and beverage lines.
- USP and EP Pharmaceutical Grade secures 52.4% of mesh and purity grade demand in 2026 as oral-care and drug formulators enforce sub-10-ppm sulfonamide impurity caps.
- In September 2026, a dental study in the Journal of Esthetic and Restorative Dentistry evaluated commercial whitening toothpastes sweetened with sodium saccharin and confirmed stable enamel color and pH performance across repeated brushing.
What gives Direct to CPG and Pharma Manufacturers the leading position in distribution channel?
Direct to CPG and Pharma Manufacturers commands 55.2% of distribution channel share in 2026, anchored by enterprise quality audits and co-sweetener calibration.
Direct to CPG and Pharma Manufacturers accounts for 55.2% of distribution channel value because major soft drink and toothpaste brands audit sweetener plants directly for quality and food-safety compliance. Large buyers also rely on direct supplier application labs to calibrate exact co-sweetener ratios that mask metallic aftertaste in their specific cola or dentifrice bases.
- Direct to CPG and Pharma Manufacturers commands 55.2% of distribution channel value in 2026 because enterprise beverage and oral-care brands require direct supplier quality audits.
- Direct reformulation demand was highlighted in March 2026 when Ingredion Incorporated published a consumer survey showing that 40% of shoppers increased purchases of reduced-sugar products in 2025, driving direct CPG partnerships.
What are the drivers, restraints, and opportunities in the saccharin market?
In the saccharin market, EFSA's 9 mg/kg bw/day ADI expansion and national beverage sugar taxes are projected to drive adoption whereas TAS2R bitter-receptor activation restrains high standalone dosing and nickel electroplating and antimicrobial wound hydrogels create new growth opportunities.
- Driver: European food safety upgrades raising the E954 acceptable daily intake from 5 to 9 mg/kg body weight and national beverage sugar taxes accelerate low-cost saccharin adoption.
- Restraint: Activation of human TAS2R31 and TAS2R43 bitter taste receptors at high concentrations produces a metallic aftertaste that requires co-sweetener blending or flavor modulators.
- Opportunity: Antibacterial wound-hydrogel applications and Class I bright-nickel electroplating grain refiners for EV battery busbars open high-margin non-food demand.
Growth Analysis and Future Potential: Qualitative Demand Catalysts
Regulatory upgrades in Europe have removed decades-old safety concerns around saccharin and opened a major reformulation wave across beverage and condiment brands. For years, European food makers limited E954 saccharin use because the old 5 mg/kg intake limit was based on 1970s rat studies that scientists later proved were irrelevant to human digestion. Higher European safe intake thresholds of 9 mg/kg allow beverage packers to blend sodium saccharin with intensive sweeteners and cut sugar content by 30% to 50% without raising retail prices. In November 2025, a toxicological review in Food and Chemical Toxicology confirmed the complete absence of DNA damage or cancer risk for saccharin in humans under FDA and EFSA guidelines.
Risk Assessment of the Saccharin Market: Operational and Formulation Friction
Metallic and bitter aftertastes noticed by consumers when saccharin is used above 100 milligrams per liter remain the main factor restraining standalone adoption in premium drinks. While sodium saccharin provides fast initial sweetness at low dosages, higher concentrations stimulate bitter taste receptors on the tongue and leave a metallic finish. On the supply side, environmental wastewater rules in China also restrict older toluene-chlorosulfonation factories that generate high salt and sulfonamide effluent. A June 2026 clinical review in Medicina examined synthetic sweeteners and explained how saccharin's bitter receptor activation requires formulators to cap standalone dosage and blend with taste modulators. Beverage brands developing clean-label syrups and natural sweetener syrups therefore limit saccharin to binary or ternary blends.
Commercial Opportunity Analysis: Formulation Differentiation and Value-Add Formats
Suppliers are expanding beyond food and beverages by marketing high-purity sodium saccharin into industrial nickel electroplating baths and medical wound-care dressings. In electric-vehicle battery busbars and automotive fasteners, electroplaters dose sodium saccharin into nickel plating baths as a primary brightener that refines metal crystal grains and prevents brittle coating stress. At the same time, medical researchers are discovering unexpected antibacterial benefits in topical hydrogels. Industrial demand across metal electroplating baths is now joined by wound-care development. In May 2025, microbiologists publishing in EMBO Molecular Medicine demonstrated that 1.4% to 2.0% saccharin breaks down bacterial cell walls and reduces drug-resistant Pseudomonas aeruginosa and Acinetobacter baumannii growth by more than 70% in wound hydrogels.
Saccharin Market by Country (2026 to 2036)
FMI country modeling indicates that Mexico leads saccharin market value growth at an 8.1% CAGR through 2036, ahead of Brazil at 7.4% and China at 7.1%. France follows at 6.5% and the United States tracks at 6.4%, while Germany records 6.2% ahead of the United Kingdom at 6.1% and Japan at 6.0%. National growth differences reflect beverage sugar tax rates and cyclamate blending rules as well as domestic pharmaceutical and electroplating output.
Table 7: Country CAGR and Primary Growth Levers for the Saccharin Market (CAGR percentage and operational drivers), 2026 to 2036
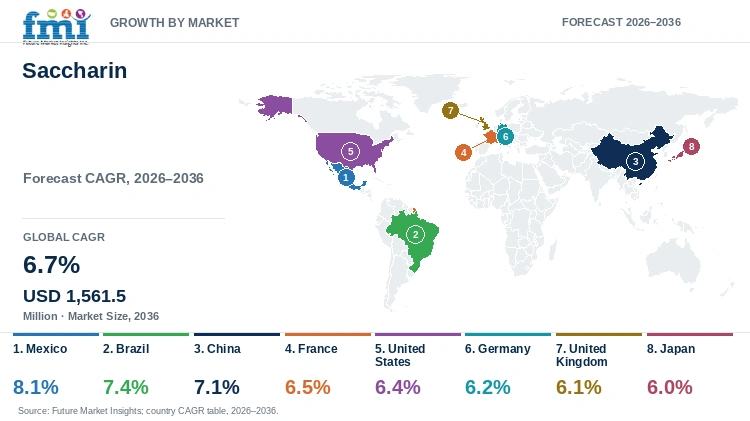
| Country | CAGR (2026 to 2036) | Primary Growth Lever |
|---|---|---|
| Mexico | 8.1% | NOM-051 octagonal warning labels and IEPS beverage tax reformulation |
| Brazil | 7.4% | ANVISA-authorized 1-to-10 saccharin-cyclamate liquid tabletop drops and diet sodas |
| China | 7.1% | EV bright-nickel electroplating baths and domestic oral-care and beverage compounding |
| France | 6.5% | EFSA E954 ADI doubling, Nutri-Score beverage reformulation, and pharma syrups |
| United States | 6.4% | Foodservice pink tabletop sachets, USP dentifrices, and FDA sugar-claim rules |
| Germany | 6.2% | Discount-retail diet sodas, tabletop Süßstoff tablets, and automotive plating |
| United Kingdom | 6.1% | Soft Drinks Industry Levy thresholds and supermarket HFSS reformulation |
| Japan | 6.0% | Medicated oral-care toothpastes, pickled food brines, and electronics plating |
Source: Future Market Insights analysis
Mexico Saccharin Market Outlook (2026 to 2036)
Mexico leads global saccharin growth at an 8.1% CAGR through 2036 because strict front-of-pack warning labels and beverage excise taxes push bottlers toward low-cost calorie reduction. Under Mexico's NOM-051 labeling rules, drinks and snacks exceeding sugar thresholds must display black octagonal warning seals, while sweetened beverages also pay a per-liter excise tax. Because Mexican households buy large volumes of value-tier carbonated sodas and powdered drink mixes through traditional neighborhood stores, bottlers cannot pass on the high cost of stevia or allulose. April 2026 Mexico City attaché food processing data verify that over 2,000 domestic beverage and snack plants are actively reformulating recipes to control ingredient costs.
Key takeaway: In Mexico, NOM-051 warning-label reformulation and price-sensitive diet soda bottling are projected to power a leading 8.1% CAGR.
Brazil Saccharin Market Outlook (2026 to 2036)
Brazil climbs at a 7.4% rate to 2036 since national food additive rules allow a popular 1-to-10 blend of sodium saccharin and sodium cyclamate in liquid tabletop drops and diet sodas. Unlike the United States where cyclamate is banned, Brazil's health agency ANVISA permits beverage and tabletop brands to combine both sweeteners, which eliminates saccharin's metallic aftertaste at a very low formulation cost. Liquid sweetener drop bottles sit on almost every Brazilian restaurant and kitchen table for sweetening coffee and fresh fruit juices. As noted in the March 2026 USDA GAIN Brazil Food Processing Ingredients Annual report, front-of-pack high-sugar warning labels are accelerating low-calorie beverage reformulation across Sao Paulo processors.
Key takeaway: In Brazil, ANVISA-approved cyclamate-saccharin liquid tabletop blends and front-of-pack sugar labels are expected to maintain a 7.4% CAGR.
China Saccharin Market Outlook (2026 to 2036)
China records a 7.1% CAGR to 2036 because the country operates as the world's primary manufacturing base for sodium and insoluble saccharin while rapidly expanding domestic electric-vehicle electroplating. Although Chinese GB 2760 food standards restrict saccharin in certain fermented foods, domestic consumption is climbing rapidly across bright-nickel electroplating baths used for EV battery connectors and consumer electronics. On the food and oral-care side, Chinese toothpaste plants and preserved-fruit packers remain major bulk buyers of crystalline sodium saccharin. April 2026 Beijing attaché sugar balances project domestic sugar output at 12.7 million metric tons for 2026/27 while industrial beverage makers diversify into high-intensity sweeteners to reduce raw material costs.
Key takeaway: In China, electric-vehicle nickel electroplating and domestic toothpaste and beverage manufacturing are forecast to generate a 7.1% CAGR.
France Saccharin Market Outlook (2026 to 2036)
In France, saccharin demand climbs at a 6.5% CAGR through 2036 as pharmaceutical contract manufacturers and private-label beverage packers respond to EFSA's raised E954 safety threshold. France is a leading European producer of effervescent vitamin tablets and pediatric pain-relief syrups, where European Pharmacopoeia grade saccharin provides compact sweetness that does not react with active pharmaceutical ingredients. Meanwhile, French supermarket chains penalize high-sugar drinks under the updated Nutri-Score front-of-pack rating system and progressive soda taxes. April 2026 Paris attaché food processing statistics note that between 17,000 and 18,000 French food processing companies operate nationwide with strong demand for sugar-reduction ingredients.
Key takeaway: In France, Nutri-Score beverage reformulation and effervescent pharmaceutical production are anticipated to sustain a 6.5% CAGR.
United States Saccharin Market Outlook (2026 to 2036)
Consumption patterns in the United States differ from Europe since domestic demand relies on Maumee-route chemical synthesis in Ohio along with fluoride toothpastes and pink tabletop packets. Oral-care manufacturers and chewable drug makers in the United States prefer domestically synthesized USP-grade sodium and acid saccharin to avoid import tariffs and guarantee zero ortho-toluenesulfonamide contamination. In January 2026, a genomic toxicology study in Toxicology Reports analyzed human genetic datasets and found zero causal link between sodium saccharin intake and human cancers. Stricter federal added-sugar limits on healthy package claims further sustain a 6.4% growth rate across North American retail channels through 2036.
Key takeaway: Within the United States, domestic Maumee-route USP synthesis for oral care and tabletop packets is estimated to sustain a 6.4% CAGR.
Germany Saccharin Market Outlook (2026 to 2036)
Germany progresses at a 6.2% CAGR from 2026 to 2036 because German households consume Europe's highest volume of compressed cyclamate-saccharin dispenser tablets for hot coffee and tea. At the same time, Germany's dominant hard-discount grocery chains rely on low-cost E954 saccharin blends to keep private-label zero-sugar colas and lemonades priced well below branded sodas. Outside the food sector, metal-finishing shops across Baden-Wurttemberg and North Rhine-Westphalia purchase technical-grade sodium saccharin as a stress reliever for automotive nickel electroplating baths. March 2026 Berlin attaché food processing records show that Germany's food processing industry ranks fourth largest globally and continues expanding reduced-sugar private-label offerings.
Key takeaway: In Germany, discount-retail diet drinks and tabletop dispenser tablets with automotive electroplating are slated to deliver a 6.2% CAGR.
United Kingdom Saccharin Market Outlook (2026 to 2036)
British saccharin demand advances on a 6.1% rate to 2036 since the Soft Drinks Industry Levy and supermarket checkout bans on high-sugar foods force beverage makers to keep sugar below 5 grams per 100 milliliters. British fruit-squash concentrates and value tonic waters use sodium saccharin blended with sucralose or acesulfame-K so concentrated syrups stay sweet after consumers dilute them with tap water. March 2026 British attaché food processing surveys verify that British food and drink manufacturers continue reformulating grocery lines to meet strict HFSS promotional rules. Domestic medicated mouthwash and private-label toothpaste plants provide steady additional demand for British Pharmacopoeia grade saccharin.
Key takeaway: In the United Kingdom, Soft Drinks Industry Levy thresholds and diluted fruit-squash reformulation are likely to maintain a 6.1% CAGR.
Japan Saccharin Market Outlook (2026 to 2036)
Japan expands at a 6.0% CAGR through 2036 on specialized demand from pickled vegetable brines and medicated toothpastes as well as precision electronics electroplating. Unlike sugar that ferments and turns brown in salt-pickled radish and cucumber brines, sodium saccharin authorized under Japanese food additive standards keeps traditional tsukemono pickles crisp and sweet during storage. Japanese semiconductor lead-frame and multilayer ceramic capacitor manufacturers also purchase ultra-pure, low-chloride sodium saccharin to control stress in micro-nickel plating baths. April 2026 Tokyo attaché food sector statistics indicate that Japan's USD 174 billion food processing sector recorded growing demand for soft drinks and health-oriented products in 2025.
Key takeaway: In Japan, non-browning pickled vegetable brines and electronics nickel plating with oral care are predicted to anchor a 6.0% CAGR.
Full report country CAGRs cover North America and Latin America with Western Europe and Eastern Europe. Coverage also spans East Asia and South Asia and Pacific with Middle East and Africa.
Who are the notable companies in the saccharin market?
Cargill Incorporated, International Flavors and Fragrances Inc., Kerry Group plc, Ingredion Incorporated, Tate and Lyle plc, Roquette Freres SA, Novonesis, PMC Specialties Group Inc., Shanghai Fortune Chemical Co., Ltd., and Kaifeng Xinghua Fine Chemical Ltd. are the notable companies in the saccharin market.
Market structure across the saccharin sector divides into primary benzoic sulfimide chemical synthesizers and global sweetness-system formulators as well as oral-care excipient specialists. PMC Specialties Group and Shanghai Fortune Chemical with Kaifeng Xinghua operate dedicated Maumee and Remsen-Fahlberg saccharin synthesis reactors. Meanwhile, Cargill and IFF with Kerry Group as well as Ingredion and Tate and Lyle engineer multi-sweetener blends and bitter-masking flavor systems. Roquette Freres and Novonesis supply complementary polyol bulking agents and enzymatic sweetness solutions.
- Primary Saccharin and Benzoic Sulfimide Synthesizers: PMC Specialties Group and Shanghai Fortune Chemical with Kaifeng Xinghua manufacture bulk pharmaceutical and food-grade sodium and insoluble acid saccharin.
- Global Sugar-Reduction and Sweetener-System Formulators: Cargill and IFF with Kerry Group as well as Ingredion and Tate and Lyle blend high-intensity sweeteners with taste modulators.
- Adjacent Polyol Tableting and Biosolutions Specialists: Roquette Freres and Novonesis supply mannitol and sorbitol tableting excipients with enzymatic sugar-reduction biosolutions for oral care and food.
Competitive Benchmarking: Saccharin Market
Table 8: Competitive Benchmarking for the Saccharin Market (qualitative capability ratings), 2026
| Company | Documented Saccharin Synthesis or Blending | Beverage & Oral-Care Support | Bitter-Masking Fit | Geographic Reach |
|---|---|---|---|---|
| Cargill Incorporated | High | High | High | Global Sweetmix beverage and sweetener application centers across 70+ countries |
| International Flavors and Fragrances | Medium | High | High | Global Tastepoint and flavor modulation labs masking high-intensity bitter notes |
| Kerry Group plc | High | High | High | Global TasteSense sugar-reduction and beverage reformulation centers |
| Ingredion Incorporated | High | High | High | Global Sugar Reduction and Texture Solutions network expanded via Tate & Lyle offer |
| Tate and Lyle plc | High | High | High | Global sweetening and mouthfeel formulation labs across Europe, Americas, and APAC |
| Roquette Freres SA | Medium | High | High | Global pharmaceutical oral-dosage and sugar-free polyol tableting network |
| Novonesis | Medium | High | High | Global biosolutions and enzymatic sugar-reduction platforms across 30+ industries |
| PMC Specialties Group Inc. | High | Medium | Medium | Cincinnati, Ohio Maumee-process USP/FCC sodium and acid saccharin synthesizer |
| Shanghai Fortune Chemical Co. | High | Medium | Medium | Export-certified Chinese manufacturer of 20-to-80 mesh USP/EP sodium saccharin |
| Kaifeng Xinghua Fine Chemical | High | Medium | Medium | Large-scale Henan synthesizer of sodium, calcium, and insoluble acid saccharin |
Evaluation basis: Documented Saccharin Synthesis or Blending evaluates primary E954 chemical production or multi-sweetener compounding, whereas Beverage & Oral-Care Support rates sensory and pilot-carbonation labs. Taste Modulation Fit measures documented capability to suppress TAS2R metallic aftertaste via co-sweeteners or flavor modulators.
Key Developments in the Saccharin Market
- Ingredion Incorporated announced on August 4, 2026 that shareholders accepted its 595-pence-per-share acquisition offer for Tate and Lyle plc while reporting mid-to-high single-digit operating income growth in Texture and Healthful Solutions.
- Kerry Group plc published its sugar-tax reformulation technical framework on August 19, 2025 detailing how sweetness optimization systems replace sucrose across taxed beverage categories.
- Roquette Freres SA announced full-year 2025 financial results on March 19, 2026 highlighting resilient demand across pharmaceutical oral-dosage excipients and sugar-free polyol systems.
Key Players in the Saccharin Market
Primary Saccharin and Benzoic Sulfimide Synthesizers
- PMC Specialties Group Inc.
- Shanghai Fortune Chemical Co., Ltd.
- Kaifeng Xinghua Fine Chemical Ltd.
Global Sugar-Reduction and Sweetener-System Formulators
- Cargill Incorporated
- International Flavors and Fragrances Inc.
- Kerry Group plc
- Ingredion Incorporated
- Tate and Lyle plc
Adjacent Polyol Tableting and Biosolutions Specialists
- Roquette Freres SA
- Novonesis
Saccharin Market - Report Scope
Table 9: Report Scope for the Saccharin Market (coverage fields and definitions), 2026 to 2036
| Coverage field | Report scope |
|---|---|
| Market breakdown | Chemical Form; Physical Appearance; Core Application; Mesh & Purity Grade; Distribution Channel |
| Quantitative Units | USD Million |
| Market Definition | Includes commercial producer and formulator valuation from benzoic sulfimide and its salts (sodium saccharin dihydrate, anhydrous sodium saccharin, calcium saccharin, potassium saccharin, and insoluble acid saccharin, E954) across food, beverage, tabletop, oral-care, pharmaceutical, feed, and electroplating applications. Excludes standalone sucralose, aspartame, acesulfame-K, and stevia volumes. |
| Regions Covered | North America; Latin America; Western Europe; Eastern Europe; East Asia; South Asia and Pacific; Middle East and Africa |
| Countries Covered | Mexico, Brazil, China, France, United States, Germany, United Kingdom, Japan, and additional countries in the full report |
| Key Companies Covered | Cargill Incorporated, International Flavors and Fragrances Inc., Kerry Group plc, Ingredion Incorporated, Tate and Lyle plc, Roquette Freres SA, Novonesis, PMC Specialties Group Inc., Shanghai Fortune Chemical Co., Ltd., Kaifeng Xinghua Fine Chemical Ltd. |
| Forecast Period | 2026 to 2036 |
| Approach | Primary and secondary research with top-down and bottom-up market triangulation. |
Saccharin Market - Research Methodology
Table 10: Research Methodology for the Saccharin Market (research methods and approach), 2026 edition
| Method | Approach |
|---|---|
| Primary Research | Structured interviews with carbonated beverage R&D directors, oral-care dentifrice formulators, pharmaceutical excipient buyers, and bright-nickel electroplating chemists to validate mg/L and mg/kg dosing schedules. |
| Secondary Research | Analysis of EFSA FAF Panel E954 re-evaluation opinions (ADI 9 mg/kg bw/day), US FDA 21 CFR 180.37 food additive registries, USDA FAS Food Processing Ingredients and Sugar Annual reports, and peer-reviewed HPLC and toxicology studies. |
| Market Sizing and Forecasting | Top-down global high-intensity sweetener baselines reconciled against bottom-up sweetened beverage, tabletop packet, oral-care, pharma, and electroplating volumes (49.2K to 54.0K MT active saccharin in 2026) from 2026 to 2036. |
| Country Forecasting Model | Econometric national projections weight sugar-sweetened beverage excise taxes, front-of-pack warning mandates, cyclamate co-blending permissions, and electroplating industrial output across eight countries. |
| Operational Benchmark Traceability | Sweetened-volume and formulation-line indicators in Tables 2, 3, and 4 trace to EU Regulation 1333/2008 maximum permitted levels (80-100 mg/L in drinks, up to 3,000 mg/kg in foods) and HPLC beverage assays. |
| Data Triangulation and Validation | Valuation estimates isolate E954 saccharin salts and attributable co-sweetener blends while strictly excluding bulk sucrose, corn syrups, and non-saccharin synthetic sweeteners. |
Saccharin Market by Segments
Saccharin Market segmented by Chemical Form:
- Sodium Saccharin Dihydrate Crystalline
- Calcium Saccharin Low-Sodium Formulation
- Insoluble Acid Saccharin
- Potassium Saccharin Specialty Salt
Saccharin Market segmented by Physical Appearance:
- Granular White Free-Flowing Crystals
- Spray-Dried Soluble Fine Powder
- Compressed Tabletop Effervescent Tablets
- Aqueous Liquid Sweetener Concentrates
Saccharin Market segmented by Core Application:
- Diet Carbonated Soft Drinks and Fountain Syrups
- Tabletop Sweetener Pink Sachets and Tablets
- Oral Care Toothpastes and Breath Sprays
- Pharmaceutical Syrups and Electroplating Additive
- Bakery and Confectionery with Pickled Condiments
Saccharin Market segmented by Mesh & Purity Grade:
- USP and EP Pharmaceutical Grade
- FCC Food and Beverage Grade
- Industrial Bright Nickel Electroplating Grade
- Feed Palatability Sweetener Grade
Saccharin Market segmented by Distribution Channel:
- Direct to CPG and Pharma Manufacturers
- Specialty Chemical and Food Ingredient Distributors
- Retail Private-Label Co-Packers
- Online B2B Chemical Procurement
Saccharin Market by Region
- North America
- United States
- Canada
- Latin America
- Brazil
- Mexico
- Argentina
- Chile
- Western Europe
- Germany
- France
- United Kingdom
- Italy
- Spain
- Benelux
- Nordics
- Eastern Europe
- Poland
- Czech Republic
- Romania
- Hungary
- East Asia
- China
- Japan
- South Korea
- South Asia and Pacific
- India
- ASEAN
- Australia and New Zealand
- Middle East and Africa
- GCC Countries
- South Africa
- Türkiye
- Israel
Research Sources and Bibliography
- [1] beker, M., Kruszewski, B., & Obiedzinski, M. (2025, March 22). Artificial Sweeteners in Food Products: Concentration Analysis and Cumulative Intake Assessment following EFSA's November 2024 E954 Saccharin ADI Increase to 9 mg/kg bw/day. Nutrients, 17(7), 1110 (PubMed Central PMCID PMC11990090).
- [2] Cargill Incorporated. (2026, September 17). Cargill Highlights Food Ingredient and Sweetmix Sugar-Reduction Solutions at Fi Asia 2026 Based on APAC IngredienTracker Findings. Cargill Corporate Newsroom.
- [3] Lovrincevic Pavlovic, N., Miskulin, I., Kotromanovic Simic, I., Drmic, M., Markovic, M., Milovanovic, I., Jokic, S., Radaus, L., Simatic, B., & Miskulin, M. (2025, October 13). The Relationship Between Artificial Sweetener Intake from Soft Drinks and Internet Addiction Among Students: An Analytical and Cross-Sectional Study. International Journal of Environmental Research and Public Health, 22(10), 1554 (PubMed Central PMCID PMC12563211).
- [4] U.S. Food and Drug Administration. (2025, February 27). Aspartame and Other Sweeteners in Food: Regulatory Status and Acceptable Daily Intake of Saccharin (21 CFR 180.37). U.S. Department of Health and Human Services, Human Foods Program.
- [5] Gomez-Fernandez, A., Perez-Rodrigo, C., & Aranceta-Bartrina, J. (2025, September 12). Beyond Sugar: A Comprehensive Review of Sweeteners and Their Role in Food Formulation and Health. Foods, 14(18), 3182 (PubMed Central PMCID PMC12470175).
- [6] Kowalska, G., Pankiewicz, U., & Kowalski, R. (2025, October 11). Determination of Artificial Sweeteners including Saccharin and Cyclamate in Commercial Beverages. Applied Sciences, 15(20), 10942 (PubMed Central PMCID PMC12565320).
- [7] Karadag, G., & Bala, O. (2026, September 6). Effects of Different Whitening Toothpastes Formulated with Sodium Saccharin on the Color of Aged Composite Resins. Journal of Esthetic and Restorative Dentistry, 38(9), 1412-1421 (PubMed Central PMCID PMC13547960).
- [8] Ingredion Incorporated. (2026, March 23). 7 Questions Shaping the Future of Functional Eating and Sugar Reduction Formulation. Ingredion Be What's Next Technical Insights.
- [9] Lea, I. A., Chappell, G. A., & Wikoff, D. S. (2025, November 15). Lack of Genotoxic and Carcinogenic Potential for Nonsugar Sweeteners Including Saccharin Across Mechanistic and Epidemiological Evidence. Food and Chemical Toxicology, 205, 115642 (PubMed Central PMCID PMC12686615).
- [10] Petrescu, D. C., & Lazar, L. (2026, June 10). Synthetic Sweeteners and Human Health: An Overview of Metabolic, Taste Receptor, and Microbiome Mechanisms. Medicina, 62(6), 1138 (PubMed Central PMCID PMC13303086).
- [11] de Dios, R., Govers, S. K., & McCarthy, R. R. (2025, May 12). Saccharin disrupts bacterial cell envelope stability and interferes with DNA replication dynamics against multidrug-resistant pathogens. EMBO Molecular Medicine, 17(5), 912-934 (PubMed Central PMCID PMC12081710).
- [12] USDA Foreign Agricultural Service. (2026, April 6). Mexico: Food Processing Ingredients Annual. U.S. Department of Agriculture GAIN Report MX2026-0022.
- [13] USDA Foreign Agricultural Service. (2026, March 31). Brazil: Food Processing Ingredients Annual. U.S. Department of Agriculture GAIN Report BR2026-0011.
- [14] USDA Foreign Agricultural Service. (2026, April 20). China: Sugar Annual. U.S. Department of Agriculture GAIN Report CH2026-0048.
- [15] USDA Foreign Agricultural Service. (2026, April 3). France: Food Processing Ingredients Annual. U.S. Department of Agriculture GAIN Report FR2026-0003.
- [16] Zhao, X., Wang, Y., Chen, X., & Wang, X. (2026, February 14). Heterogeneous Biological Responses to Low-Level Sodium Saccharin Exposure: An Integrated Computational Toxicology and Mendelian Randomization Study. Toxicology Reports, 16, 102045 (PubMed Central PMCID PMC13153579).
- [17] USDA Foreign Agricultural Service. (2026, March 30). Germany: Food Processing Ingredients Annual. U.S. Department of Agriculture GAIN Report GM2026-0007.
- [18] USDA Foreign Agricultural Service. (2026, March 24). United Kingdom: Food Processing Ingredients Annual. U.S. Department of Agriculture GAIN Report UK2026-0008.
- [19] USDA Foreign Agricultural Service. (2026, April 1). Japan: Food Processing Ingredients Annual. U.S. Department of Agriculture GAIN Report JA2026-0012.
- [20] Ingredion Incorporated. (2026, August 4). Ingredion Incorporated Reports Second Quarter 2026 Results and Shareholder Acceptance of Tate & Lyle Acquisition Offer. Ingredion Investor Relations News Releases.
- [21] Kerry Group plc. (2025, August 19). From Sugar Tax to Shelf: Reformulating with Purpose Across Sweetened Beverages. Kerry Group plc KerryDigest.
- [22] Roquette Freres SA. (2026, March 19). Roquette 2025 Full-Year Results Announcement: Resilience Across Plant-Based Ingredients and Pharmaceutical Excipients. Roquette Corporate Press Releases.
- [23] International Flavors & Fragrances Inc. (2026, October 27). IFF Identifies Ten Consumer Moments Reshaping Food and Beverage Innovation in the GLP-1 Era. IFF Corporate Media Room.
- [24] Yang, Y., Guo, T., Li, P., Gao, K., Ning, X., Zhou, L., Zhou, W., & Zeng, B. (2026, January 7). Saccharin Aggravates Eosinophilic Esophagitis via MAPK3 Interaction: A Network Toxicology and Machine Learning Study With SPR Analysis. Food Science & Nutrition, 14(1), e71409 (PubMed Central PMCID PMC12778444).
- [25] Ingredion Incorporated. (2026, October 9). Food Tech Summit 2026: The Convergence of Texture, Sweetness, and Value in Beverage and Food Formulation. Ingredion North America Insights.
- [26] Tate & Lyle PLC. (2026, May 21). Tate & Lyle PLC: Results for the Year Ended 31 March 2026. Tate & Lyle Investor News.
- [27] International Flavors & Fragrances Inc. (2026, February 2). Tastepoint by IFF Predicts Ten Flavor Trends Expected to Shape North American Food and Beverage in 2026. IFF Media Releases.
- [28] Tate & Lyle PLC. (2026, June 8). Recommended Cash Acquisition of Tate & Lyle PLC by Ingredion Incorporated to Create a Global Sweetening and Texture Solutions Leader. Tate & Lyle Investor Newsroom.
- [29] European Food Safety Authority (EFSA). (2024, November 15). Re-evaluation of saccharin and its sodium, potassium and calcium salts (E 954) as food additives: Acceptable daily intake increased from 5 to 9 mg/kg bw/day. EFSA Plain Language Summary and Scientific Opinion (EFSA Journal 2024;22(11):e9044).
- [30] International Flavors & Fragrances Inc. (2026, August 25). IFF Report Finds GLP-1 Is Reshaping Food Choices and Sweetener Reformulation Behaviors. IFF Corporate Media Room.
- [31] Kerry Group plc. (2025, February 24). Evolving Sugar Reduction into Sweetness Optimisation. Kerry Group plc KerryDigest.
- [32] Ingredion Incorporated. (2026, May 5). Ingredion Incorporated Reports First Quarter 2026 Results. Ingredion Investor Relations News Releases.
This bibliography is provided for reader reference and is not exhaustive. The full report contains the complete reference list and detailed citations.
This Report Answers
- How large is the saccharin market in 2026 and what is forecast for 2036?
- How does EFSA's 9 mg/kg bw/day ADI increase reshape beverage and tabletop sweetener demand?
- Why does Sodium Saccharin Dihydrate Crystalline lead the chemical form category?
- Why do Granular White Free-Flowing Crystals lead the physical appearance category globally?
- How do national growth rates compare between Mexico and Brazil versus the United States?
- Which leading companies synthesize primary saccharin salts versus blended sugar-reduction systems?
- What triggers TAS2R bitter aftertaste in high-dosage saccharin formulations and how is it masked?
- How are nickel electroplating and antimicrobial wound hydrogels expanding non-food saccharin demand?
Table of Content
- Key Takeaways
- Market Size and CAGR
- Top Growth Driver
- Fastest Growing Segment
- Leading Region
- Key Companies
- Emerging Opportunities
- Executive Summary
- Global Market Outlook
- Demand-side Trends
- Supply-side Trends
- Technology Roadmap Analysis
- Analysis and Recommendations
- Analyst Perspective (What is happening? Why now? What should investors know?)
- Key Questions Answered
- How large is the market?
- What is the CAGR?
- What are key trends?
- Which region dominates?
- Who are the leaders?
Read More...
- Market Overview
- Market Coverage / Taxonomy
- Market Definition / Scope / Limitations
- Research Methodology
- Chapter Orientation
- Analytical Lens and Working Hypotheses
- Market Structure, Signals, and Trend Drivers
- Benchmarking and Cross-market Comparability
- Market Sizing, Forecasting, and Opportunity Mapping
- Research Design and Evidence Framework
- Desk Research Programme (Secondary Evidence)
- Expert Input and Fieldwork (Primary Evidence)
- Tooling, Models, and Reference Databases
- Data Engineering and Model Build
- Quality Assurance and Audit Trail
- Market Background
- Market Dynamics (Drivers, Restraints, Opportunity, Trends)
- Scenario Forecast (Optimistic, Likely, Conservative)
- Impact Analysis
- AI Impact
- Sustainability Impact
- Regulatory Impact
- Technology Impact
- Consumer / Buyer Analysis
- Purchase Drivers
- Adoption Barriers
- Buyer Journey
- Opportunity Map Analysis
- Product Life Cycle Analysis
- Supply Chain Analysis
- Investment Feasibility Matrix
- Value Chain Analysis
- PESTLE and Porter's Analysis
- Regulatory Landscape
- Regional Parent Market Outlook
- Production and Consumption Statistics
- Import and Export Statistics
- Global Market Analysis and Forecast, 2021 to 2036
- Historical Market Size Value (USD Million) Analysis, 2021 to 2025
- Current and Future Market Size Value (USD Million) Projections, 2026 to 2036
- Y-o-Y Growth Trend Analysis
- Absolute $ Opportunity Analysis
- Global Market Pricing Analysis, 2021 to 2036
- Global Market Analysis and Forecast, By Chemical Form, 2021 to 2036
- Introduction / Key Findings
- Historical Market Size Value (USD Million) Analysis By Chemical Form, 2021 to 2025
- Current and Future Market Size Value (USD Million) Analysis and Forecast By Chemical Form, 2026 to 2036
- Sodium Saccharin Dihydrate Crystalline
- Calcium Saccharin Low-Sodium Formulation
- Insoluble Acid Saccharin
- Potassium Saccharin Specialty Salt
- Y-o-Y Growth Trend Analysis By Chemical Form, 2021 to 2025
- Absolute $ Opportunity Analysis By Chemical Form, 2026 to 2036
- Global Market Analysis and Forecast, By Physical Appearance, 2021 to 2036
- Introduction / Key Findings
- Historical Market Size Value (USD Million) Analysis By Physical Appearance, 2021 to 2025
- Current and Future Market Size Value (USD Million) Analysis and Forecast By Physical Appearance, 2026 to 2036
- Granular White Free-Flowing Crystals
- Spray-Dried Soluble Fine Powder
- Compressed Tabletop Effervescent Tablets
- Aqueous Liquid Sweetener Concentrates
- Y-o-Y Growth Trend Analysis By Physical Appearance, 2021 to 2025
- Absolute $ Opportunity Analysis By Physical Appearance, 2026 to 2036
- Global Market Analysis and Forecast, By Core Application, 2021 to 2036
- Introduction / Key Findings
- Historical Market Size Value (USD Million) Analysis By Core Application, 2021 to 2025
- Current and Future Market Size Value (USD Million) Analysis and Forecast By Core Application, 2026 to 2036
- Diet Carbonated Soft Drinks and Fountain Syrups
- Tabletop Sweetener Pink Sachets and Tablets
- Oral Care Toothpastes and Breath Sprays
- Pharmaceutical Syrups and Electroplating Additive
- Bakery and Confectionery with Pickled Condiments
- Y-o-Y Growth Trend Analysis By Core Application, 2021 to 2025
- Absolute $ Opportunity Analysis By Core Application, 2026 to 2036
- Global Market Analysis and Forecast, By Mesh & Purity Grade, 2021 to 2036
- Introduction / Key Findings
- Historical Market Size Value (USD Million) Analysis By Mesh & Purity Grade, 2021 to 2025
- Current and Future Market Size Value (USD Million) Analysis and Forecast By Mesh & Purity Grade, 2026 to 2036
- USP and EP Pharmaceutical Grade
- FCC Food and Beverage Grade
- Industrial Bright Nickel Electroplating Grade
- Feed Palatability Sweetener Grade
- Y-o-Y Growth Trend Analysis By Mesh & Purity Grade, 2021 to 2025
- Absolute $ Opportunity Analysis By Mesh & Purity Grade, 2026 to 2036
- Global Market Analysis and Forecast, By Distribution Channel, 2021 to 2036
- Introduction / Key Findings
- Historical Market Size Value (USD Million) Analysis By Distribution Channel, 2021 to 2025
- Current and Future Market Size Value (USD Million) Analysis and Forecast By Distribution Channel, 2026 to 2036
- Direct to CPG and Pharma Manufacturers
- Specialty Chemical and Food Ingredient Distributors
- Retail Private-Label Co-Packers
- Online B2B Chemical Procurement
- Y-o-Y Growth Trend Analysis By Distribution Channel, 2021 to 2025
- Absolute $ Opportunity Analysis By Distribution Channel, 2026 to 2036
- Global Market Analysis and Forecast, By Region, 2021 to 2036
- Introduction
- Historical Market Size Value (USD Million) Analysis By Region, 2021 to 2025
- Current Market Size Value (USD Million) Analysis and Forecast By Region, 2026 to 2036
- North America
- Latin America
- Western Europe
- Eastern Europe
- East Asia
- South Asia and Pacific
- Middle East and Africa
- Market Attractiveness Analysis By Region
- North America Market Analysis and Forecast, By Country, 2021 to 2036
- Historical Market Size Value (USD Million) Trend Analysis By Market Taxonomy, 2021 to 2025
- Market Size Value (USD Million) Forecast By Market Taxonomy, 2026 to 2036
- By Country
- United States
- Canada
- By Chemical Form
- By Physical Appearance
- By Core Application
- By Mesh & Purity Grade
- By Distribution Channel
- By Country
- Market Attractiveness Analysis
- By Country
- By Chemical Form
- By Physical Appearance
- By Core Application
- By Mesh & Purity Grade
- By Distribution Channel
- Key Takeaways
- Latin America Market Analysis and Forecast, By Country
- Historical Market Size Value (USD Million) Trend Analysis By Market Taxonomy, 2021 to 2025
- Market Size Value (USD Million) Forecast By Market Taxonomy, 2026 to 2036
- By Country
- Brazil
- Mexico
- Argentina
- Chile
- By Chemical Form
- By Physical Appearance
- By Core Application
- By Mesh & Purity Grade
- By Distribution Channel
- By Country
- Market Attractiveness Analysis
- By Country
- By Chemical Form
- By Physical Appearance
- By Core Application
- By Mesh & Purity Grade
- By Distribution Channel
- Key Takeaways
- Western Europe Market Analysis and Forecast, By Country
- Historical Market Size Value (USD Million) Trend Analysis By Market Taxonomy, 2021 to 2025
- Market Size Value (USD Million) Forecast By Market Taxonomy, 2026 to 2036
- By Country
- Germany
- France
- United Kingdom
- Italy
- Spain
- Benelux
- Nordics
- By Chemical Form
- By Physical Appearance
- By Core Application
- By Mesh & Purity Grade
- By Distribution Channel
- By Country
- Market Attractiveness Analysis
- By Country
- By Chemical Form
- By Physical Appearance
- By Core Application
- By Mesh & Purity Grade
- By Distribution Channel
- Key Takeaways
- Eastern Europe Market Analysis and Forecast, By Country
- Historical Market Size Value (USD Million) Trend Analysis By Market Taxonomy, 2021 to 2025
- Market Size Value (USD Million) Forecast By Market Taxonomy, 2026 to 2036
- By Country
- Poland
- Czech Republic
- Romania
- Hungary
- By Chemical Form
- By Physical Appearance
- By Core Application
- By Mesh & Purity Grade
- By Distribution Channel
- By Country
- Market Attractiveness Analysis
- By Country
- By Chemical Form
- By Physical Appearance
- By Core Application
- By Mesh & Purity Grade
- By Distribution Channel
- Key Takeaways
- East Asia Market Analysis and Forecast, By Country
- Historical Market Size Value (USD Million) Trend Analysis By Market Taxonomy, 2021 to 2025
- Market Size Value (USD Million) Forecast By Market Taxonomy, 2026 to 2036
- By Country
- China
- Japan
- South Korea
- By Chemical Form
- By Physical Appearance
- By Core Application
- By Mesh & Purity Grade
- By Distribution Channel
- By Country
- Market Attractiveness Analysis
- By Country
- By Chemical Form
- By Physical Appearance
- By Core Application
- By Mesh & Purity Grade
- By Distribution Channel
- Key Takeaways
- South Asia and Pacific Market Analysis and Forecast, By Country
- Historical Market Size Value (USD Million) Trend Analysis By Market Taxonomy, 2021 to 2025
- Market Size Value (USD Million) Forecast By Market Taxonomy, 2026 to 2036
- By Country
- India
- ASEAN
- Australia and New Zealand
- By Chemical Form
- By Physical Appearance
- By Core Application
- By Mesh & Purity Grade
- By Distribution Channel
- By Country
- Market Attractiveness Analysis
- By Country
- By Chemical Form
- By Physical Appearance
- By Core Application
- By Mesh & Purity Grade
- By Distribution Channel
- Key Takeaways
- Middle East and Africa Market Analysis and Forecast, By Country
- Historical Market Size Value (USD Million) Trend Analysis By Market Taxonomy, 2021 to 2025
- Market Size Value (USD Million) Forecast By Market Taxonomy, 2026 to 2036
- By Country
- GCC Countries
- South Africa
- Türkiye
- Israel
- By Chemical Form
- By Physical Appearance
- By Core Application
- By Mesh & Purity Grade
- By Distribution Channel
- By Country
- Market Attractiveness Analysis
- By Country
- By Chemical Form
- By Physical Appearance
- By Core Application
- By Mesh & Purity Grade
- By Distribution Channel
- Key Takeaways
- Key Countries Market Analysis
- United States
- Pricing Analysis
- Market Share Analysis, 2025
- By Chemical Form
- By Physical Appearance
- By Core Application
- By Mesh & Purity Grade
- By Distribution Channel
- Canada
- Pricing Analysis
- Market Share Analysis, 2025
- By Chemical Form
- By Physical Appearance
- By Core Application
- By Mesh & Purity Grade
- By Distribution Channel
- Mexico
- Pricing Analysis
- Market Share Analysis, 2025
- By Chemical Form
- By Physical Appearance
- By Core Application
- By Mesh & Purity Grade
- By Distribution Channel
- Brazil
- Pricing Analysis
- Market Share Analysis, 2025
- By Chemical Form
- By Physical Appearance
- By Core Application
- By Mesh & Purity Grade
- By Distribution Channel
- Chile
- Pricing Analysis
- Market Share Analysis, 2025
- By Chemical Form
- By Physical Appearance
- By Core Application
- By Mesh & Purity Grade
- By Distribution Channel
- Germany
- Pricing Analysis
- Market Share Analysis, 2025
- By Chemical Form
- By Physical Appearance
- By Core Application
- By Mesh & Purity Grade
- By Distribution Channel
- United Kingdom
- Pricing Analysis
- Market Share Analysis, 2025
- By Chemical Form
- By Physical Appearance
- By Core Application
- By Mesh & Purity Grade
- By Distribution Channel
- Italy
- Pricing Analysis
- Market Share Analysis, 2025
- By Chemical Form
- By Physical Appearance
- By Core Application
- By Mesh & Purity Grade
- By Distribution Channel
- Spain
- Pricing Analysis
- Market Share Analysis, 2025
- By Chemical Form
- By Physical Appearance
- By Core Application
- By Mesh & Purity Grade
- By Distribution Channel
- France
- Pricing Analysis
- Market Share Analysis, 2025
- By Chemical Form
- By Physical Appearance
- By Core Application
- By Mesh & Purity Grade
- By Distribution Channel
- India
- Pricing Analysis
- Market Share Analysis, 2025
- By Chemical Form
- By Physical Appearance
- By Core Application
- By Mesh & Purity Grade
- By Distribution Channel
- ASEAN
- Pricing Analysis
- Market Share Analysis, 2025
- By Chemical Form
- By Physical Appearance
- By Core Application
- By Mesh & Purity Grade
- By Distribution Channel
- Australia and New Zealand
- Pricing Analysis
- Market Share Analysis, 2025
- By Chemical Form
- By Physical Appearance
- By Core Application
- By Mesh & Purity Grade
- By Distribution Channel
- China
- Pricing Analysis
- Market Share Analysis, 2025
- By Chemical Form
- By Physical Appearance
- By Core Application
- By Mesh & Purity Grade
- By Distribution Channel
- Japan
- Pricing Analysis
- Market Share Analysis, 2025
- By Chemical Form
- By Physical Appearance
- By Core Application
- By Mesh & Purity Grade
- By Distribution Channel
- South Korea
- Pricing Analysis
- Market Share Analysis, 2025
- By Chemical Form
- By Physical Appearance
- By Core Application
- By Mesh & Purity Grade
- By Distribution Channel
- Poland
- Pricing Analysis
- Market Share Analysis, 2025
- By Chemical Form
- By Physical Appearance
- By Core Application
- By Mesh & Purity Grade
- By Distribution Channel
- Hungary
- Pricing Analysis
- Market Share Analysis, 2025
- By Chemical Form
- By Physical Appearance
- By Core Application
- By Mesh & Purity Grade
- By Distribution Channel
- Türkiye
- Pricing Analysis
- Market Share Analysis, 2025
- By Chemical Form
- By Physical Appearance
- By Core Application
- By Mesh & Purity Grade
- By Distribution Channel
- South Africa
- Pricing Analysis
- Market Share Analysis, 2025
- By Chemical Form
- By Physical Appearance
- By Core Application
- By Mesh & Purity Grade
- By Distribution Channel
- United States
- Market Structure Analysis
- Competition Dashboard
- Competition Benchmarking
- Market Share Analysis of Top Players
- By Regional
- By Chemical Form
- By Physical Appearance
- By Core Application
- By Mesh & Purity Grade
- By Distribution Channel
- Emerging Startups
- Innovation Benchmarking
- Competition Analysis
- Competition Deep Dive
- Cargill Incorporated
- Overview
- Product Portfolio
- Profitability by Market Segments
- Sales Footprint
- Strategy Overview
- Marketing Strategy
- Product Strategy
- Channel Strategy
- International Flavors and Fragrances
- Kerry Group plc
- Ingredion Incorporated
- Tate and Lyle plc
- Roquette Freres SA
- Novonesis
- PMC Specialties Group Inc.
- Shanghai Fortune Chemical Co.
- Kaifeng Xinghua Fine Chemical
- Shanghai Fortune Chemical Co., Ltd.
- Kaifeng Xinghua Fine Chemical Ltd.
- Cargill Incorporated
- Case Studies
- Success Stories
- Recent Developments
- Competition Deep Dive
- Assumptions & Acronyms Used
List of Tables
- Table 1: Global Market Value (USD Million) Forecast by Region, 2021 to 2036
- Table 2: Global Market Value (USD Million) Forecast by Chemical Form, 2021 to 2036
- Table 3: Global Market Value (USD Million) Forecast by Physical Appearance, 2021 to 2036
- Table 4: Global Market Value (USD Million) Forecast by Core Application, 2021 to 2036
- Table 5: Global Market Value (USD Million) Forecast by Mesh & Purity Grade, 2021 to 2036
- Table 6: Global Market Value (USD Million) Forecast by Distribution Channel, 2021 to 2036
- Table 7: North America Market Value (USD Million) Forecast by Country, 2021 to 2036
- Table 8: North America Market Value (USD Million) Forecast by Chemical Form, 2021 to 2036
- Table 9: North America Market Value (USD Million) Forecast by Physical Appearance, 2021 to 2036
- Table 10: North America Market Value (USD Million) Forecast by Core Application, 2021 to 2036
- Table 11: North America Market Value (USD Million) Forecast by Mesh & Purity Grade, 2021 to 2036
- Table 12: North America Market Value (USD Million) Forecast by Distribution Channel, 2021 to 2036
- Table 13: Latin America Market Value (USD Million) Forecast by Country, 2021 to 2036
- Table 14: Latin America Market Value (USD Million) Forecast by Chemical Form, 2021 to 2036
- Table 15: Latin America Market Value (USD Million) Forecast by Physical Appearance, 2021 to 2036
- Table 16: Latin America Market Value (USD Million) Forecast by Core Application, 2021 to 2036
- Table 17: Latin America Market Value (USD Million) Forecast by Mesh & Purity Grade, 2021 to 2036
- Table 18: Latin America Market Value (USD Million) Forecast by Distribution Channel, 2021 to 2036
- Table 19: Western Europe Market Value (USD Million) Forecast by Country, 2021 to 2036
- Table 20: Western Europe Market Value (USD Million) Forecast by Chemical Form, 2021 to 2036
- Table 21: Western Europe Market Value (USD Million) Forecast by Physical Appearance, 2021 to 2036
- Table 22: Western Europe Market Value (USD Million) Forecast by Core Application, 2021 to 2036
- Table 23: Western Europe Market Value (USD Million) Forecast by Mesh & Purity Grade, 2021 to 2036
- Table 24: Western Europe Market Value (USD Million) Forecast by Distribution Channel, 2021 to 2036
- Table 25: Eastern Europe Market Value (USD Million) Forecast by Country, 2021 to 2036
- Table 26: Eastern Europe Market Value (USD Million) Forecast by Chemical Form, 2021 to 2036
- Table 27: Eastern Europe Market Value (USD Million) Forecast by Physical Appearance, 2021 to 2036
- Table 28: Eastern Europe Market Value (USD Million) Forecast by Core Application, 2021 to 2036
- Table 29: Eastern Europe Market Value (USD Million) Forecast by Mesh & Purity Grade, 2021 to 2036
- Table 30: Eastern Europe Market Value (USD Million) Forecast by Distribution Channel, 2021 to 2036
- Table 31: East Asia Market Value (USD Million) Forecast by Country, 2021 to 2036
- Table 32: East Asia Market Value (USD Million) Forecast by Chemical Form, 2021 to 2036
- Table 33: East Asia Market Value (USD Million) Forecast by Physical Appearance, 2021 to 2036
- Table 34: East Asia Market Value (USD Million) Forecast by Core Application, 2021 to 2036
- Table 35: East Asia Market Value (USD Million) Forecast by Mesh & Purity Grade, 2021 to 2036
- Table 36: East Asia Market Value (USD Million) Forecast by Distribution Channel, 2021 to 2036
- Table 37: South Asia and Pacific Market Value (USD Million) Forecast by Country, 2021 to 2036
- Table 38: South Asia and Pacific Market Value (USD Million) Forecast by Chemical Form, 2021 to 2036
- Table 39: South Asia and Pacific Market Value (USD Million) Forecast by Physical Appearance, 2021 to 2036
- Table 40: South Asia and Pacific Market Value (USD Million) Forecast by Core Application, 2021 to 2036
- Table 41: South Asia and Pacific Market Value (USD Million) Forecast by Mesh & Purity Grade, 2021 to 2036
- Table 42: South Asia and Pacific Market Value (USD Million) Forecast by Distribution Channel, 2021 to 2036
- Table 43: Middle East and Africa Market Value (USD Million) Forecast by Country, 2021 to 2036
- Table 44: Middle East and Africa Market Value (USD Million) Forecast by Chemical Form, 2021 to 2036
- Table 45: Middle East and Africa Market Value (USD Million) Forecast by Physical Appearance, 2021 to 2036
- Table 46: Middle East and Africa Market Value (USD Million) Forecast by Core Application, 2021 to 2036
- Table 47: Middle East and Africa Market Value (USD Million) Forecast by Mesh & Purity Grade, 2021 to 2036
- Table 48: Middle East and Africa Market Value (USD Million) Forecast by Distribution Channel, 2021 to 2036
List of Figures
- Figure 1: Global Market Pricing Analysis
- Figure 2: Global Market Value (USD Million) Forecast 2021-2036
- Figure 3: Global Market Value Share and BPS Analysis by Chemical Form, 2026 and 2036
- Figure 4: Global Market Y-o-Y Growth Comparison by Chemical Form, 2026-2036
- Figure 5: Global Market Attractiveness Analysis by Chemical Form
- Figure 6: Global Market Value Share and BPS Analysis by Physical Appearance, 2026 and 2036
- Figure 7: Global Market Y-o-Y Growth Comparison by Physical Appearance, 2026-2036
- Figure 8: Global Market Attractiveness Analysis by Physical Appearance
- Figure 9: Global Market Value Share and BPS Analysis by Core Application, 2026 and 2036
- Figure 10: Global Market Y-o-Y Growth Comparison by Core Application, 2026-2036
- Figure 11: Global Market Attractiveness Analysis by Core Application
- Figure 12: Global Market Value Share and BPS Analysis by Mesh & Purity Grade, 2026 and 2036
- Figure 13: Global Market Y-o-Y Growth Comparison by Mesh & Purity Grade, 2026-2036
- Figure 14: Global Market Attractiveness Analysis by Mesh & Purity Grade
- Figure 15: Global Market Value Share and BPS Analysis by Distribution Channel, 2026 and 2036
- Figure 16: Global Market Y-o-Y Growth Comparison by Distribution Channel, 2026-2036
- Figure 17: Global Market Attractiveness Analysis by Distribution Channel
- Figure 18: Global Market Value (USD Million) Share and BPS Analysis by Region, 2026 and 2036
- Figure 19: Global Market Y-o-Y Growth Comparison by Region, 2026-2036
- Figure 20: Global Market Attractiveness Analysis by Region
- Figure 21: North America Market Incremental Dollar Opportunity, 2026-2036
- Figure 22: Latin America Market Incremental Dollar Opportunity, 2026-2036
- Figure 23: Western Europe Market Incremental Dollar Opportunity, 2026-2036
- Figure 24: Eastern Europe Market Incremental Dollar Opportunity, 2026-2036
- Figure 25: East Asia Market Incremental Dollar Opportunity, 2026-2036
- Figure 26: South Asia and Pacific Market Incremental Dollar Opportunity, 2026-2036
- Figure 27: Middle East and Africa Market Incremental Dollar Opportunity, 2026-2036
- Figure 28: North America Market Value Share and BPS Analysis by Country, 2026 and 2036
- Figure 29: North America Market Value Share and BPS Analysis by Chemical Form, 2026 and 2036
- Figure 30: North America Market Y-o-Y Growth Comparison by Chemical Form, 2026-2036
- Figure 31: North America Market Attractiveness Analysis by Chemical Form
- Figure 32: North America Market Value Share and BPS Analysis by Physical Appearance, 2026 and 2036
- Figure 33: North America Market Y-o-Y Growth Comparison by Physical Appearance, 2026-2036
- Figure 34: North America Market Attractiveness Analysis by Physical Appearance
- Figure 35: North America Market Value Share and BPS Analysis by Core Application, 2026 and 2036
- Figure 36: North America Market Y-o-Y Growth Comparison by Core Application, 2026-2036
- Figure 37: North America Market Attractiveness Analysis by Core Application
- Figure 38: North America Market Value Share and BPS Analysis by Mesh & Purity Grade, 2026 and 2036
- Figure 39: North America Market Y-o-Y Growth Comparison by Mesh & Purity Grade, 2026-2036
- Figure 40: North America Market Attractiveness Analysis by Mesh & Purity Grade
- Figure 41: North America Market Value Share and BPS Analysis by Distribution Channel, 2026 and 2036
- Figure 42: North America Market Y-o-Y Growth Comparison by Distribution Channel, 2026-2036
- Figure 43: North America Market Attractiveness Analysis by Distribution Channel
- Figure 44: Latin America Market Value Share and BPS Analysis by Country, 2026 and 2036
- Figure 45: Latin America Market Value Share and BPS Analysis by Chemical Form, 2026 and 2036
- Figure 46: Latin America Market Y-o-Y Growth Comparison by Chemical Form, 2026-2036
- Figure 47: Latin America Market Attractiveness Analysis by Chemical Form
- Figure 48: Latin America Market Value Share and BPS Analysis by Physical Appearance, 2026 and 2036
- Figure 49: Latin America Market Y-o-Y Growth Comparison by Physical Appearance, 2026-2036
- Figure 50: Latin America Market Attractiveness Analysis by Physical Appearance
- Figure 51: Latin America Market Value Share and BPS Analysis by Core Application, 2026 and 2036
- Figure 52: Latin America Market Y-o-Y Growth Comparison by Core Application, 2026-2036
- Figure 53: Latin America Market Attractiveness Analysis by Core Application
- Figure 54: Latin America Market Value Share and BPS Analysis by Mesh & Purity Grade, 2026 and 2036
- Figure 55: Latin America Market Y-o-Y Growth Comparison by Mesh & Purity Grade, 2026-2036
- Figure 56: Latin America Market Attractiveness Analysis by Mesh & Purity Grade
- Figure 57: Latin America Market Value Share and BPS Analysis by Distribution Channel, 2026 and 2036
- Figure 58: Latin America Market Y-o-Y Growth Comparison by Distribution Channel, 2026-2036
- Figure 59: Latin America Market Attractiveness Analysis by Distribution Channel
- Figure 60: Western Europe Market Value Share and BPS Analysis by Country, 2026 and 2036
- Figure 61: Western Europe Market Value Share and BPS Analysis by Chemical Form, 2026 and 2036
- Figure 62: Western Europe Market Y-o-Y Growth Comparison by Chemical Form, 2026-2036
- Figure 63: Western Europe Market Attractiveness Analysis by Chemical Form
- Figure 64: Western Europe Market Value Share and BPS Analysis by Physical Appearance, 2026 and 2036
- Figure 65: Western Europe Market Y-o-Y Growth Comparison by Physical Appearance, 2026-2036
- Figure 66: Western Europe Market Attractiveness Analysis by Physical Appearance
- Figure 67: Western Europe Market Value Share and BPS Analysis by Core Application, 2026 and 2036
- Figure 68: Western Europe Market Y-o-Y Growth Comparison by Core Application, 2026-2036
- Figure 69: Western Europe Market Attractiveness Analysis by Core Application
- Figure 70: Western Europe Market Value Share and BPS Analysis by Mesh & Purity Grade, 2026 and 2036
- Figure 71: Western Europe Market Y-o-Y Growth Comparison by Mesh & Purity Grade, 2026-2036
- Figure 72: Western Europe Market Attractiveness Analysis by Mesh & Purity Grade
- Figure 73: Western Europe Market Value Share and BPS Analysis by Distribution Channel, 2026 and 2036
- Figure 74: Western Europe Market Y-o-Y Growth Comparison by Distribution Channel, 2026-2036
- Figure 75: Western Europe Market Attractiveness Analysis by Distribution Channel
- Figure 76: Eastern Europe Market Value Share and BPS Analysis by Country, 2026 and 2036
- Figure 77: Eastern Europe Market Value Share and BPS Analysis by Chemical Form, 2026 and 2036
- Figure 78: Eastern Europe Market Y-o-Y Growth Comparison by Chemical Form, 2026-2036
- Figure 79: Eastern Europe Market Attractiveness Analysis by Chemical Form
- Figure 80: Eastern Europe Market Value Share and BPS Analysis by Physical Appearance, 2026 and 2036
- Figure 81: Eastern Europe Market Y-o-Y Growth Comparison by Physical Appearance, 2026-2036
- Figure 82: Eastern Europe Market Attractiveness Analysis by Physical Appearance
- Figure 83: Eastern Europe Market Value Share and BPS Analysis by Core Application, 2026 and 2036
- Figure 84: Eastern Europe Market Y-o-Y Growth Comparison by Core Application, 2026-2036
- Figure 85: Eastern Europe Market Attractiveness Analysis by Core Application
- Figure 86: Eastern Europe Market Value Share and BPS Analysis by Mesh & Purity Grade, 2026 and 2036
- Figure 87: Eastern Europe Market Y-o-Y Growth Comparison by Mesh & Purity Grade, 2026-2036
- Figure 88: Eastern Europe Market Attractiveness Analysis by Mesh & Purity Grade
- Figure 89: Eastern Europe Market Value Share and BPS Analysis by Distribution Channel, 2026 and 2036
- Figure 90: Eastern Europe Market Y-o-Y Growth Comparison by Distribution Channel, 2026-2036
- Figure 91: Eastern Europe Market Attractiveness Analysis by Distribution Channel
- Figure 92: East Asia Market Value Share and BPS Analysis by Country, 2026 and 2036
- Figure 93: East Asia Market Value Share and BPS Analysis by Chemical Form, 2026 and 2036
- Figure 94: East Asia Market Y-o-Y Growth Comparison by Chemical Form, 2026-2036
- Figure 95: East Asia Market Attractiveness Analysis by Chemical Form
- Figure 96: East Asia Market Value Share and BPS Analysis by Physical Appearance, 2026 and 2036
- Figure 97: East Asia Market Y-o-Y Growth Comparison by Physical Appearance, 2026-2036
- Figure 98: East Asia Market Attractiveness Analysis by Physical Appearance
- Figure 99: East Asia Market Value Share and BPS Analysis by Core Application, 2026 and 2036
- Figure 100: East Asia Market Y-o-Y Growth Comparison by Core Application, 2026-2036
- Figure 101: East Asia Market Attractiveness Analysis by Core Application
- Figure 102: East Asia Market Value Share and BPS Analysis by Mesh & Purity Grade, 2026 and 2036
- Figure 103: East Asia Market Y-o-Y Growth Comparison by Mesh & Purity Grade, 2026-2036
- Figure 104: East Asia Market Attractiveness Analysis by Mesh & Purity Grade
- Figure 105: East Asia Market Value Share and BPS Analysis by Distribution Channel, 2026 and 2036
- Figure 106: East Asia Market Y-o-Y Growth Comparison by Distribution Channel, 2026-2036
- Figure 107: East Asia Market Attractiveness Analysis by Distribution Channel
- Figure 108: South Asia and Pacific Market Value Share and BPS Analysis by Country, 2026 and 2036
- Figure 109: South Asia and Pacific Market Value Share and BPS Analysis by Chemical Form, 2026 and 2036
- Figure 110: South Asia and Pacific Market Y-o-Y Growth Comparison by Chemical Form, 2026-2036
- Figure 111: South Asia and Pacific Market Attractiveness Analysis by Chemical Form
- Figure 112: South Asia and Pacific Market Value Share and BPS Analysis by Physical Appearance, 2026 and 2036
- Figure 113: South Asia and Pacific Market Y-o-Y Growth Comparison by Physical Appearance, 2026-2036
- Figure 114: South Asia and Pacific Market Attractiveness Analysis by Physical Appearance
- Figure 115: South Asia and Pacific Market Value Share and BPS Analysis by Core Application, 2026 and 2036
- Figure 116: South Asia and Pacific Market Y-o-Y Growth Comparison by Core Application, 2026-2036
- Figure 117: South Asia and Pacific Market Attractiveness Analysis by Core Application
- Figure 118: South Asia and Pacific Market Value Share and BPS Analysis by Mesh & Purity Grade, 2026 and 2036
- Figure 119: South Asia and Pacific Market Y-o-Y Growth Comparison by Mesh & Purity Grade, 2026-2036
- Figure 120: South Asia and Pacific Market Attractiveness Analysis by Mesh & Purity Grade
- Figure 121: South Asia and Pacific Market Value Share and BPS Analysis by Distribution Channel, 2026 and 2036
- Figure 122: South Asia and Pacific Market Y-o-Y Growth Comparison by Distribution Channel, 2026-2036
- Figure 123: South Asia and Pacific Market Attractiveness Analysis by Distribution Channel
- Figure 124: Middle East and Africa Market Value Share and BPS Analysis by Country, 2026 and 2036
- Figure 125: Middle East and Africa Market Value Share and BPS Analysis by Chemical Form, 2026 and 2036
- Figure 126: Middle East and Africa Market Y-o-Y Growth Comparison by Chemical Form, 2026-2036
- Figure 127: Middle East and Africa Market Attractiveness Analysis by Chemical Form
- Figure 128: Middle East and Africa Market Value Share and BPS Analysis by Physical Appearance, 2026 and 2036
- Figure 129: Middle East and Africa Market Y-o-Y Growth Comparison by Physical Appearance, 2026-2036
- Figure 130: Middle East and Africa Market Attractiveness Analysis by Physical Appearance
- Figure 131: Middle East and Africa Market Value Share and BPS Analysis by Core Application, 2026 and 2036
- Figure 132: Middle East and Africa Market Y-o-Y Growth Comparison by Core Application, 2026-2036
- Figure 133: Middle East and Africa Market Attractiveness Analysis by Core Application
- Figure 134: Middle East and Africa Market Value Share and BPS Analysis by Mesh & Purity Grade, 2026 and 2036
- Figure 135: Middle East and Africa Market Y-o-Y Growth Comparison by Mesh & Purity Grade, 2026-2036
- Figure 136: Middle East and Africa Market Attractiveness Analysis by Mesh & Purity Grade
- Figure 137: Middle East and Africa Market Value Share and BPS Analysis by Distribution Channel, 2026 and 2036
- Figure 138: Middle East and Africa Market Y-o-Y Growth Comparison by Distribution Channel, 2026-2036
- Figure 139: Middle East and Africa Market Attractiveness Analysis by Distribution Channel
- Figure 140: Global Market - Tier Structure Analysis
- Figure 141: Global Market - Company Share Analysis
Frequently Asked Questions
How big is the saccharin market in 2026, and what is forecast for 2036?
Across 2025, global saccharin valuation was assessed at USD 767.5 million and reached a projected 2026 threshold of USD 816.4 million. Overall industry value will hit USD 1,561.5 million in 2036 because beverage and oral-care manufacturers expand zero-calorie reformulation.
What is the CAGR for the saccharin market from 2026 to 2036?
Global saccharin valuation grows at a 6.7% rate from 2026 to 2036, creating USD 745.1 million in net market value across food and pharmaceutical with industrial electroplating channels.
Which chemical form segment leads the saccharin market?
Sodium Saccharin Dihydrate Crystalline holds 58.1% of chemical form demand in 2026 because its rapid cold-water solubility and 300-fold sweetness potency streamline beverage and toothpaste batching.
Which physical appearance segment leads the saccharin market?
Granular White Free-Flowing Crystals represent 56.5% of the physical appearance category in 2026 as 20-to-80 mesh crystals prevent dust bridging and moisture caking in industrial hoppers.
Which country has a notable growth outlook during the assessment period?
Mexico tops national growth forecasts at an 8.1% ten-year rate to 2036, driven by NOM-051 front-of-pack warning-label reformulation and high per-capita diet beverage bottling.
Who are the key players in the market?
PMC Specialties Group and Shanghai Fortune Chemical with Kaifeng Xinghua lead primary chemical synthesis. Cargill Incorporated and IFF with Kerry Group as well as Ingredion and Tate and Lyle lead blended sweetener systems, while Roquette Freres and Novonesis supply polyol excipients and biosolutions.
Preview the report firsthand - request a free sample
Get SampleGet the brochure for pricing and purchase details.
Get PDF
