Scleral Lenses Market Snapshot (2022 to 2032)

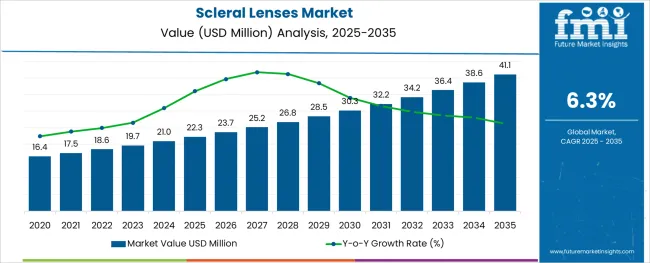
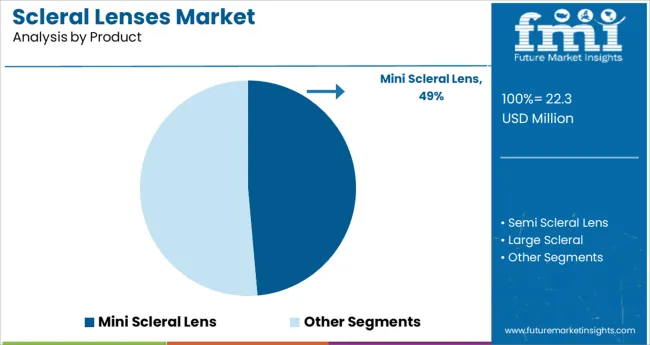
The global market for scleral lenses is expected to enjoy a valuation of US$ 175.5 million in the year 2022, and further expand at a CAGR of 6.3% to reach a valuation of ~US$ 323.5 million by the year 2032. According to a recent study by Future Market Insights, the mini scleral lenses in the product segment are leading the market with a share of about 47.4% in the year 2021, within the global market.

Market Outlook:

Data Points Market Insights
Market Value 2022 US$ 175.5 million
Market Value 2032 US$ 323.5 million
CAGR 2022  to 2032 6.3%
Market Share of Top 5 Countries 73.3%
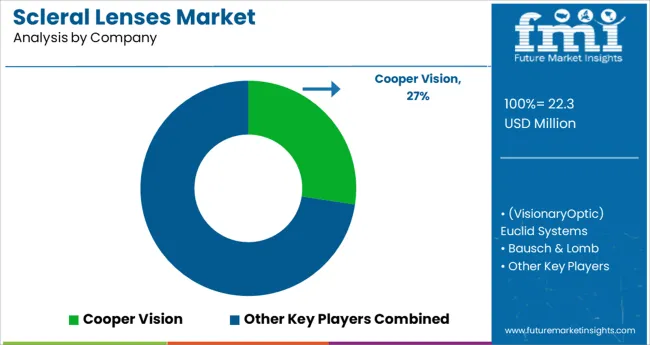
Key Market Players Cooper Vision, (VisionaryOptic) Euclid Systems, Bausch & Lomb, Art Optical Contact Lens, Inc., AccuLens, Valley Contax Inc., ABB Optical Group, EssilorLuxottica, Optact International Ltd., Solotica, Smart Optics LLC, OPTO CENTAR, OKVision, No7 Contact Lenses, Multilens AB, Laboratoire LCS, HERZ submicron lathing s.r.l., Gelflex, Firma Concor Ltd., Biolens Lab, Appenzeller Kontaktlinsen AG, Advanced Vision Technologies, and Metro Optics

Scleral lenses are large-diameter lenses that have been specifically designed to completely cover the sclera and corneal surface. Scleral lenses are more stable on the eyes than other conventional lenses because of their size. These lenses are highly breathable and are made of stiff permeable lens materials wherein the surface of the eyes receives plenty of oxygen because of the high-quality material properties of these lenses.

Scleral lenses are used for conditions like corneal irregularity, surface ocular disease, and refractive error. It is used to treat a variety of diseases, including keratoconus, microphthalmia, neurotrophic keratitis, dry eye syndrome, pellucid marginal degeneration, corneal scarring, and other ailments.

Manufacturers offer scleral lenses that are specifically sized and diseased to meet the needs of patients. Scleral lenses are becoming a popular treatment option for older people and youngsters. People whose eyes are too sensitive for smaller contact lenses are increasingly turning to scleral lenses.

Thus owing to such importance and advancement in the product portfolio, the global scleral lenses market is expected to see growth in the forecast period.

Don't pay for what you don't need

Customize your report by selecting specific countries or regions and save 30%!

Sales Analysis of Scleral Lenses Market from 2012 to 2021 Vs Market Outlook for 2022 to 2032

The market value of the scleral lenses was approximately 1.4% of the overall ~US$ 11.8 billion global contact lens market in 2021.

The sales of scleral lens products expanded at a CAGR of 3.0% from 2012 to 2021.

Over the projection period, it is anticipated that there will be a strong demand for scleral lenses because of the rising incidence of eye illnesses and difficulties. The market for scleral lenses is anticipated to develop as a result of the rising demand for eye movement analysis. The market is also anticipated to develop because of the increasing older population, a rise in the number of people seeking treatment, and changes in lifestyle.

The market for scleral lenses is anticipated to expand as a result of rising demand for non-surgical products for vision care and treatment. One of the major trends in the scleral lenses industry is the rise in customized scleral lens production. The market is anticipated to rise as scleral lenses are increasingly prescribed to treat corneal irregularities and ocular surface diseases.

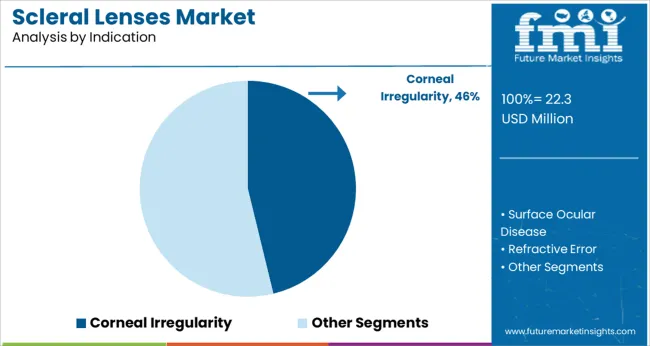
As per an article published in 2017 by the contact lens spectrum, the SCOPE (Scleral Lenses in Current Ophthalmic Practice Evaluation) study group, in n=673, it was observed that the most frequent reason for using scleral lenses was reported to be corneal irregularity, 74%, followed by ocular surface illness, 16%, and refractive error, 10%.

Thus, owing to the aforementioned factors, the global market for scleral lenses is expected to grow at a CAGR of 6.3% during the forecast period from 2022 to 2032.

Scleral Lenses Market

What are the Key Opportunities within the Scleral Lenses Market?

Considering the growing awareness in developing countries, the market is expected to have a positive outlook. The adoption rate is increasing with new products entering the emerging market. This growth is attributed to the developing nations' increasing collaboration and effort of the manufacturers.

For instance, The LV Prasad Eye Institute (LVPEI) and Boston Foundation collaborated in 2017 to improve access to specialized lenses for patients in developing geographies. There is now Boston Sight SCLERAL & PROSE in India and they are starting to cater to patients in other countries of South and Middle-East Asia as well.

The market is having an opportunistic outlook as the patient currently looks for advanced products that would ease their day-to-day activities along with providing comfort. This in turn benefits the manufacturers who are involved in providing new and customized products as per the need of the patients.

Thus, this can be considered an opportunistic factor for the growth and wider adoption of scleral lenses.

Sabyasachi Ghosh
Sabyasachi Ghosh

Principal Consultant

Talk to Analyst

Find your sweet spots for generating winning opportunities in this market.

What are the Factors Restraining Demand within the Scleral Lenses Market?

The major factor restraining the demand for scleral lenses is the high cost of the scleral lenses. These lenses are four to five times more expensive compared to other soft contact lenses or other standard contact lenses. The cost of the customized scleral lenses can be more than $4000 as well.

This in turn significantly decreases the adoption of scleral lenses for low and middle-income group patients. There are also minimal options for reimbursement of scleral lenses and most insurance companies do not directly cover the full cost of these lenses and thus can be a restraining factor in this aspect. Thus, it is a major growth concern, especially in some developing countries.

Other than this, certain side effects of the use of scleral lenses also have a negative impact on market growth. As per a retrospective study of keratoconus subjects examined between 2013 and 2018, conducted by the Southern College of Optometry, the complications of scleral lenses included 90.8% poor lens wetting, 84.8% lens fogging, 53% blurred vision, 34.8% ocular redness, 24.4% ocular dryness and 20.7% ocular pain and discomfort.

Thus, these abovementioned factors restrain the developmental growth of the scleral lenses market.
Country-wise Insights

What Makes the USA a Large Market for Scleral Lenses?

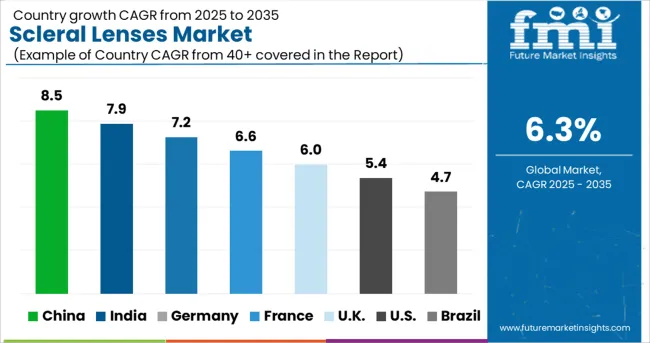
The USA dominates the North American region with total market revenue of about US$ 69.09 million, and a similar trend is expected over the forecast period.

Due to the strong demand for scleral lenses as a treatment choice for various eye disorders in the USA, the country dominates the North American market for scleral lenses. The increasing number of eye disorders in The USA is adding to the wider adoption of scleral lenses. For instance, as per the Cornea Research Foundation of America, approximately 50 to 200 of every 100,000 people are afflicted with keratoconus.

Hence, the sales of scleral lenses in the USA are quite high and are anticipated to grow moving forward.

What Makes Germany a Highly Lucrative Market for Scleral Lenses?

In 2021, Germany held a market share of about 44.7% in the Europe market.

Technical developments and growth in the usage of non-surgical eye care products are driving the industry forward. The development of a protective aqueous vault over the cornea, computer-assisted lens designs, computerized measurements of the topography of the ocular surface, and high-tech lens material qualities are a few examples of technical developments. Because of these technological developments, scleral lenses are now more widely used in Germany.

Thus, considering this factor, the market for scleral lenses in Germany is quite lucrative.

What is the Outlook of India in the Scleral Lenses Market?

India held approximately 59.8% market share in South Asia in 2021.

In terms of scleral lenses, India is expected to see faster growth rates because of the advancements in medical technology, government support for the treatment of eye problems, and a large patient base. The increasing population in India and the increasing number of eye diseases will eventually increase the adoption of scleral lenses in the region.

Thus, it has eventually boosted the availability of scleral lens products in India and is expected to show optimum growth in the forecast period.

Get the data you need at a Fraction of the cost

Personalize your report by choosing insights you need
and save 40%!

Category-wise Insights

Which Type of the Scleral Lenses is Driving Market Growth?

Mini scleral lenses are expected to present high growth at a CAGR of 4.9% by the end of the forecast period, with a contributing value of nearly US$ 79.2 million in the global market in 2021. Mini-scleral lenses are firm lenses with a large diameter that are used to restore vision when the cornea is deformed due to disease, scarring, or following a corneal graft operation. It is safe as well as well tolerated by many patients. The use of these lenses improves the quality of life. This is why the usage of mini scleral lenses is highest in the scleral lenses market.

Which Indication is the Most Commonly Addressed in the Scleral Lenses Market Globally?

Corneal irregularity is the most common indication and accounted for the largest revenue share globally valued at US$ 82.2 million in 2021. Corneal irregularities such as keratoconus and pellucid marginal degeneration are quite common. These instances are mostly known to be caused by genetic and environmental factors as well as collagen abnormalities. Corneal irregularity causes symptoms like distorted and blurry vision, sudden onset vision, or eye pain. The market is growing with the increase in cases of corneal irregularity.
Competitive Landscape

The leading companies engage in a variety of product launches, expansions, collaborations, mergers, and acquisitions to enhance their global presence and improve their business strategy.

The primary advertising tactics used by the major participants in the scleral lenses market are listed below:

  • On December 17, 2021, BostonSight launched the Smart360 scleral lens design software.
  • CooperVision Specialty EyeCare introduced the improved pupil optics for OnefitTM MED and OnefitTM MED+ scleral lenses on November 3, 2021.

Similarly, recent developments related to companies manufacturing scleral lenses, have been tracked by the team at Future Market Insights, which are available in the full report.

Report Scope as per Scleral Lenses Industry Analysis

Attribute Details
Forecast Period 2022 to 2032
Historical Data Available for 2012 to 2021
Market Analysis US$ million for Value, Units for Volume
Key Regions Covered North America, Latin America, Europe, East Asia, South Asia, Oceania, and Middle East & Africa
Key Countries Covered The USA Canada, Mexico, Brazil, Argentina, The United Kingdom, Germany, Italy, France, Spain, Russia, BENELUX, China, Japan, South Korea, India, Indonesia, Malaysia, Thailand, Australia, New Zealand, GCC Countries, Turkey, South Africa, and North Africa
Key Market Segments Covered Product, Indication, and Region
Key Companies Profiled
  • Cooper Vision
  • (VisionaryOptic) Euclid Systems
  • Bausch & Lomb
  • Art Optical Contact Lens, Inc.
  • AccuLens
  • Valley Contax Inc.
  • ABB Optical Group
  • EssilorLuxottica
  • Optact International Ltd.
  • Solotica, Smart Optics LLC
  • OPTO CENTER
  • OKVision
  • No7 Contact Lenses
  • Multilens AB
  • Laboratoire LCS
  • HERZ submicron lathing s.r.l.
  • Gelflex
  • Firma Concor Ltd.
  • Biolens Lab
  • Appenzeller Kontaktlinsen AG
  • Advanced Vision Technologies
  • Metro Optics
Pricing Available upon Request

Key Market Segments Covered in Scleral Lenses Industry Research

By Product:

  • Mini Scleral Lenses
  • Semi Scleral Lenses
  • Large Scleral

By Indication:

  • Corneal Irregularity
  • Surface Ocular Disease
  • Refractive Error
  • Others

By Region:

  • North America
  • Latin America
  • Europe
  • East Asia
  • South Asia
  • Oceania
  • Middle East and Africa (MEA)

Frequently Asked Questions

How much is the scleral lenses market estimated worth in 2022?

The global market for scleral lenses is estimated to be worth US$ 175.5 million in 2022.

What is the sales forecast for the scleral lenses market through 2032?

The scleral lenses market is expected to reach US$ 323.5 million by end of 2032 at a CAGR of 6.3%.

What are the trends driving the demand outlook of the global scleral lenses market?

Growing awareness regarding scleral lenses, a rising number of eye disorders, and expanded distribution networks of manufacturing companies, are some of the key trends in this market.

Which region has the highest market share in the global scleral lenses market?

North America dominated the global market accounting for the highest market share of 42.9% in 2021, while growing at a CAGR of close to 5.6%

What is the outlook of United Kingdom’s scleral lenses market?

The United Kingdom market contributes around US$ 14.9 million in 2021 in the Europe market.

How likely is the scleral lenses market to grow in India?

India accounts for about 59.8% of the market share of the South Asian market in 2021.

Which are the top five countries driving demand for the scleral lenses market?

The USA, Germany, The United Kingdom, India, and Australia are the top five countries, which are expected to drive demand in the global market.

What was the CAGR value growth for the scleral lenses market from 2012 to 2021?

From 2012 to 2021, the market for scleral lenses expanded at a CAGR of 3.0%.

What are the key market statistics for Australia market in the scleral lenses?

Australia accounted for 78.0% market share of the Oceania market in 2021.

What is the outlook of Germany in the scleral lenses market?

Germany held a market share of around 44.7% of the Europe market in 2021.

Table of Content
1. Executive Summary | Scleral Lenses Market

    1.1. Global Market Outlook

    1.2. Demand Side Trends

    1.3. Supply Side Trends

    1.4. Analysis and Recommendations

2. Market Overview

    2.1. Market Coverage / Taxonomy

    2.2. Market Definition / Scope / Limitations

    2.3. Inclusions and Exclusions

3. Key Market Trends

    3.1. Key Trends Impacting the Market

    3.2. Product Innovation / Development Trends

4. Key Success Factors

    4.1. Product Adoption / Usage Analysis

    4.2. Product Features / USPs Analysis

    4.3. Pipeline Assessment

    4.4. PESTLE Analysis

    4.5. Porter’s Analysis

    4.6. Key Promotional Strategies, by Manufacturers

5. Market Background

    5.1. Macro-Economic Factors

        5.1.1. Global GDP Growth Outlook

        5.1.2. Global Per-capita Healthcare Expenditure

        5.1.3. Global Contact Lens Market Outlook

    5.2. Forecast Factors - Relevance & Impact

        5.2.1. Historic Growth of Top Companies

        5.2.2. Cost of the Product

        5.2.3. Impact of New Technology

        5.2.4. Mergers and Acquisitions

        5.2.5. Product Adoption Rate

        5.2.6. Strategic Collaborations

    5.3. Dynamics

        5.3.1. Drivers

        5.3.2. Restraints

        5.3.3. Opportunity Analysis

6. COVID-19 Crisis - Impact Assessment

    6.1. COVID-19 and Impact Analysis

        6.1.1. By Product

        6.1.2. By Indication

        6.1.3. By Region

    6.2. 2021 Market Scenario

7. Global Market Demand (in Volume (Units)) Analysis 2012 to 2021 and Forecast, 2022 to 2032

    7.1. Historical Market Volume (Units) Analysis, 2012 to 2021

    7.2. Current and Future Market Volume (Units) Projections, 2022 to 2032

        7.2.1. Y-o-Y Growth Trend Analysis

8. Global Market - Pricing Analysis

    8.1. Regional Pricing Analysis By Product

    8.2. Pricing Break-up

        8.2.1. Manufacturer Level Pricing

        8.2.2. Distributor Level Pricing

    8.3. Global Average Pricing Analysis Benchmark

    8.4. Pricing Assumptions

9. Global Market Demand (in Value or Size in US$ million) Analysis 2012 to 2021 and Forecast, 2022 to 2032

    9.1. Historical Market Value (US$ million) Analysis, 2012 to 2021

    9.2. Current and Future Market Value (US$ million) Projections, 2022 to 2032

        9.2.1. Y-o-Y Growth Trend Analysis

        9.2.2. Absolute $ Opportunity Analysis

10. Global Market Analysis, By Product

    10.1. Introduction / Key Findings

    10.2. Historical Market Size (US$ million) and Volume (Units) Analysis By Product, 2012 to 2021

    10.3. Current and Future Market Size (US$ million) and Volume (Units) Analysis and Forecast By Product, 2022 to 2032

        10.3.1. Mini Scleral Lens

        10.3.2. Semi Scleral Lens

        10.3.3. Large Scleral

    10.4. Market Attractiveness Analysis By Product

11. Global Market Analysis, By Indication

    11.1. Introduction / Key Findings

    11.2. Historical Market Size (US$ million) Analysis by Indication, 2012 to 2021

    11.3. Current and Future Market Size (US$ million) Analysis and Forecast by Indication, 2022 to 2032

        11.3.1. Corneal Irregularity

        11.3.2. Surface Ocular Disease

        11.3.3. Refractive Error

        11.3.4. Others

    11.4. Market Attractiveness Analysis by Indication

12. Global Market Analysis, By Region

    12.1. Introduction

    12.2. Historical Market Size (US$ million) and Volume (Units) Analysis by Region, 2012 to 2021

    12.3. Current and Future Market Size (US$ million) and Volume (Units) Analysis and Forecast by Region, 2022 to 2032

        12.3.1. North America

        12.3.2. Latin America

        12.3.3. Europe

        12.3.4. East Asia

        12.3.5. South Asia

        12.3.6. Oceania

        12.3.7. Middle East and Africa (MEA)

    12.4. Market Attractiveness Analysis by Region

13. North America Market Analysis

    13.1. Introduction

    13.2. Historical Market Size (US$ million) and Volume (Units) Analysis by Market Taxonomy, 2012 to 2021

    13.3. Current and Future Market Size (US$ million) and Volume (Units) Analysis and Forecast by Market Taxonomy, 2022 to 2032

        13.3.1. By Country

            13.3.1.1. The USA

            13.3.1.2. Canada

        13.3.2. By Product

        13.3.3. By Indication

    13.4. Market Attractiveness Analysis

        13.4.1. By Country

        13.4.2. By Product

        13.4.3. By Indication

    13.5. Country-Level Analysis & Forecast

        13.5.1. The USA Market Analysis

            13.5.1.1. . Introduction

            13.5.1.2. Key Market Trends

            13.5.1.3. Market Analysis and Forecast by Market Taxonomy

                13.5.1.3.1. By Product

                13.5.1.3.2. By Indication

        13.5.2. Canada Market Analysis

            13.5.2.1. Introduction

            13.5.2.2. Market Analysis and Forecast by Market Taxonomy

                13.5.2.2.1. By Product

                13.5.2.2.2. By Indication

    13.6. Key Market Participants - Intensity Mapping

    13.7. Drivers and Restraints - Impact Analysis

14. Latin America Market Analysis

    14.1. Introduction

    14.2. Historical Market Size (US$ million) and Volume (Units) Analysis by Market Taxonomy, 2012 to 2021

    14.3. Current and Future Market Size (US$ million) and Volume (Units) Analysis and Forecast by Market Taxonomy, 2022 to 2032

        14.3.1. By Country

            14.3.1.1. Mexico

            14.3.1.2. Brazil

            14.3.1.3. Argentina

            14.3.1.4. Rest of Latin America

        14.3.2. By Product

        14.3.3. By Indication

    14.4. Market Attractiveness Analysis

        14.4.1. By Country

        14.4.2. By Product

        14.4.3. By Indication

    14.5. Country-Level Analysis & Forecast

        14.5.1. Mexico Market Analysis

            14.5.1.1. Introduction

            14.5.1.2. Market Analysis and Forecast by Market Taxonomy

                14.5.1.2.1. By Product

                14.5.1.2.2. By Indication

        14.5.2. Brazil Market Analysis

            14.5.2.1. Introduction

            14.5.2.2. Market Analysis and Forecast by Market Taxonomy

                14.5.2.2.1. By Product

                14.5.2.2.2. By Indication

        14.5.3. Argentina Market Analysis

            14.5.3.1. Introduction

            14.5.3.2. Market Analysis and Forecast by Market Taxonomy

                14.5.3.2.1. By Product

                14.5.3.2.2. By Indication

    14.6. Key Market Participants - Intensity Mapping

    14.7. Drivers and Restraints - Impact Analysis

15. Europe Market Analysis

    15.1. Introduction

    15.2. Historical Market Size (US$ million) and Volume (Units) Analysis by Market Taxonomy, 2012 to 2021

    15.3. Current and Future Market Size (US$ million) and Volume (Units) Analysis and Forecast by Market Taxonomy, 2022 to 2032

        15.3.1. By Country

            15.3.1.1. The United Kingdom

            15.3.1.2. Germany

            15.3.1.3. Italy

            15.3.1.4. France

            15.3.1.5. Spain

            15.3.1.6. Russia

            15.3.1.7. BENELUX

            15.3.1.8. Rest of Europe

        15.3.2. By Product

        15.3.3. By Indication

    15.4. Market Attractiveness Analysis

        15.4.1. By Country

        15.4.2. By Product

        15.4.3. By Indication

    15.5. Country-Level Analysis & Forecast

        15.5.1. The United Kingdom Market Analysis

            15.5.1.1. Introduction

            15.5.1.2. Market Analysis and Forecast by Market Taxonomy

                15.5.1.2.1. By Product

                15.5.1.2.2. By Indication

        15.5.2. Germany Market Analysis

            15.5.2.1. Introduction

            15.5.2.2. Market Analysis and Forecast by Market Taxonomy

                15.5.2.2.1. By Product

                15.5.2.2.2. By Indication

        15.5.3. Italy Market Analysis

            15.5.3.1. Introduction

            15.5.3.2. Market Analysis and Forecast by Market Taxonomy

                15.5.3.2.1. By Product

                15.5.3.2.2. By Indication

        15.5.4. France Market Analysis

            15.5.4.1. Introduction

            15.5.4.2. Market Analysis and Forecast by Market Taxonomy

                15.5.4.2.1. By Product

                15.5.4.2.2. By Indication

        15.5.5. Spain Market Analysis

            15.5.5.1. Introduction

            15.5.5.2. Market Analysis and Forecast by Market Taxonomy

                15.5.5.2.1. By Product

                15.5.5.2.2. By Indication

        15.5.6. Russia Market Analysis

            15.5.6.1. Introduction

            15.5.6.2. Market Analysis and Forecast by Market Taxonomy

                15.5.6.2.1. By Product

                15.5.6.2.2. By Indication

        15.5.7. BENELUX Market Analysis

            15.5.7.1. Introduction

            15.5.7.2. Market Analysis and Forecast by Market Taxonomy

                15.5.7.2.1. By Product

                15.5.7.2.2. By Indication

    15.6. Key Market Participants - Intensity Mapping

    15.7. Drivers and Restraints - Impact Analysis

16. East Asia Market Analysis

    16.1. Introduction

    16.2. Historical Market Size (US$ million) and Volume (Units) Analysis by Market Taxonomy, 2012 to 2021

    16.3. Current and Future Market Size (US$ million) and Volume (Units) Analysis and Forecast by Market Taxonomy, 2022 to 2032

        16.3.1. By Country

            16.3.1.1. China

            16.3.1.2. Japan

            16.3.1.3. South Korea

        16.3.2. By Product

        16.3.3. By Indication

    16.4. Market Attractiveness Analysis

        16.4.1. By Country

        16.4.2. By Product

        16.4.3. By Indication

    16.5. Country-Level Analysis & Forecast

        16.5.1. China Market Analysis

            16.5.1.1. Introduction

            16.5.1.2. Market Analysis and Forecast by Market Taxonomy

                16.5.1.2.1. By Product

                16.5.1.2.2. By Indication

        16.5.2. Japan Market Analysis

            16.5.2.1. Introduction

            16.5.2.2. Market Analysis and Forecast by Market Taxonomy

                16.5.2.2.1. By Product

                16.5.2.2.2. By Indication

        16.5.3. South Korea Market Analysis

            16.5.3.1. Introduction

            16.5.3.2. Market Analysis and Forecast by Market Taxonomy

                16.5.3.2.1. By Product

                16.5.3.2.2. By Indication

    16.6. Key Market Participants - Intensity Mapping

    16.7. Drivers and Restraints - Impact Analysis

17. South Asia Market Analysis

    17.1. Introduction

    17.2. Historical Market Size (US$ million) and Volume (Units) Analysis by Market Taxonomy, 2012 to 2021

    17.3. Current and Future Market Size (US$ million) and Volume (Units) Analysis and Forecast by Market Taxonomy, 2022 to 2032

        17.3.1. By Country

            17.3.1.1. India

            17.3.1.2. Indonesia

            17.3.1.3. Malaysia

            17.3.1.4. Thailand

            17.3.1.5. Rest of South Asia

        17.3.2. By Product

        17.3.3. By Indication

    17.4. Market Attractiveness Analysis

        17.4.1. By Country

        17.4.2. By Product

        17.4.3. By Indication

    17.5. Country-Level Analysis & Forecast

        17.5.1. India Market Analysis

            17.5.1.1. Introduction

            17.5.1.2. Market Analysis and Forecast by Market Taxonomy

                17.5.1.2.1. By Product

                17.5.1.2.2. By Indication

        17.5.2. Indonesia Market Analysis

            17.5.2.1. Introduction

            17.5.2.2. Market Analysis and Forecast by Market Taxonomy

                17.5.2.2.1. By Product

                17.5.2.2.2. By Indication

        17.5.3. Malaysia Market Analysis

            17.5.3.1. Introduction

            17.5.3.2. Market Analysis and Forecast by Market Taxonomy

                17.5.3.2.1. By Product

                17.5.3.2.2. By Indication

        17.5.4. Thailand Market Analysis

            17.5.4.1. Introduction

            17.5.4.2. Market Analysis and Forecast by Market Taxonomy

                17.5.4.2.1. By Product

                17.5.4.2.2. By Indication

    17.6. Key Market Participants - Intensity Mapping

    17.7. Drivers and Restraints - Impact Analysis

18. Oceania Market Analysis

    18.1. Introduction

    18.2. Historical Market Size (US$ million) and Volume (Units) Analysis by Market Taxonomy, 2012 to 2021

    18.3. Current and Future Market Size (US$ million) and Volume (Units) Analysis and Forecast by Market Taxonomy, 2022 to 2032

        18.3.1. By Country

            18.3.1.1. Australia

            18.3.1.2. New Zealand

        18.3.2. By Product

        18.3.3. By Indication

    18.4. Market Attractiveness Analysis

        18.4.1. By Country

        18.4.2. By Product

        18.4.3. By Indication

    18.5. Country-Level Analysis & Forecast

        18.5.1. Australia Market Analysis

            18.5.1.1. Introduction

            18.5.1.2. Market Analysis and Forecast by Market Taxonomy

                18.5.1.2.1. By Product

                18.5.1.2.2. By Indication

        18.5.2. New Zealand Market Analysis

            18.5.2.1. Introduction

            18.5.2.2. Market Analysis and Forecast by Market Taxonomy

                18.5.2.2.1. By Product

                18.5.2.2.2. By Indication

    18.6. Key Market Participants - Intensity Mapping

    18.7. Drivers and Restraints - Impact Analysis

19. Middle East and Africa Market Analysis

    19.1. Introduction

    19.2. Historical Market Size (US$ million) and Volume (Units) Analysis by Market Taxonomy, 2012 to 2021

    19.3. Current and Future Market Size (US$ million) and Volume (Units) Analysis and Forecast by Market Taxonomy, 2022 to 2032

        19.3.1. By Country

            19.3.1.1. GCC Countries

            19.3.1.2. Turkey

            19.3.1.3. South Africa

            19.3.1.4. North Africa

            19.3.1.5. Rest of Middle East and Africa

        19.3.2. By Product

        19.3.3. By Indication

    19.4. Market Attractiveness Analysis

        19.4.1. By Country

        19.4.2. By Product

        19.4.3. By Indication

    19.5. Country-Level Analysis & Forecast

        19.5.1. GCC Countries Market Analysis

            19.5.1.1. Introduction

            19.5.1.2. Market Analysis and Forecast by Market Taxonomy

                19.5.1.2.1. By Product

                19.5.1.2.2. By Indication

        19.5.2. Turkey Market Analysis

            19.5.2.1. Introduction

            19.5.2.2. Market Analysis and Forecast by Market Taxonomy

                19.5.2.2.1. By Product

                19.5.2.2.2. By Indication

        19.5.3. South Africa Market Analysis

            19.5.3.1. Introduction

            19.5.3.2. Market Analysis and Forecast by Market Taxonomy

                19.5.3.2.1. By Product

                19.5.3.2.2. By Indication

        19.5.4. North Africa Market Analysis

            19.5.4.1. Introduction

            19.5.4.2. Market Analysis and Forecast by Market Taxonomy

                19.5.4.2.1. By Product

                19.5.4.2.2. By Indication

    19.6. Key Market Participants - Intensity Mapping

    19.7. Drivers and Restraints - Impact Analysis

20. Market Structure Analysis

    20.1. Market Analysis by Tier of Companies

    20.2. Market Share Analysis of Top Players

    20.3. Market Concentration

    20.4. Market Presence Analysis

21. Competition Analysis

    21.1. Competition Dashboard

    21.2. Competition Deep Dive

        21.2.1. Cooper Vision

            21.2.1.1. Overview

            21.2.1.2. Product Portfolio

            21.2.1.3. Sales Footprint

            21.2.1.4. Key Financials

            21.2.1.5. SWOT Analysis

            21.2.1.6. Strategy Overview

                21.2.1.6.1. Marketing Strategy

                21.2.1.6.2. Product Strategy

                21.2.1.6.3. Channel Strategy

        21.2.2. (VisionaryOptic) Euclid Systems

            21.2.2.1. Overview

            21.2.2.2. Product Portfolio

            21.2.2.3. Sales Footprint

            21.2.2.4. Key Financials

            21.2.2.5. SWOT Analysis

            21.2.2.6. Strategy Overview

                21.2.2.6.1. Marketing Strategy

                21.2.2.6.2. Product Strategy

                21.2.2.6.3. Channel Strategy

        21.2.3. Bausch & Lomb

            21.2.3.1. Overview

            21.2.3.2. Product Portfolio

            21.2.3.3. Sales Footprint

            21.2.3.4. Key Financials

            21.2.3.5. SWOT Analysis

            21.2.3.6. Strategy Overview

                21.2.3.6.1. Marketing Strategy

                21.2.3.6.2. Product Strategy

                21.2.3.6.3. Channel Strategy

        21.2.4. Art Optical Contact Lens, Inc.

            21.2.4.1. Overview

            21.2.4.2. Product Portfolio

            21.2.4.3. Sales Footprint

            21.2.4.4. Key Financials

            21.2.4.5. SWOT Analysis

            21.2.4.6. Strategy Overview

                21.2.4.6.1. Marketing Strategy

                21.2.4.6.2. Product Strategy

                21.2.4.6.3. Channel Strategy

        21.2.5. AccuLens

            21.2.5.1. Overview

            21.2.5.2. Product Portfolio

            21.2.5.3. Sales Footprint

            21.2.5.4. Key Financials

            21.2.5.5. SWOT Analysis

            21.2.5.6. Strategy Overview

                21.2.5.6.1. Marketing Strategy

                21.2.5.6.2. Product Strategy

                21.2.5.6.3. Channel Strategy

        21.2.6. Valley Contax Inc.

            21.2.6.1. Overview

            21.2.6.2. Product Portfolio

            21.2.6.3. Sales Footprint

            21.2.6.4. Key Financials

            21.2.6.5. SWOT Analysis

            21.2.6.6. Strategy Overview

                21.2.6.6.1. Marketing Strategy

                21.2.6.6.2. Product Strategy

                21.2.6.6.3. Channel Strategy

        21.2.7. ABB Optical Group

            21.2.7.1. Overview

            21.2.7.2. Product Portfolio

            21.2.7.3. Sales Footprint

            21.2.7.4. Key Financials

            21.2.7.5. SWOT Analysis

            21.2.7.6. Strategy Overview

                21.2.7.6.1. Marketing Strategy

                21.2.7.6.2. Product Strategy

                21.2.7.6.3. Channel Strategy

        21.2.8. EssilorLuxottica

            21.2.8.1. Overview

            21.2.8.2. Product Portfolio

            21.2.8.3. Sales Footprint

            21.2.8.4. Key Financials

            21.2.8.5. SWOT Analysis

            21.2.8.6. Strategy Overview

                21.2.8.6.1. Marketing Strategy

                21.2.8.6.2. Product Strategy

                21.2.8.6.3. Channel Strategy

        21.2.9. Optact International Ltd.

            21.2.9.1. Overview

            21.2.9.2. Product Portfolio

            21.2.9.3. Sales Footprint

            21.2.9.4. Key Financials

            21.2.9.5. SWOT Analysis

            21.2.9.6. Strategy Overview

                21.2.9.6.1. Marketing Strategy

                21.2.9.6.2. Product Strategy

                21.2.9.6.3. Channel Strategy

        21.2.10. Solotica, Smart Optics LLC

            21.2.10.1. Overview

            21.2.10.2. Product Portfolio

            21.2.10.3. Sales Footprint

            21.2.10.4. Key Financials

            21.2.10.5. SWOT Analysis

            21.2.10.6. Strategy Overview

                21.2.10.6.1. Marketing Strategy

                21.2.10.6.2. Product Strategy

                21.2.10.6.3. Channel Strategy

        21.2.11. OPTO CENTAR

            21.2.11.1. Overview

            21.2.11.2. Product Portfolio

            21.2.11.3. Sales Footprint

            21.2.11.4. Key Financials

            21.2.11.5. SWOT Analysis

            21.2.11.6. Strategy Overview

                21.2.11.6.1. Marketing Strategy

                21.2.11.6.2. Product Strategy

                21.2.11.6.3. Channel Strategy

        21.2.12. OKVision

            21.2.12.1. Overview

            21.2.12.2. Product Portfolio

            21.2.12.3. Sales Footprint

            21.2.12.4. Key Financials

            21.2.12.5. SWOT Analysis

            21.2.12.6. Strategy Overview

                21.2.12.6.1. Marketing Strategy

                21.2.12.6.2. Product Strategy

                21.2.12.6.3. Channel Strategy

        21.2.13. No7 Contact Lenses

            21.2.13.1. Overview

            21.2.13.2. Product Portfolio

            21.2.13.3. Sales Footprint

            21.2.13.4. Key Financials

            21.2.13.5. SWOT Analysis

            21.2.13.6. Strategy Overview

                21.2.13.6.1. Marketing Strategy

                21.2.13.6.2. Product Strategy

                21.2.13.6.3. Channel Strategy

        21.2.14. Multilens AB

            21.2.14.1. Overview

            21.2.14.2. Product Portfolio

            21.2.14.3. Sales Footprint

            21.2.14.4. Key Financials

            21.2.14.5. SWOT Analysis

            21.2.14.6. Strategy Overview

                21.2.14.6.1. Marketing Strategy

                21.2.14.6.2. Product Strategy

                21.2.14.6.3. Channel Strategy

        21.2.15. Laboratoire LCS

            21.2.15.1. Overview

            21.2.15.2. Product Portfolio

            21.2.15.3. Sales Footprint

            21.2.15.4. Key Financials

            21.2.15.5. SWOT Analysis

            21.2.15.6. Strategy Overview

                21.2.15.6.1. Marketing Strategy

                21.2.15.6.2. Product Strategy

                21.2.15.6.3. Channel Strategy

        21.2.16. HERZ submicron lathing s.r.l.

            21.2.16.1. Overview

            21.2.16.2. Product Portfolio

            21.2.16.3. Sales Footprint

            21.2.16.4. Key Financials

            21.2.16.5. SWOT Analysis

            21.2.16.6. Strategy Overview

                21.2.16.6.1. Marketing Strategy

                21.2.16.6.2. Product Strategy

                21.2.16.6.3. Channel Strategy

        21.2.17. Gelflex

            21.2.17.1. Overview

            21.2.17.2. Product Portfolio

            21.2.17.3. Sales Footprint

            21.2.17.4. Key Financials

            21.2.17.5. SWOT Analysis

            21.2.17.6. Strategy Overview

                21.2.17.6.1. Marketing Strategy

                21.2.17.6.2. Product Strategy

                21.2.17.6.3. Channel Strategy

        21.2.18. Firma Concor Ltd.

            21.2.18.1. Overview

            21.2.18.2. Product Portfolio

            21.2.18.3. Sales Footprint

            21.2.18.4. Key Financials

            21.2.18.5. SWOT Analysis

            21.2.18.6. Strategy Overview

                21.2.18.6.1. Marketing Strategy

                21.2.18.6.2. Product Strategy

                21.2.18.6.3. Channel Strategy

        21.2.19. Biolens Lab

            21.2.19.1. Overview

            21.2.19.2. Product Portfolio

            21.2.19.3. Sales Footprint

            21.2.19.4. Key Financials

            21.2.19.5. SWOT Analysis

            21.2.19.6. Strategy Overview

                21.2.19.6.1. Marketing Strategy

                21.2.19.6.2. Product Strategy

                21.2.19.6.3. Channel Strategy

        21.2.20. Appenzeller Kontaktlinsen AG

            21.2.20.1. Overview

            21.2.20.2. Product Portfolio

            21.2.20.3. Sales Footprint

            21.2.20.4. Key Financials

            21.2.20.5. SWOT Analysis

            21.2.20.6. Strategy Overview

                21.2.20.6.1. Marketing Strategy

                21.2.20.6.2. Product Strategy

                21.2.20.6.3. Channel Strategy

        21.2.21. Advanced Vision Technologies

            21.2.21.1. Overview

            21.2.21.2. Product Portfolio

            21.2.21.3. Sales Footprint

            21.2.21.4. Key Financials

            21.2.21.5. SWOT Analysis

            21.2.21.6. Strategy Overview

                21.2.21.6.1. Marketing Strategy

                21.2.21.6.2. Product Strategy

                21.2.21.6.3. Channel Strategy

        21.2.22. Metro Optics

            21.2.22.1. Overview

            21.2.22.2. Product Portfolio

            21.2.22.3. Sales Footprint

            21.2.22.4. Key Financials

            21.2.22.5. SWOT Analysis

            21.2.22.6. Strategy Overview

                21.2.22.6.1. Marketing Strategy

                21.2.22.6.2. Product Strategy

                21.2.22.6.3. Channel Strategy

22. Assumptions and Acronyms Used

23. Research Methodology
Recommendations

Healthcare

Implantable Collamer Lens Market

July 2022

REP-GB-15174

April 2024

250 pages

Healthcare

Dry Eye Syndrome Treatment Market

February 2022

REP-GB-1215

October 2023

324 pages

Healthcare

New Born Eye Imaging Systems Market

June 2017

REP-GB-4130

July 2022

333 pages

Explore Healthcare Insights

View Reports