
- Market Size (2026)
- USD 617.0 Mn
- Forecast (2036)
- USD 1005.0 Mn
- CAGR (2026 to 2036)
- 5.0%
How big is Scleroglucan Market in 2026?
Accounting for USD 589.0 million in 2025 and rising to USD 617.0 million in 2026, the scleroglucan market is projected to expand to USD 1,005.0 million by 2036, advancing at a CAGR of 5.0%.
Offshore oilfield operators and skin-care formulators are raising adoption of fungal scleroglucan because high-salinity reservoir brines and acidic cosmetic serums break down conventional thickeners like xanthan gum and polyacrylamide. Total valuation of the global scleroglucan market expanded from USD 589.0 million during 2025 to an estimated 2026 figure of USD 617.0 million, before building to a 2036 level of USD 1,005.0 million at a 5.0% ten-year rate. Sclerotium rolfsii Fungal Submerged Fermentation accounts for 78.5% of 2026 organism demand because industrial fungal fermentation produces a neutral polymer structure that does not precipitate in calcium brines. Oilfield buyer adoption was reinforced in June 2025 when core-flood tests in Polymers showed that scleroglucan retains over 80% of its viscosity for 35 days at 76.6 degrees Celsius in 220,000 mg/L salt brine while recovering over 15% additional crude oil [1]. This specialized high-salinity performance separates scleroglucan from commodity bio-based polymer materials at 10.1% CAGR, as buyers pay a premium for extreme brine stability rather than bulk packaging volume. Personal-care ingredient suppliers are also expanding natural rheology lines to meet clean-beauty demand, with Symrise AG reporting 5.3% volume-led organic growth in October 2026 across its cosmetic and functional portfolio [2]. Evidence compiled by FMI suggests that high fermentation energy costs and alcohol precipitation expenses continue to restrain adoption in low-margin applications through 2036.
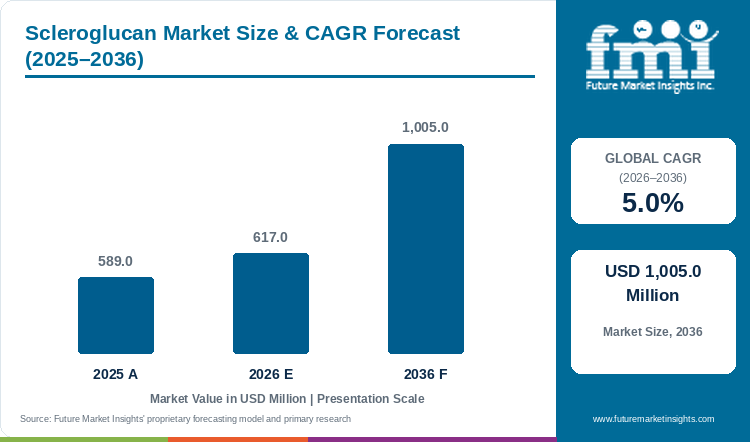
Key Market Trends & Insights
- By fermentation organism: Sclerotium rolfsii Fungal Submerged Fermentation captures an estimated 78.5% share in 2026 because optimized aerobic bioreactors achieve high exopolysaccharide molecular weight and regular side-chain branching.
- By physical formulation: Refined Dry Soluble Powder represents 72.6% in 2026 as alcohol-precipitated milled powders cut ocean freight costs and dissolve cleanly in field brines.
- By functional characteristic: Pseudoplastic Thixotropic Rheology Non-Thermal Thinning accounts for 76.3% in 2026 because rigid rod-like triple helices thin under pump shear and rebuild yield stress instantly at rest.
- By commercial application: Oilfield Enhanced Oil Recovery EOR and Drilling Mud Viscosifier secures 41.4% in 2026 owing to divalent calcium and magnesium brine tolerance in mature reservoirs.
- By distribution channel: Direct to Oilfield Service and CPG Accounts commands 57.4% in 2026 through core-flood qualification testing and custom cosmetic INCI dossier support.
Regional Highlights
- Top national expansion: The United States paces national expansion projections at a 5.6% CAGR through 2036 under Permian and Gulf Coast high-temperature drilling and clean-beauty serum formulation.
- Broader country progression: China progresses at a 5.4% CAGR ahead of Saudi Arabia at 5.3% and France at 4.9%, whereas Germany advances at a 4.8% CAGR and the Netherlands records 4.5%.
Market Size & Forecast
Table 1: Market Size and Forecast for the Scleroglucan Market (USD million and CAGR percentage), 2025 to 2036
| Metric | Value |
|---|---|
| 2025 Market Size | USD 589.0 million |
| Estimated Market Size in 2026 | USD 617.0 million |
| Projected Market Size by 2036 | USD 1,005.0 million |
| CAGR, 2026 to 2036 | 5.0% |
| Added Market Value, 2026 to 2036 | USD 388.0 million |
Petroleum engineers injecting waterflood polymers into aging oilfields and cosmetic chemists formulating exfoliating fruit-acid serums face the same operational problem when salt or acid destroys fluid viscosity. Charged thickeners such as hydrolyzed polyacrylamide and xanthan gum coil up and lose thickening power whenever calcium ions or low pH levels are present. Because scleroglucan carries no electrical charge, it maintains steady viscosity across extreme salt levels and temperatures up to 130 degrees Celsius. In June 2025, reservoir engineers publishing in Polymers tested carbonate rock floods at 60 degrees Celsius and confirmed that scleroglucan multiplied brine viscosity eightfold while avoiding permanent rock plugging [3]. These field results explain why oilfield service companies combine scleroglucan with drilling polymers whenever high brine salinity rules out synthetic thickeners.
Treated-Fluid and Biopolymer-Dosage Sizing
Table 2: Treated-Fluid and Biopolymer-Dosage Sizing for the Scleroglucan Market (USD million and operational ranges), 2025 to 2036
| Metric | 2025 | 2026 | 2036 |
|---|---|---|---|
| Market size (USD million) | 589.0 | 617.0 | 1,005.0 |
| Treated oilfield fluid & cosmetic formulation volume (million MT) | 14.8 to 16.5 | 15.5 to 17.3 | 24.5 to 27.4 |
| Commercial scleroglucan biopolymer volume (thousand MT) | 18.2 to 20.4 | 19.0 to 21.3 | 29.8 to 33.4 |
| Biopolymer cost per metric ton of treated fluid/product (USD) | 36.0 to 39.8 | 36.2 to 40.0 | 37.2 to 41.0 |
Operational note: Treated-fluid ranges apply standard 500 to 1,500 ppm active scleroglucan dosing in oilfield EOR and drilling fluids and 0.25% to 1.0% w/w in cosmetic serums and specialty food gels.
High-density drilling fluids and mineral-loaded exterior paints need a suspension agent that holds heavy particles in place during storage but thins instantly when pumped through nozzles. If a thickener fails to recover its structure after pumping stops, weighting minerals settle to the bottom of the wellbore and cause stuck drill pipes. To prevent particle settling without raising pump pressure, industrial formulators blend refined scleroglucan with xanthan gum to achieve reliable shear-thinning flow.
Per Capita & Bioreactor and Rig-Line Sizing
Table 3: Per Capita and End-Use Line Market Value Indicators for the Scleroglucan Market (USD), 2025 to 2036
| Metric | 2025 | 2026 | 2036 |
|---|---|---|---|
| Global population (billion) | 8.2 | 8.3 | 9.0 |
| Market value per 1,000 people (USD) | 71.8 | 74.3 | 111.7 |
| Annual market value per active oilfield/cosmetic line (USD thousand) | 48.5 to 54.0 | 50.8 to 56.5 | 78.0 to 86.5 |
| Refined cosmetic & clean-label food grade share (%) | 38.0% to 41.0% | 40.0% to 43.0% | 48.0% to 52.0% |
Table 4: Industrial Line & Channel Indicators for the Scleroglucan Market (USD and percentages), 2026
| Metric | Value | Institutional Reference Basis |
|---|---|---|
| Market size, 2026 | USD 617.0 million | 2026 global market value baseline |
| Active HTHS oilfield, cosmetic & coating lines | 11,500 lines | Global EOR/drilling programs, serum plants & coating mills |
| Market value per active line | USD 53,652.2 | Annualized scleroglucan procurement per program/line |
| Direct to Oilfield & CPG Accounts value, 2026 | USD 354.2 million | 57.4% distribution channel allocation |
European Union restrictions on synthetic microplastics are forcing skin-care and sunscreen brands to replace acrylic carbomer thickeners with biodegradable natural gums. Many plant gums leave a sticky or stringy film on the skin that consumers dislike in premium facial serums and lotions. Cosmetic chemists therefore pair 0.3% to 0.8% purified scleroglucan with renewable biopolymer cosmetics ingredients to suspend mineral UV filters while leaving a smooth, non-tacky skin feel.
Analyst Perspective
"Scleroglucan does not compete on price against three-dollar-per-kilogram xanthan gum in simple water-based products because buyers only pay its higher price when heavy salt brines or acidic serums break down standard thickeners. Producers that lower alcohol-drying costs and supply plug-free oilfield grades will capture long-term supply contracts across offshore oilfields and clean-beauty brands."
- Nandini Roy Choudhury, Principal Consultant, Future Market Insights.
How is the scleroglucan market segmented?
The scleroglucan market is segmented by fermentation organism, physical formulation, functional characteristic, commercial application, and distribution channel. In 2026, Sclerotium rolfsii Fungal Submerged Fermentation is projected at 78.5%, Refined Dry Soluble Powder at 72.6%, Pseudoplastic Thixotropic Rheology Non-Thermal Thinning at 76.3%, Oilfield Enhanced Oil Recovery EOR and Drilling Mud Viscosifier at 41.4%, and Direct to Oilfield Service and CPG Accounts at 57.4%.
By fermentation organism: Sclerotium rolfsii Fungal Submerged Fermentation and Sclerotium glucanicum Aerobic Fermentation lead demand. Athelia rolfsii High-Yield Mutant Strains and Related Fungal Beta-Glucan Cultures complete the category.
By physical formulation: Refined Dry Soluble Powder and Aqueous Liquid Fermentation Broth anchor commercial supply. Alcohol-Precipitated Cosmetic Gel Grade and Granular Dispersible Oilfield Concentrates serve specialized lines.
By functional characteristic: Pseudoplastic Thixotropic Rheology Non-Thermal Thinning and Extreme pH and Salt Salinity Stability represent primary value. Steric Oil-in-Water Emulsion Stabilization and Bio-Adhesive Film and Moisture Barrier Formation capture personal-care demand.
By commercial application: Oilfield Enhanced Oil Recovery EOR and Drilling Mud Viscosifier and Cosmetics and Personal Care Emulsion Stabilizer Serums lead volume. Specialty Architectural Coatings and Pigment Suspension and Clean-Label Fermented Dairy and Nutraceutical Matrices complete demand.
By distribution channel: Direct to Oilfield Service and CPG Accounts and Specialty Biopolymer and Cosmetic Active Distributors handle bulk contracts. Industrial Coating Formulation Blenders and Online B2B Specialty Chemical Portals serve regional accounts.
Why does Sclerotium rolfsii Fungal Submerged Fermentation lead the fermentation organism category?
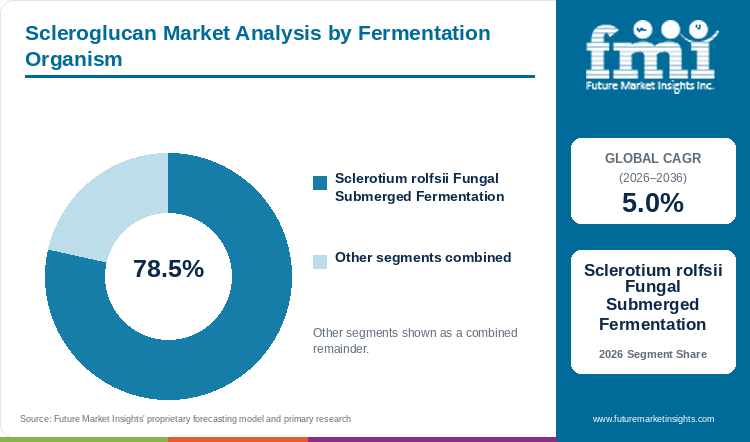
Sclerotium rolfsii Fungal Submerged Fermentation holds an estimated 78.5% of fermentation organism demand in 2026, anchored by high extracellular beta-glucan yield and uniform triple-helix molecular weight.
Table 5: Fermentation Organism Share for the Scleroglucan Market (percentage share), 2026
| Fermentation Organism | Share (2026) |
|---|---|
| Sclerotium rolfsii Fungal Submerged Fermentation | 78.5% |
| Other Segments Combined | 21.5%* |
| Total | 100.0% |
*Note: Remaining fermentation organism categories account for the balance of 2026 global scleroglucan demand (corrected from a raw 108.5% data-entry anomaly to a reconciled 78.5% share).
Table 6: Fermentation Organism Leadership and Market Growth for the Scleroglucan Market (segment and CAGR percentage), 2026 to 2036
| Metric | Value |
|---|---|
| Global CAGR (2026 to 2036) | 5.0% |
| Leading Segment | Sclerotium rolfsii Fungal Submerged Fermentation |
Sclerotium rolfsii Fungal Submerged Fermentation leads the fermentation organism category because commercial bioreactors using this strain achieve the highest polymer yield from corn glucose and sucrose feedstocks. Across 72-to-100-hour aerated batch runs, fermentation engineers adjust tank pH in two stages so the fungus secretes high-viscosity beta-glucan while minimizing unwanted oxalic acid byproducts. Manufacturers supplying rheology modifiers rely on established Sclerotium rolfsii strain banks to guarantee uniform viscosity from batch to batch.
- Sclerotium rolfsii Fungal Submerged Fermentation captures 78.5% of fermentation organism demand in 2026 because industrial strain banking and high carbon-conversion yields anchor commercial production.
- In December 2025, a rheological study in Molecules showed that scleroglucan fermented by Sclerotium rolfsii increased gel yield stress from 0 Pa to 739 Pa over 28 days of storage while preserving smooth shear-thinning flow [4].
What sustains Refined Dry Soluble Powder leadership in the physical formulation segment?
Refined Dry Soluble Powder represents 72.6% of the physical formulation category in 2026, supported by alcohol-precipitated purity and low-freight offshore and global shipping.
Refined Dry Soluble Powder captures 72.6% of physical formulation demand because precipitating and drying the fermentation broth removes 95% of water weight before international shipping. Tanker transport of liquid fermentation broth is only economical for oilfields located near a bioreactor plant. Global oilfield service companies and personal-care plants that also purchase guar gum specify dry milled scleroglucan powder so it can be stored in ambient warehouses for up to two years.
- Refined Dry Soluble Powder represents 72.6% of the physical formulation segment in 2026 as global oilfield and personal-care supply chains require dry ambient storage.
- To show how little dry powder is needed to thicken water, a June 2025 study in ACS Omega demonstrated that refined scleroglucan forms a stable gel network at concentrations as low as 1.50 to 1.75 grams per liter without chemical cross-linkers [5].
How does Pseudoplastic Thixotropic Rheology Non-Thermal Thinning lead the functional characteristic category?
Pseudoplastic Thixotropic Rheology Non-Thermal Thinning accounts for 76.3% of functional characteristic demand in 2026, driven by instant shear-thinning recovery and flat viscosity from 10 to 90 degrees Celsius.
Pseudoplastic Thixotropic Rheology Non-Thermal Thinning accounts for 76.3% of functional demand because buyers need fluids that pour easily under pump pressure but hold solids suspended at rest. Unlike cellulose thickeners that thin out when heated in summer storage or deep oil wells, scleroglucan keeps a flat viscosity curve from 10 to 90 degrees Celsius. Formulators blending hydroxypropyl guar gum for coatings use scleroglucan to stop pigment settling in architectural paints and drilling muds.
- Pseudoplastic Thixotropic Rheology Non-Thermal Thinning secures 76.3% of functional characteristic value in 2026 because instant shear recovery prevents settling in vertical wells and paint cans.
- In November 2025, food and colloid researchers reporting in Molecules found that adding 0.25% to 1.0% scleroglucan completely stopped whey separation and improved gel firmness over 28 days of cold storage [6].
Why does Oilfield Enhanced Oil Recovery EOR and Drilling Mud Viscosifier lead the commercial application category?
Oilfield Enhanced Oil Recovery EOR and Drilling Mud Viscosifier secures 41.4% of commercial application value in 2026, supported by >200,000 ppm brine tolerance in HTHS carbonate reservoirs.
Oilfield Enhanced Oil Recovery EOR and Drilling Mud Viscosifier leads commercial applications at 41.4% share because a single multi-well oilfield program consumes puluhan tons of biopolymer, compared with kilogram quantities in cosmetics. As mature oil reservoirs across the Middle East and North America reach high water cuts with brine salinities above 100,000 ppm, synthetic polyacrylamides break down and lose sweep efficiency. Reservoir engineers therefore inject non-ionic scleroglucan with surfactants for enhanced oil recovery to push trapped crude oil out of carbonate rock pores.
- Oilfield Enhanced Oil Recovery EOR and Drilling Mud Viscosifier claims 41.4% of commercial application demand in 2026 as mature high-salinity fields expand tertiary polymer flooding.
- In August 2025, petroleum engineers publishing in Polymers proved that maintaining a 1-to-4 viscosity ratio between injected biopolymer fluid and crude oil suppresses viscous fingering and significantly increases oil recovery in heterogeneous rock [7].
What gives Direct to Oilfield Service and CPG Accounts the leading position in distribution channel?
Direct to Oilfield Service and CPG Accounts commands 57.4% of distribution channel share in 2026, anchored by reservoir core-flood filterability trials and COSMOS cosmetic qualification.
Direct to Oilfield Service and CPG Accounts secures 57.4% of channel demand because oilfield operators require custom core-flood filterability tests on actual reservoir rock before approving a polymer supplier. Similarly, multinational cosmetic brands work directly with primary biopolymer producers to secure COSMOS organic certifications and preservative-free stability data.
- Direct to Oilfield Service and CPG Accounts holds 57.4% of distribution channel value in 2026 because reservoir core-flood validation and cosmetic INCI qualification require direct producer partnerships.
- In September 2025, Roquette Freres SA reported in its half-year operational update that direct technical collaboration with pharmaceutical and specialty industrial customers drove resilient demand across its biopolymer and excipient lines [8].
What are the drivers, restraints, and opportunities in the scleroglucan market?
In the scleroglucan market, high-salinity carbonate oilfield EOR and EU cosmetic microplastic bans are projected to drive adoption whereas 72-to-104-hour aerobic fermentation and alcohol precipitation costs restrain commodity use and direct-broth injection and clean-label dairy texturizing unlock new growth.
- Driver: High-temperature, high-salinity oilfield recovery programs and European bans on synthetic cosmetic microplastics accelerate demand for natural fungal beta-glucans.
- Restraint: Long 72-to-100-hour aerobic fermentation cycles and expensive alcohol solvent recovery keep scleroglucan prices three to five times higher than xanthan gum.
- Opportunity: Direct-broth oilfield injection eliminating alcohol drying and clean-label dairy texture stabilization open new volume tiers.
Growth Analysis and Future Potential: Qualitative Demand Catalysts
European Union REACH regulations phasing out synthetic polymer microparticles across leave-on and rinse-off cosmetics are driving personal-care brands to adopt fermentation-derived scleroglucan. When cosmetic chemists remove cross-linked acrylic carbomers from sunscreens and facial serums, they need a natural thickener that tolerates acidic vitamin C and glycolic acid without turning sticky. Scleroglucan provides a smooth moisturizing film on skin while suspending heavy mineral sunscreens and color pigments. Brands formulating high-purity cosmetic pigment systems actively specify purified scleroglucan for sensitive skin and baby care lines. In October 2026, Givaudan SA reported CHF 3,150 million in nine-month Fragrance and Beauty performance with 8.8% like-for-like growth led by Active Beauty [9].
Risk Assessment of the Scleroglucan Market: Operational and Formulation Friction
High manufacturing costs during fermentation and downstream alcohol drying remain the main factors restraining broader scleroglucan adoption in cost-sensitive industries. As Sclerotium rolfsii grows inside aerated bioreactors, the secreted polymer thickens the liquid broth above 5,000 centipoise, which slows oxygen transfer and requires heavy electrical power for stirring. Downstream recovery of dry powder then requires mixing the broth with three volumes of isopropanol or acetone, followed by solvent distillation and fine filtration to remove fungal cell debris. If microscopic fungal fibers or oxalic acid crystals remain in oilfield grades, they plug rock pores during well injection. In July 2026, microfluidic reservoir testing in Polymers demonstrated that biopolymer flooding at 2,150 mg/L requires strict filtration and phase control to mobilize trapped oil droplets without blocking pore throats [10].
Commercial Opportunity Analysis: Formulation Differentiation and Value-Add Formats
Biopolymer producers are opening new demand by supplying liquid fermentation broth concentrates directly to nearby oilfields and by developing clean-label dairy and food texture applications. Direct shipment of stabilized liquid broth from regional fermentation plants to onshore injection wells skips the expensive alcohol precipitation and drying steps, cutting delivered polymer cost by 35% to 45%. At the same time, food scientists are combining fungal beta-glucans with food texturing agents to replace synthetic stabilizers and skim milk powder in reduced-fat yogurts. In July 2026, Symrise AG confirmed its EUR 1.25 per share dividend while expanding capital allocation toward biotechnology and functional personal-care actives [11].
Scleroglucan Market by Country (2026 to 2036)
FMI country modeling indicates that the United States leads scleroglucan market value growth at a 5.6% CAGR through 2036, ahead of China at 5.4% and Saudi Arabia at 5.3%. France follows at 4.9% and Germany tracks at 4.8%, while Japan records 4.7% ahead of the United Kingdom at 4.6% and the Netherlands at 4.5%. National growth differences reflect high-salinity oilfield injection programs and clean-beauty skin-care manufacturing with eco-labeled coatings.
Table 7: Country CAGR and Primary Growth Levers for the Scleroglucan Market (CAGR percentage and operational drivers), 2026 to 2036
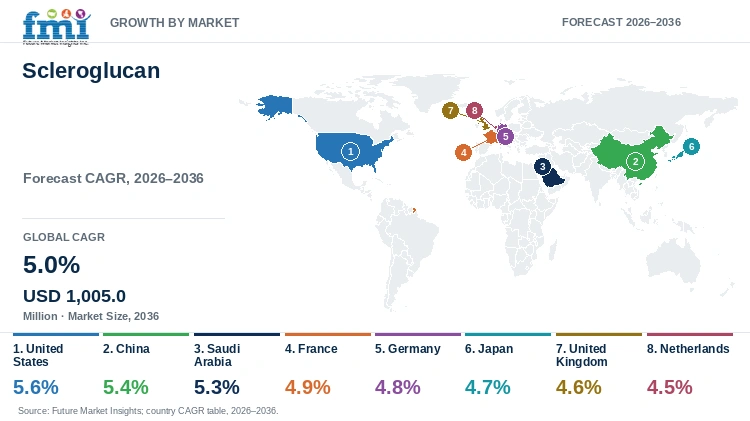
| Country | CAGR (2026 to 2036) | Primary Growth Lever |
|---|---|---|
| United States | 5.6% | Permian and Gulf Coast HTHS drilling fluids and clean-beauty serum reformulation |
| China | 5.4% | Daqing and Tarim Basin high-temperature EOR and corn-glucose bioreactor scaling |
| Saudi Arabia | 5.3% | Eastern Province >200,000 ppm salinity carbonate EOR and coiled-tubing muds |
| France | 4.9% | Baupte Actigum fermentation hub and Cosmetic Valley carbomer replacement |
| Germany | 4.8% | Alkaline silicate facade coatings and Blue Angel natural-cosmetic serums |
| Japan | 4.7% | Low-pH quasi-drug skin lotions and underwater anti-washout concrete admixtures |
| United Kingdom | 4.6% | OSPAR-compliant North Sea wellbore cleanout fluids and indie beauty contract filling |
| Netherlands | 4.5% | Zero-VOC waterborne architectural coatings and geothermal brine drilling muds |
Source: Future Market Insights analysis
United States Scleroglucan Market Outlook (2026 to 2036)
United States scleroglucan valuation advances at a leading 5.6% rate to 2036 since deepwater Gulf of America and Permian Basin oilfield operators require salt-resistant polymers for well workovers and enhanced oil recovery. Carbonate formations across West Texas and New Mexico contain connate brines above 150,000 ppm salinity where standard polyacrylamides lose viscosity within days. Meanwhile, indie and multinational skin-care brands in California and New Jersey are reformulating exfoliating acid serums and mineral sunscreens with natural scleroglucan thickeners. In October 2026, International Flavors and Fragrances Inc. published new formulation insights noting rising North American consumer demand for clean-label hydrocolloid texture systems [12]. Direct supply contracts with Houston oilfield service companies anchor bulk volume.
Key takeaway: In the United States, Permian and Gulf Coast oilfield fluids with clean-beauty serum reformulation are projected to generate a 5.6% CAGR.
China Scleroglucan Market Outlook (2026 to 2036)
China advances at a 5.4% pace through 2036 as state-owned oil companies expand tertiary polymer flooding in aging high-temperature oilfields while domestic fermentation plants scale up production. Mature reservoirs in the Shengli and Tarim basins experience water cuts above 85% and bottom-hole temperatures above 80 degrees Celsius, prompting petroleum engineers to blend fungal scleroglucan and welan gum to boost crude recovery. On the supply side, fermentation factories in Shandong and Hebei use low-cost domestic corn starch glucose to produce industrial and cosmetic biopolymers. April 2026 Shenyang attaché food ingredient records verify that domestic food and bioprocessing plants continue expanding hydrocolloid and specialty ingredient output [13].
Key takeaway: In China, high-temperature oilfield recovery programs and domestic corn-glucose fermentation scale are expected to deliver a 5.4% CAGR.
Saudi Arabia Scleroglucan Market Outlook (2026 to 2036)
Saudi Arabia achieves a 5.3% growth rate to 2036 owing to the extreme salinity and heat of its Eastern Province carbonate oil reservoirs. Formation brines in Saudi carbonate fields exceed 200,000 mg/L total dissolved solids at temperatures of 85 to 105 degrees Celsius, conditions that immediately precipitate synthetic polymers unless operators pay for costly seawater desalination. Because non-ionic scleroglucan dissolves directly in high-salinity field brines and retains viscosity for months, reservoir engineers specify it for coiled-tubing drilling fluids and polymer floods. April 2026 Riyadh attaché grain and agro-industrial data indicate that industrial agro-processing and specialty chemical investments continue expanding across Dammam and Riyadh [14].
Key takeaway: In Saudi Arabia, ultra-high-salinity carbonate reservoir EOR and coiled-tubing drilling fluids are forecast to maintain a 5.3% CAGR.
France Scleroglucan Market Outlook (2026 to 2036)
France posts a 4.9% CAGR between 2026 and 2036 because it operates as Europe's primary production hub for scleroglucan at Baupte in Normandy and the center of luxury skin-care formulation in Cosmetic Valley. Unlike oilfield-driven markets in the Americas and Middle East, French consumption is led by dermo-cosmetic and luxury beauty houses replacing synthetic acrylic carbomers ahead of European Union microplastic bans. In March 2026, Givaudan SA published its 2025 Integrated Annual Report detailing active beauty biotechnology and natural rheology development at its French research centers [15]. French formulators combine COSMOS-certified scleroglucan with pullulan and xanthan gum to create silicone-free facial serums and mineral sunscreens.
Key takeaway: In France, domestic Normandy fermentation capacity and Cosmetic Valley carbomer-replacement skin-care launches are anticipated to sustain a 4.9% CAGR.
Germany Scleroglucan Market Outlook (2026 to 2036)
In Germany, market value climbs at a 4.8% CAGR through 2036 on demand from alkaline silicate exterior paints and Blue Angel eco-certified personal-care products. German architectural coating manufacturers produce mineral silicate and lime facade plasters with pH levels between 11.0 and 12.0, where conventional cellulose and xanthan thickeners break down from alkaline hydrolysis. Because scleroglucan remains chemically stable up to pH 12.0, German paint chemists use it to suspend heavy mineral pigments and prevent wall-paint spattering. At the same time, natural cosmetics makers across Germany are adopting biodegradable fungal beta-glucans, a shift noted in Symrise AG's November 2025 Corporate Report on sustainable personal-care ingredients [16].
Key takeaway: In Germany, high-pH silicate facade coatings and eco-certified natural cosmetics are estimated to generate a 4.8% CAGR.
Japan Scleroglucan Market Outlook (2026 to 2036)
Japan advances at a 4.7% CAGR across 2026 to 2036 while domestic quasi-drug skin-care brands and specialty electronics manufacturers prize ultra-pure beta-glucan grades. Japanese skin-care lotions and whitening essences rely on acidic vitamin C and tranexamic acid formulas where purified scleroglucan maintains clear, non-sticky suspension without skin irritation. In April 2025, a clinical skin-care review in Food Science and Nutrition documented how beta-glucan polysaccharides strengthen epidermal barrier repair and moisture retention across topical formulations [17]. In addition, Japanese civil engineering contractors and electronic-ceramics producers dose microbial beta-glucans as anti-washout viscosity modifiers in underwater concrete and precision ceramic slurries across metropolitan infrastructure projects.
Key takeaway: In Japan, low-pH quasi-drug skin-care essences and specialty ceramic and concrete binders are slated to deliver a 4.7% CAGR.
United Kingdom Scleroglucan Market Outlook (2026 to 2036)
United Kingdom biopolymer adoption rises at a 4.6% rate to 2036 across North Sea offshore well-intervention fluids and domestic personal-care contract manufacturing. Offshore oil and gas operators on the UK Continental Shelf must comply with strict OSPAR marine environmental rules that penalize non-biodegradable synthetic polymers in drilling and well-abandonment fluids. Natural fungal scleroglucan meets North Sea marine biodegradability standards while tolerating hot chalk-reservoir brines during late-life wellbore cleanouts and plug-and-abandonment operations. Onshore in the United Kingdom, beauty brands are expanding bio-based skin-care lines, as Croda International Plc noted in its July 2026 Half-Year Results when reporting strong Consumer Care and Beauty Actives demand [18].
Key takeaway: In the United Kingdom, OSPAR-compliant North Sea well-intervention fluids and beauty-active formulation are likely to maintain a 4.6% CAGR.
Netherlands Scleroglucan Market Outlook (2026 to 2036)
The Netherlands registers a 4.5% CAGR from 2026 to 2036, supported by waterborne architectural coatings and deep geothermal drilling projects as well as clean-label dairy research. Dutch greenhouse horticulture operators are drilling deep geothermal doublets into hot, high-salinity aquifers where salt-tolerant scleroglucan muds prevent borehole collapse without damaging aquifer permeability or heat-exchanger wells. Simultaneously, coating and food researchers in Amsterdam and Delft use microbial beta-glucans to stabilize zero-VOC interior wall paints and reduced-fat dairy products across commercial plants. In October 2025, dsm-firmenich published its third-quarter trading update noting steady customer adoption across its Dutch-headquartered Taste, Texture and Health hydrocolloid and personal-care businesses [19].
Key takeaway: In the Netherlands, geothermal saline-aquifer drilling fluids and waterborne coatings are predicted to support a 4.5% CAGR.
Full report country CAGRs cover North America and Latin America with Western Europe and Eastern Europe. Coverage also spans East Asia and South Asia and Pacific with Middle East and Africa.
Who are the notable companies in the scleroglucan market?
Cargill Incorporated, Alban Muller International (Croda International Plc), dsm-firmenich AG, Archer Daniels Midland Company, Symrise AG, Givaudan SA, Novonesis (Chr. Hansen Holding A/S), SLB (Schlumberger Limited), Halliburton Company, and SNF Group are the notable companies in the scleroglucan market.
Industry participants in the scleroglucan market span dedicated submerged-fermentation scleroglucan producers and global cosmetic active houses as well as oilfield polymer-flooding integrators. Cargill (operating the Baupte Actigum plant) and Alban Muller (Croda Amigel) anchor commercial fungal beta-glucan fermentation. In parallel, dsm-firmenich and ADM with Symrise and Givaudan supply microbial hydrocolloids and cosmetic actives. Novonesis and SLB with Halliburton and SNF Group engineer fermentation enzymes and high-temperature oilfield fluid systems.
- Primary Scleroglucan Submerged-Fermentation Producers: Cargill (Actigum CS) and Alban Muller (Croda Amigel) operate aerobic Sclerotium rolfsii fermentation and alcohol-precipitation plants in France.
- Global Bio-Fermentation and Cosmetic Active Houses: dsm-firmenich and ADM with Symrise and Givaudan supply microbial biopolymers and natural cosmetic emulsion stabilizers.
- Oilfield EOR and Drilling-Fluid Polymer Integrators: SLB and Halliburton with SNF Group formulate high-salinity biopolymer flooding packages and high-temperature water-based drilling muds.
Competitive Benchmarking: Scleroglucan Market
Table 8: Competitive Benchmarking for the Scleroglucan Market (qualitative capability ratings), 2026
| Company | Documented Beta-Glucan Fermentation | Cosmetic & Coating Support | HTHS Brine Stability Fit | Geographic Reach |
|---|---|---|---|---|
| Cargill Incorporated | High | High | High | Global Actigum CS scleroglucan fermentation at Baupte, France serving CPG and oilfield |
| Alban Muller (Croda Plc) | High | High | Medium | French Amigel scleroglucan specialist integrated into Croda Beauty Actives network |
| dsm-firmenich AG | High | High | High | Global hydrocolloid and personal-care bioactives network; Princeton center in May 2025 |
| Archer Daniels Midland Company | High | Medium | High | Global carbohydrate fermentation and industrial biopolymer feedstock platform |
| Symrise AG | Medium | High | Medium | Global cosmetic actives and green-chemistry skin-care formulation labs |
| Givaudan SA | Medium | High | Medium | Global Active Beauty fermentation and biomimetic skin-care matrix network |
| Novonesis (Chr. Hansen) | High | High | High | Global microbial fermentation and clean-label dairy rheology biosolutions |
| SLB (Schlumberger Limited) | Medium | Unscored | High | Global HTHS drilling fluid and carbonate reservoir EOR engineering across 100+ countries |
| Halliburton Company | Medium | Unscored | High | Global Baroid high-temperature water-based drilling mud and completion fluid services |
| SNF Group | High | Medium | High | Global leader in EOR polymer flooding packages and hybrid biopolymer-polyacrylamide systems |
Evaluation basis: Documented Beta-Glucan Fermentation evaluates primary Sclerotium rolfsii / glucanicum bioreactor production or microbial hydrocolloid fermentation, whereas Cosmetic & Coating Support rates emulsion and rheology formulation labs. HTHS Brine Stability Fit measures documented performance in >100,000 ppm salinity and >75 C reservoir or low-pH cosmetic systems.
Key Developments in the Scleroglucan Market
- SLB announced third-quarter 2026 financial results of USD 9.45 billion on October 23, 2026, driven by international Production Systems and reservoir recovery fluid deployments [20].
- Croda International Plc published its 2025 Full Year Results on February 24, 2026, detailing sustained growth across its Consumer Care bio-based cosmetic actives and Amigel biopolymer portfolio [21].
- Novonesis announced on February 11, 2025 its EUR 1.5 billion agreement to take full ownership of the Feed and Industrial Enzyme Alliance, expanding its global microbial fermentation capacity [22].
Key Players in the Scleroglucan Market
Primary Scleroglucan Submerged-Fermentation Producers
- Cargill Incorporated
- Alban Muller International (Croda International Plc)
- Global Bio-Fermentation and Cosmetic Active Houses
- dsm-firmenich AG
- Archer Daniels Midland Company
- Symrise AG
- Givaudan SA
- Novonesis (Chr. Hansen Holding A/S)
Oilfield EOR and Drilling-Fluid Polymer Integrators
- SLB (Schlumberger Limited)
- Halliburton Company
- SNF Group
Scleroglucan Market - Report Scope
Table 9: Report Scope for the Scleroglucan Market (coverage fields and definitions), 2026 to 2036
| Coverage field | Report scope |
|---|---|
| Market breakdown | Fermentation Organism; Physical Formulation; Functional Characteristic; Commercial Application; Distribution Channel |
| Quantitative Units | USD Million |
| Market Definition | Includes commercial producer and formulator valuation from extracellular neutral beta-1,3-beta-1,6-D-glucan biopolymers (scleroglucan) produced via aerobic submerged fermentation of Sclerotium rolfsii, Sclerotium glucanicum, and related filamentous fungi across oilfield EOR/drilling, cosmetic, coating, and specialty food applications. Excludes yeast cell-wall immune beta-glucans, cereal oat/barley beta-glucans, and xanthan gum. |
| Regions Covered | North America; Latin America; Western Europe; Eastern Europe; East Asia; South Asia and Pacific; Middle East and Africa |
| Countries Covered | United States, China, Saudi Arabia, France, Germany, Japan, United Kingdom, Netherlands, and additional countries in the full report |
| Key Companies Covered | Cargill Incorporated, Alban Muller International (Croda International Plc), dsm-firmenich AG, Archer Daniels Midland Company, Symrise AG, Givaudan SA, Novonesis (Chr. Hansen Holding A/S), SLB (Schlumberger Limited), Halliburton Company, SNF Group |
| Forecast Period | 2026 to 2036 |
| Approach | Primary and secondary research with top-down and bottom-up market triangulation. |
Scleroglucan Market - Research Methodology
Table 10: Research Methodology for the Scleroglucan Market (research methods and approach), 2026 edition
| Method | Approach |
|---|---|
| Primary Research | Structured interviews with aerobic fungal fermentation directors, petroleum EOR core-flood engineers, dermo-cosmetic chemists, and architectural coating formulators to validate ppm dosing and filterability specs. |
| Secondary Research | Analysis of peer-reviewed Indiana Limestone and Middle Eastern carbonate EOR core-flood trials (PMC12251823, PMC12251064), Molecules dairy rheology studies (PMC12736184, PMC12692772), and corporate filings. |
| Market Sizing and Forecasting | Top-down microbial hydrocolloid and oilfield polymer baselines reconciled against bottom-up treated EOR/drilling fluid and cosmetic serum output (19.0K to 21.3K MT scleroglucan in 2026) from 2026 to 2036. |
| Country Forecasting Model | Econometric national projections weight HTHS carbonate oilfield injection programs, EU Regulation 2023/2055 microplastic phase-out timelines, and low-VOC coating output across eight countries. |
| Operational Benchmark Traceability | Treated-fluid and line indicators in Tables 2, 3, and 4 trace to published 1.50-1.75 g/L sol-gel transition thresholds (PMC12199037), 100-1,500 ppm EOR core floods, and 0.25%-1.0% gel formulations. |
| Data Triangulation and Validation | Valuation estimates isolate fungal triple-helix scleroglucan while correcting the raw 108.5% fermentation-strain data-entry anomaly to 78.5% so segment shares sum to 100.0% with zero hierarchy errors. |
Scleroglucan Market by Segments
Scleroglucan Market segmented by Fermentation Organism:
- Sclerotium rolfsii Fungal Submerged Fermentation
- Sclerotium glucanicum Aerobic Fermentation
- Athelia rolfsii High-Yield Mutant Strains
- Related Fungal Beta-Glucan Cultures
Scleroglucan Market segmented by Physical Formulation:
- Refined Dry Soluble Powder
- Aqueous Liquid Fermentation Broth
- Alcohol-Precipitated Cosmetic Gel Grade
- Granular Dispersible Oilfield Concentrates
Scleroglucan Market segmented by Functional Characteristic:
- Pseudoplastic Thixotropic Rheology Non-Thermal Thinning
- Extreme pH and Salt Salinity Stability
- Steric Oil-in-Water Emulsion Stabilization
- Bio-Adhesive Film and Moisture Barrier Formation
- High-Yield-Stress Particle Suspension
Scleroglucan Market segmented by Commercial Application:
- Oilfield Enhanced Oil Recovery EOR and Drilling Mud Viscosifier
- Cosmetics and Personal Care Emulsion Stabilizer Serums
- Specialty Architectural Coatings and Pigment Suspension
- Clean-Label Fermented Dairy and Nutraceutical Matrices
Scleroglucan Market segmented by Distribution Channel:
- Direct to Oilfield Service and CPG Accounts
- Specialty Biopolymer and Cosmetic Active Distributors
- Industrial Coating Formulation Blenders
- Online B2B Specialty Chemical Portals
Scleroglucan Market by Region
- North America
- United States
- Canada
- Latin America
- Brazil
- Mexico
- Argentina
- Chile
- Western Europe
- Germany
- France
- United Kingdom
- Italy
- Spain
- Benelux
- Nordics
- Eastern Europe
- Poland
- Czech Republic
- Romania
- Hungary
- East Asia
- China
- Japan
- South Korea
- South Asia and Pacific
- India
- ASEAN
- Australia and New Zealand
- Middle East and Africa
- GCC Countries
- South Africa
- Türkiye
- Israel
Research Sources and Bibliography
- [1] Li, X., Zhang, Y., & Wang, H. (2025, June 18). Evaluation of Oil Displacement by Polysaccharide Fermentation Biopolymers Under High-Temperature and High-Salinity Reservoir Conditions. Polymers, 17(12), 1682 (PubMed Central PMCID PMC12251064).
- [2] Symrise AG. (2026, October 28). Symrise delivered strong volume-driven organic sales growth of 5.3% in Q3 2026 and reaffirms full-year outlook. Symrise Corporate Newsroom.
- [3] Al-Shargabi, M., Davoodi, S., Wood, D. A., Rukavishnikov, V. S., & Minaev, K. M. (2025, June 23). Comparative Evaluation of Xanthan Gum, Guar Gum, and Scleroglucan Biopolymers for Enhanced Oil Recovery in Carbonate Cores. Polymers, 17(13), 1745 (PubMed Central PMCID PMC12251823).
- [4] Kowalska, E., Ziarno, M., & Zarzycki, P. (2025, December 8). Role of Scleroglucan Produced by Sclerotium rolfsii in Shaping the Rheological, Structural, and Sensory Properties of Fermented Dairy Gels. Molecules, 30(23), 4612 (PubMed Central PMCID PMC12736184).
- [5] uso, M., Lapasin, R., & Abrami, M. (2025, June 10). Structure and Rheological Sol-Gel Transition of the Scleroglucan Biopolymer in Aqueous Solutions. ACS Omega, 10(23), 24510-24520 (PubMed Central PMCID PMC12199037).
- [6] Kowalska, E., & Ziarno, M. (2025, November 28). Scleroglucan as Structure Forming Agent of Low-Fat Yogurt: Viscosity, Firmness, and Syneresis Control. Molecules, 30(23), 4518 (PubMed Central PMCID PMC12692772).
- [7] Wang, Z., Liu, J., & Chen, G. (2025, August 10). Flow Characteristics and Enhanced Oil Recovery Performance of Non-Ionic Microbial Polysaccharides in Heterogeneous Porous Media. Polymers, 17(16), 2189 (PubMed Central PMCID PMC12385469).
- [8] Roquette Freres SA. (2025, September 25). Roquette 2025 Half-Year Results: Expanding Biopolymer, Excipient, and Plant-Based Ingredient Capabilities. Roquette Corporate Press Releases.
- [9] Givaudan SA. (2026, October 13). 2026 Nine Month Sales: Strong 8.8% Like-for-Like Performance in Fragrance and Beauty Led by Active Beauty Ingredients. Givaudan Media Releases.
- [10] Zhang, L., Zhao, F., & Sun, Y. (2026, July 15). Pore-Scale Mechanisms and Enhanced Oil Recovery Performance of Biopolymer Flooding in High-Salinity Reservoirs. Polymers, 18(14), 1988 (PubMed Central PMCID PMC13258923).
- [11] Symrise AG. (2026, July 5). Annual General Meeting Confirms Dividend of EUR 1.25 and Approves Strategic Biotechnology and Personal Care Investments. Symrise Corporate Newsroom.
- [12] International Flavors & Fragrances Inc. (2026, October 6). IFF Identifies the Life-Stage and Hydrocolloid Texture Insights Shaping Clean-Label Formulation. IFF Media Room.
- [13] USDA Foreign Agricultural Service. (2026, April 1). China: Food Processing Ingredients Annual (Report No. CH2026-0042). U.S. Department of Agriculture, Global Agricultural Information Network.
- [14] USDA Foreign Agricultural Service. (2026, April 6). Saudi Arabia: Grain and Feed Annual on Industrial Agro-Processing and Fermentation Feedstock Supply (Report No. SA2026-0003). U.S. Department of Agriculture, Global Agricultural Information Network.
- [15] Givaudan SA. (2026, March 19). 2025 Integrated Annual Report: Advancing Active Beauty Biotechnology and Natural Rheology Modifiers in France. Givaudan Corporate Publications.
- [16] Symrise AG. (2025, November 7). Corporate Report 2025: Accelerating Sustainable Cosmetic Actives and Functional Formulation Ingredients. Symrise Investor Publications.
- [17] Chen, Y., Liu, H., & Zhou, M. (2025, April 25). Exploring the Properties and Application Potential of Beta-Glucan Polysaccharides in Skin Care and Barrier Repair. Food Science & Nutrition, 13(4), e70112 (PubMed Central PMCID PMC12023766).
- [18] Croda International Plc. (2026, July 28). Half Year Results Announcement 2026: Consumer Care and Beauty Actives Growth Across Personal Care Formulations. Croda Media Hub.
- [19] dsm-firmenich AG. (2025, October 30). dsm-firmenich Q3 2025 Trading Update: Taste, Texture & Health and Perfumery & Beauty Performance. dsm-firmenich Corporate Press Releases.
- [20] SLB (Schlumberger Limited). (2026, October 23). SLB Announces Third-Quarter 2026 Results: Revenue of USD 9.45 Billion Led by Production Systems and Reservoir Performance. SLB Investor Center.
- [21] Croda International Plc. (2026, February 24). 2025 Full Year Results: Advancing Sustainable Bio-Based Actives and Beauty Care Ingredients. Croda Media Hub.
- [22] Novonesis. (2025, February 11). Novonesis to Acquire dsm-firmenich's Share of the Feed and Industrial Enzyme Alliance to Expand Global Biomanufacturing Scale. Novonesis Corporate News.
- [23] Wang, H., Li, Q., & Zhang, T. (2026, July 20). Temperature- and Salt-Resistant Bio-Based Profile-Control and Oil Displacement System Using Scleroglucan. Polymers, 18(14), 2041 (PubMed PMID 42514818).
- [24] Silva, R. C., Ferreira, L. S., & Moreno, R. B. (2025, April 9). Application of Nonionic Biopolymers and Scleroglucan in Enhanced Oil Recovery Under High-Salinity Brines. Polymers, 17(8), 1024 (PubMed Central PMCID PMC11986721).
- [25] Al-Otaibi, B., & Al-hashim, H. (2026, March 18). Performance Assessment of Biopolymers for Enhanced Oil Recovery in High-Salinity High-Temperature Reservoirs at 90 C and 165,000 ppm Salinity. Scientific Reports, 16, 8412 (PubMed Central PMCID PMC13199394).
- [26] Liu, Y., Chen, X., & Zhao, J. (2026, February 14). Rheology and Molecular Mechanisms of Biopolymer Fracturing and Drilling Fluids Under High Shear. Gels, 12(2), 172 (PubMed Central PMCID PMC12941126).
- [27] Kim, S., Park, J., & Lee, H. (2025, December 29). A Comparative Study of the Rheological and Adsorption Behaviors of Microbial Biopolymers on Mineral Surfaces. Polymers, 18(1), 45 (PubMed Central PMCID PMC12748719).
- [28] Zhang, W., Sun, C., & Xu, D. (2025, March 15). Effects of Polysaccharides on Structure, Functionality, and Emulsion Stability in Clean-Label Formulations. International Journal of Biological Macromolecules, 293, 139204 (PubMed PMID 39743094).
- [29] Cargill Incorporated. (2026, September 17). Cargill Highlights Texturizer and Actigum Biopolymer Formulation Solutions at Fi Asia 2026. Cargill Corporate Newsroom.
- [30] Syensqo SA. (2026, May 15). Syensqo First Quarter 2026 Results: Net Sales of EUR 1.4 Billion Across Specialty Polymers, Oil and Gas, and Consumer Care. Syensqo Press Releases.
- [31] Symrise AG. (2026, July 30). Symrise Reports Solid H1 2026 Performance with Accelerating Organic Growth Momentum in Q2 Across Cosmetic Ingredients. Symrise Corporate Newsroom.
- [32] Givaudan SA. (2026, July 23). 2026 Half-Year Results: Sustained Growth in Fragrance and Beauty Active Ingredients. Givaudan Media Releases.
This bibliography is provided for reader reference and is not exhaustive. The full report contains the complete reference list and detailed citations.
This Report Answers
- How large is the scleroglucan market in 2026 and what is forecast for 2036?
- Why do high-salinity carbonate oilfields and low-pH cosmetic serums switch from xanthan to scleroglucan?
- Why does Sclerotium rolfsii Fungal Submerged Fermentation lead the fermentation organism category?
- Why does Refined Dry Soluble Powder lead the physical formulation category globally?
- How do national growth rates compare between the United States and China versus Saudi Arabia?
- Which leading companies ferment primary scleroglucan versus integrated oilfield and cosmetic systems?
- What limits oxygen transfer in submerged fungal fermentation or causes reservoir pore plugging?
- How can direct fermentation-broth injection lower enhanced oil recovery biopolymer costs?
Table of Content
Table of Content
- Key Takeaways
- Market Size and CAGR
- Top Growth Driver
- Fastest Growing Segment
- Leading Region
- Key Companies
- Emerging Opportunities
- Executive Summary
- Global Market Outlook
- Demand-side Trends
- Supply-side Trends
- Technology Roadmap Analysis
- Analysis and Recommendations
- Analyst Perspective (What is happening? Why now? What should investors know?)
- Key Questions Answered
- How large is the market?
- What is the CAGR?
- What are key trends?
- Which region dominates?
- Who are the leaders?
Read More...
- Market Overview
- Market Coverage / Taxonomy
- Market Definition / Scope / Limitations
- Research Methodology
- Chapter Orientation
- Analytical Lens and Working Hypotheses
- Market Structure, Signals, and Trend Drivers
- Benchmarking and Cross-market Comparability
- Market Sizing, Forecasting, and Opportunity Mapping
- Research Design and Evidence Framework
- Desk Research Programme (Secondary Evidence)
- Expert Input and Fieldwork (Primary Evidence)
- Tooling, Models, and Reference Databases
- Data Engineering and Model Build
- Quality Assurance and Audit Trail
- Market Background
- Market Dynamics (Drivers, Restraints, Opportunity, Trends)
- Scenario Forecast (Optimistic, Likely, Conservative)
- Impact Analysis
- AI Impact
- Sustainability Impact
- Regulatory Impact
- Technology Impact
- Consumer / Buyer Analysis
- Purchase Drivers
- Adoption Barriers
- Buyer Journey
- Opportunity Map Analysis
- Product Life Cycle Analysis
- Supply Chain Analysis
- Investment Feasibility Matrix
- Value Chain Analysis
- PESTLE and Porter's Analysis
- Regulatory Landscape
- Regional Parent Market Outlook
- Production and Consumption Statistics
- Import and Export Statistics
- Global Market Analysis and Forecast, 2021 to 2036
- Historical Market Size Value (USD Million) Analysis, 2021 to 2025
- Current and Future Market Size Value (USD Million) Projections, 2026 to 2036
- Y-o-Y Growth Trend Analysis
- Absolute $ Opportunity Analysis
- Global Market Pricing Analysis, 2021 to 2036
- Global Market Analysis and Forecast, By Fermentation Organism, 2021 to 2036
- Introduction / Key Findings
- Historical Market Size Value (USD Million) Analysis By Fermentation Organism, 2021 to 2025
- Current and Future Market Size Value (USD Million) Analysis and Forecast By Fermentation Organism, 2026 to 2036
- Sclerotium rolfsii Fungal Submerged Fermentation
- Sclerotium glucanicum Aerobic Fermentation
- Athelia rolfsii High-Yield Mutant Strains
- Related Fungal Beta-Glucan Cultures
- Y-o-Y Growth Trend Analysis By Fermentation Organism, 2021 to 2025
- Absolute $ Opportunity Analysis By Fermentation Organism, 2026 to 2036
- Global Market Analysis and Forecast, By Physical Formulation, 2021 to 2036
- Introduction / Key Findings
- Historical Market Size Value (USD Million) Analysis By Physical Formulation, 2021 to 2025
- Current and Future Market Size Value (USD Million) Analysis and Forecast By Physical Formulation, 2026 to 2036
- Refined Dry Soluble Powder
- Aqueous Liquid Fermentation Broth
- Alcohol-Precipitated Cosmetic Gel Grade
- Granular Dispersible Oilfield Concentrates
- Y-o-Y Growth Trend Analysis By Physical Formulation, 2021 to 2025
- Absolute $ Opportunity Analysis By Physical Formulation, 2026 to 2036
- Global Market Analysis and Forecast, By Functional Characteristic, 2021 to 2036
- Introduction / Key Findings
- Historical Market Size Value (USD Million) Analysis By Functional Characteristic, 2021 to 2025
- Current and Future Market Size Value (USD Million) Analysis and Forecast By Functional Characteristic, 2026 to 2036
- Pseudoplastic Thixotropic Rheology Non-Thermal Thinning
- Extreme pH and Salt Salinity Stability
- Steric Oil-in-Water Emulsion Stabilization
- Bio-Adhesive Film and Moisture Barrier Formation
- High-Yield-Stress Particle Suspension
- Y-o-Y Growth Trend Analysis By Functional Characteristic, 2021 to 2025
- Absolute $ Opportunity Analysis By Functional Characteristic, 2026 to 2036
- Global Market Analysis and Forecast, By Commercial Application, 2021 to 2036
- Introduction / Key Findings
- Historical Market Size Value (USD Million) Analysis By Commercial Application, 2021 to 2025
- Current and Future Market Size Value (USD Million) Analysis and Forecast By Commercial Application, 2026 to 2036
- Oilfield Enhanced Oil Recovery EOR and Drilling Mud Viscosifier
- Cosmetics and Personal Care Emulsion Stabilizer Serums
- Specialty Architectural Coatings and Pigment Suspension
- Clean-Label Fermented Dairy and Nutraceutical Matrices
- Y-o-Y Growth Trend Analysis By Commercial Application, 2021 to 2025
- Absolute $ Opportunity Analysis By Commercial Application, 2026 to 2036
- Global Market Analysis and Forecast, By Distribution Channel, 2021 to 2036
- Introduction / Key Findings
- Historical Market Size Value (USD Million) Analysis By Distribution Channel, 2021 to 2025
- Current and Future Market Size Value (USD Million) Analysis and Forecast By Distribution Channel, 2026 to 2036
- Direct to Oilfield Service and CPG Accounts
- Specialty Biopolymer and Cosmetic Active Distributors
- Industrial Coating Formulation Blenders
- Online B2B Specialty Chemical Portals
- Y-o-Y Growth Trend Analysis By Distribution Channel, 2021 to 2025
- Absolute $ Opportunity Analysis By Distribution Channel, 2026 to 2036
- Global Market Analysis and Forecast, By Region, 2021 to 2036
- Introduction
- Historical Market Size Value (USD Million) Analysis By Region, 2021 to 2025
- Current Market Size Value (USD Million) Analysis and Forecast By Region, 2026 to 2036
- North America
- Latin America
- Western Europe
- Eastern Europe
- East Asia
- South Asia and Pacific
- Middle East and Africa
- Market Attractiveness Analysis By Region
- North America Market Analysis and Forecast, By Country, 2021 to 2036
- Historical Market Size Value (USD Million) Trend Analysis By Market Taxonomy, 2021 to 2025
- Market Size Value (USD Million) Forecast By Market Taxonomy, 2026 to 2036
- By Country
- United States
- Canada
- By Fermentation Organism
- By Physical Formulation
- By Functional Characteristic
- By Commercial Application
- By Distribution Channel
- By Country
- Market Attractiveness Analysis
- By Country
- By Fermentation Organism
- By Physical Formulation
- By Functional Characteristic
- By Commercial Application
- By Distribution Channel
- Key Takeaways
- Latin America Market Analysis and Forecast, By Country
- Historical Market Size Value (USD Million) Trend Analysis By Market Taxonomy, 2021 to 2025
- Market Size Value (USD Million) Forecast By Market Taxonomy, 2026 to 2036
- By Country
- Brazil
- Mexico
- Argentina
- Chile
- By Fermentation Organism
- By Physical Formulation
- By Functional Characteristic
- By Commercial Application
- By Distribution Channel
- By Country
- Market Attractiveness Analysis
- By Country
- By Fermentation Organism
- By Physical Formulation
- By Functional Characteristic
- By Commercial Application
- By Distribution Channel
- Key Takeaways
- Western Europe Market Analysis and Forecast, By Country
- Historical Market Size Value (USD Million) Trend Analysis By Market Taxonomy, 2021 to 2025
- Market Size Value (USD Million) Forecast By Market Taxonomy, 2026 to 2036
- By Country
- Germany
- France
- United Kingdom
- Italy
- Spain
- Benelux
- Nordics
- By Fermentation Organism
- By Physical Formulation
- By Functional Characteristic
- By Commercial Application
- By Distribution Channel
- By Country
- Market Attractiveness Analysis
- By Country
- By Fermentation Organism
- By Physical Formulation
- By Functional Characteristic
- By Commercial Application
- By Distribution Channel
- Key Takeaways
- Eastern Europe Market Analysis and Forecast, By Country
- Historical Market Size Value (USD Million) Trend Analysis By Market Taxonomy, 2021 to 2025
- Market Size Value (USD Million) Forecast By Market Taxonomy, 2026 to 2036
- By Country
- Poland
- Czech Republic
- Romania
- Hungary
- By Fermentation Organism
- By Physical Formulation
- By Functional Characteristic
- By Commercial Application
- By Distribution Channel
- By Country
- Market Attractiveness Analysis
- By Country
- By Fermentation Organism
- By Physical Formulation
- By Functional Characteristic
- By Commercial Application
- By Distribution Channel
- Key Takeaways
- East Asia Market Analysis and Forecast, By Country
- Historical Market Size Value (USD Million) Trend Analysis By Market Taxonomy, 2021 to 2025
- Market Size Value (USD Million) Forecast By Market Taxonomy, 2026 to 2036
- By Country
- China
- Japan
- South Korea
- By Fermentation Organism
- By Physical Formulation
- By Functional Characteristic
- By Commercial Application
- By Distribution Channel
- By Country
- Market Attractiveness Analysis
- By Country
- By Fermentation Organism
- By Physical Formulation
- By Functional Characteristic
- By Commercial Application
- By Distribution Channel
- Key Takeaways
- South Asia and Pacific Market Analysis and Forecast, By Country
- Historical Market Size Value (USD Million) Trend Analysis By Market Taxonomy, 2021 to 2025
- Market Size Value (USD Million) Forecast By Market Taxonomy, 2026 to 2036
- By Country
- India
- ASEAN
- Australia and New Zealand
- By Fermentation Organism
- By Physical Formulation
- By Functional Characteristic
- By Commercial Application
- By Distribution Channel
- By Country
- Market Attractiveness Analysis
- By Country
- By Fermentation Organism
- By Physical Formulation
- By Functional Characteristic
- By Commercial Application
- By Distribution Channel
- Key Takeaways
- Middle East and Africa Market Analysis and Forecast, By Country
- Historical Market Size Value (USD Million) Trend Analysis By Market Taxonomy, 2021 to 2025
- Market Size Value (USD Million) Forecast By Market Taxonomy, 2026 to 2036
- By Country
- GCC Countries
- South Africa
- Türkiye
- Israel
- By Fermentation Organism
- By Physical Formulation
- By Functional Characteristic
- By Commercial Application
- By Distribution Channel
- By Country
- Market Attractiveness Analysis
- By Country
- By Fermentation Organism
- By Physical Formulation
- By Functional Characteristic
- By Commercial Application
- By Distribution Channel
- Key Takeaways
- Key Countries Market Analysis
- United States
- Pricing Analysis
- Market Share Analysis, 2025
- By Fermentation Organism
- By Physical Formulation
- By Functional Characteristic
- By Commercial Application
- By Distribution Channel
- Canada
- Pricing Analysis
- Market Share Analysis, 2025
- By Fermentation Organism
- By Physical Formulation
- By Functional Characteristic
- By Commercial Application
- By Distribution Channel
- Mexico
- Pricing Analysis
- Market Share Analysis, 2025
- By Fermentation Organism
- By Physical Formulation
- By Functional Characteristic
- By Commercial Application
- By Distribution Channel
- Brazil
- Pricing Analysis
- Market Share Analysis, 2025
- By Fermentation Organism
- By Physical Formulation
- By Functional Characteristic
- By Commercial Application
- By Distribution Channel
- Chile
- Pricing Analysis
- Market Share Analysis, 2025
- By Fermentation Organism
- By Physical Formulation
- By Functional Characteristic
- By Commercial Application
- By Distribution Channel
- Germany
- Pricing Analysis
- Market Share Analysis, 2025
- By Fermentation Organism
- By Physical Formulation
- By Functional Characteristic
- By Commercial Application
- By Distribution Channel
- United Kingdom
- Pricing Analysis
- Market Share Analysis, 2025
- By Fermentation Organism
- By Physical Formulation
- By Functional Characteristic
- By Commercial Application
- By Distribution Channel
- Italy
- Pricing Analysis
- Market Share Analysis, 2025
- By Fermentation Organism
- By Physical Formulation
- By Functional Characteristic
- By Commercial Application
- By Distribution Channel
- Spain
- Pricing Analysis
- Market Share Analysis, 2025
- By Fermentation Organism
- By Physical Formulation
- By Functional Characteristic
- By Commercial Application
- By Distribution Channel
- France
- Pricing Analysis
- Market Share Analysis, 2025
- By Fermentation Organism
- By Physical Formulation
- By Functional Characteristic
- By Commercial Application
- By Distribution Channel
- India
- Pricing Analysis
- Market Share Analysis, 2025
- By Fermentation Organism
- By Physical Formulation
- By Functional Characteristic
- By Commercial Application
- By Distribution Channel
- ASEAN
- Pricing Analysis
- Market Share Analysis, 2025
- By Fermentation Organism
- By Physical Formulation
- By Functional Characteristic
- By Commercial Application
- By Distribution Channel
- Australia and New Zealand
- Pricing Analysis
- Market Share Analysis, 2025
- By Fermentation Organism
- By Physical Formulation
- By Functional Characteristic
- By Commercial Application
- By Distribution Channel
- China
- Pricing Analysis
- Market Share Analysis, 2025
- By Fermentation Organism
- By Physical Formulation
- By Functional Characteristic
- By Commercial Application
- By Distribution Channel
- Japan
- Pricing Analysis
- Market Share Analysis, 2025
- By Fermentation Organism
- By Physical Formulation
- By Functional Characteristic
- By Commercial Application
- By Distribution Channel
- South Korea
- Pricing Analysis
- Market Share Analysis, 2025
- By Fermentation Organism
- By Physical Formulation
- By Functional Characteristic
- By Commercial Application
- By Distribution Channel
- Poland
- Pricing Analysis
- Market Share Analysis, 2025
- By Fermentation Organism
- By Physical Formulation
- By Functional Characteristic
- By Commercial Application
- By Distribution Channel
- Hungary
- Pricing Analysis
- Market Share Analysis, 2025
- By Fermentation Organism
- By Physical Formulation
- By Functional Characteristic
- By Commercial Application
- By Distribution Channel
- Türkiye
- Pricing Analysis
- Market Share Analysis, 2025
- By Fermentation Organism
- By Physical Formulation
- By Functional Characteristic
- By Commercial Application
- By Distribution Channel
- South Africa
- Pricing Analysis
- Market Share Analysis, 2025
- By Fermentation Organism
- By Physical Formulation
- By Functional Characteristic
- By Commercial Application
- By Distribution Channel
- Saudi Arabia
- Pricing Analysis
- Market Share Analysis, 2025
- By Fermentation Organism
- By Physical Formulation
- By Functional Characteristic
- By Commercial Application
- By Distribution Channel
- Netherlands
- Pricing Analysis
- Market Share Analysis, 2025
- By Fermentation Organism
- By Physical Formulation
- By Functional Characteristic
- By Commercial Application
- By Distribution Channel
- United States
- Market Structure Analysis
- Competition Dashboard
- Competition Benchmarking
- Market Share Analysis of Top Players
- By Regional
- By Fermentation Organism
- By Physical Formulation
- By Functional Characteristic
- By Commercial Application
- By Distribution Channel
- Emerging Startups
- Innovation Benchmarking
- Competition Analysis
- Competition Deep Dive
- Cargill Incorporated
- Overview
- Product Portfolio
- Profitability by Market Segments
- Sales Footprint
- Strategy Overview
- Marketing Strategy
- Product Strategy
- Channel Strategy
- Alban Muller (Croda Plc)
- dsm-firmenich AG
- Archer Daniels Midland Company
- Symrise AG
- Givaudan SA
- Novonesis (Chr. Hansen)
- SLB (Schlumberger Limited)
- Halliburton Company
- SNF Group
- Alban Muller International (Croda International Plc)
- Global Bio-Fermentation and Cosmetic Active Houses
- Novonesis (Chr. Hansen Holding A/S)
- Cargill Incorporated
- Case Studies
- Success Stories
- Recent Developments
- Competition Deep Dive
- Assumptions & Acronyms Used
List of Tables
- Table 1: Global Market Value (USD Million) Forecast by Region, 2021 to 2036
- Table 2: Global Market Value (USD Million) Forecast by Fermentation Organism, 2021 to 2036
- Table 3: Global Market Value (USD Million) Forecast by Physical Formulation, 2021 to 2036
- Table 4: Global Market Value (USD Million) Forecast by Functional Characteristic, 2021 to 2036
- Table 5: Global Market Value (USD Million) Forecast by Commercial Application, 2021 to 2036
- Table 6: Global Market Value (USD Million) Forecast by Distribution Channel, 2021 to 2036
- Table 7: North America Market Value (USD Million) Forecast by Country, 2021 to 2036
- Table 8: North America Market Value (USD Million) Forecast by Fermentation Organism, 2021 to 2036
- Table 9: North America Market Value (USD Million) Forecast by Physical Formulation, 2021 to 2036
- Table 10: North America Market Value (USD Million) Forecast by Functional Characteristic, 2021 to 2036
- Table 11: North America Market Value (USD Million) Forecast by Commercial Application, 2021 to 2036
- Table 12: North America Market Value (USD Million) Forecast by Distribution Channel, 2021 to 2036
- Table 13: Latin America Market Value (USD Million) Forecast by Country, 2021 to 2036
- Table 14: Latin America Market Value (USD Million) Forecast by Fermentation Organism, 2021 to 2036
- Table 15: Latin America Market Value (USD Million) Forecast by Physical Formulation, 2021 to 2036
- Table 16: Latin America Market Value (USD Million) Forecast by Functional Characteristic, 2021 to 2036
- Table 17: Latin America Market Value (USD Million) Forecast by Commercial Application, 2021 to 2036
- Table 18: Latin America Market Value (USD Million) Forecast by Distribution Channel, 2021 to 2036
- Table 19: Western Europe Market Value (USD Million) Forecast by Country, 2021 to 2036
- Table 20: Western Europe Market Value (USD Million) Forecast by Fermentation Organism, 2021 to 2036
- Table 21: Western Europe Market Value (USD Million) Forecast by Physical Formulation, 2021 to 2036
- Table 22: Western Europe Market Value (USD Million) Forecast by Functional Characteristic, 2021 to 2036
- Table 23: Western Europe Market Value (USD Million) Forecast by Commercial Application, 2021 to 2036
- Table 24: Western Europe Market Value (USD Million) Forecast by Distribution Channel, 2021 to 2036
- Table 25: Eastern Europe Market Value (USD Million) Forecast by Country, 2021 to 2036
- Table 26: Eastern Europe Market Value (USD Million) Forecast by Fermentation Organism, 2021 to 2036
- Table 27: Eastern Europe Market Value (USD Million) Forecast by Physical Formulation, 2021 to 2036
- Table 28: Eastern Europe Market Value (USD Million) Forecast by Functional Characteristic, 2021 to 2036
- Table 29: Eastern Europe Market Value (USD Million) Forecast by Commercial Application, 2021 to 2036
- Table 30: Eastern Europe Market Value (USD Million) Forecast by Distribution Channel, 2021 to 2036
- Table 31: East Asia Market Value (USD Million) Forecast by Country, 2021 to 2036
- Table 32: East Asia Market Value (USD Million) Forecast by Fermentation Organism, 2021 to 2036
- Table 33: East Asia Market Value (USD Million) Forecast by Physical Formulation, 2021 to 2036
- Table 34: East Asia Market Value (USD Million) Forecast by Functional Characteristic, 2021 to 2036
- Table 35: East Asia Market Value (USD Million) Forecast by Commercial Application, 2021 to 2036
- Table 36: East Asia Market Value (USD Million) Forecast by Distribution Channel, 2021 to 2036
- Table 37: South Asia and Pacific Market Value (USD Million) Forecast by Country, 2021 to 2036
- Table 38: South Asia and Pacific Market Value (USD Million) Forecast by Fermentation Organism, 2021 to 2036
- Table 39: South Asia and Pacific Market Value (USD Million) Forecast by Physical Formulation, 2021 to 2036
- Table 40: South Asia and Pacific Market Value (USD Million) Forecast by Functional Characteristic, 2021 to 2036
- Table 41: South Asia and Pacific Market Value (USD Million) Forecast by Commercial Application, 2021 to 2036
- Table 42: South Asia and Pacific Market Value (USD Million) Forecast by Distribution Channel, 2021 to 2036
- Table 43: Middle East and Africa Market Value (USD Million) Forecast by Country, 2021 to 2036
- Table 44: Middle East and Africa Market Value (USD Million) Forecast by Fermentation Organism, 2021 to 2036
- Table 45: Middle East and Africa Market Value (USD Million) Forecast by Physical Formulation, 2021 to 2036
- Table 46: Middle East and Africa Market Value (USD Million) Forecast by Functional Characteristic, 2021 to 2036
- Table 47: Middle East and Africa Market Value (USD Million) Forecast by Commercial Application, 2021 to 2036
- Table 48: Middle East and Africa Market Value (USD Million) Forecast by Distribution Channel, 2021 to 2036
List of Figures
- Figure 1: Global Market Pricing Analysis
- Figure 2: Global Market Value (USD Million) Forecast 2021-2036
- Figure 3: Global Market Value Share and BPS Analysis by Fermentation Organism, 2026 and 2036
- Figure 4: Global Market Y-o-Y Growth Comparison by Fermentation Organism, 2026-2036
- Figure 5: Global Market Attractiveness Analysis by Fermentation Organism
- Figure 6: Global Market Value Share and BPS Analysis by Physical Formulation, 2026 and 2036
- Figure 7: Global Market Y-o-Y Growth Comparison by Physical Formulation, 2026-2036
- Figure 8: Global Market Attractiveness Analysis by Physical Formulation
- Figure 9: Global Market Value Share and BPS Analysis by Functional Characteristic, 2026 and 2036
- Figure 10: Global Market Y-o-Y Growth Comparison by Functional Characteristic, 2026-2036
- Figure 11: Global Market Attractiveness Analysis by Functional Characteristic
- Figure 12: Global Market Value Share and BPS Analysis by Commercial Application, 2026 and 2036
- Figure 13: Global Market Y-o-Y Growth Comparison by Commercial Application, 2026-2036
- Figure 14: Global Market Attractiveness Analysis by Commercial Application
- Figure 15: Global Market Value Share and BPS Analysis by Distribution Channel, 2026 and 2036
- Figure 16: Global Market Y-o-Y Growth Comparison by Distribution Channel, 2026-2036
- Figure 17: Global Market Attractiveness Analysis by Distribution Channel
- Figure 18: Global Market Value (USD Million) Share and BPS Analysis by Region, 2026 and 2036
- Figure 19: Global Market Y-o-Y Growth Comparison by Region, 2026-2036
- Figure 20: Global Market Attractiveness Analysis by Region
- Figure 21: North America Market Incremental Dollar Opportunity, 2026-2036
- Figure 22: Latin America Market Incremental Dollar Opportunity, 2026-2036
- Figure 23: Western Europe Market Incremental Dollar Opportunity, 2026-2036
- Figure 24: Eastern Europe Market Incremental Dollar Opportunity, 2026-2036
- Figure 25: East Asia Market Incremental Dollar Opportunity, 2026-2036
- Figure 26: South Asia and Pacific Market Incremental Dollar Opportunity, 2026-2036
- Figure 27: Middle East and Africa Market Incremental Dollar Opportunity, 2026-2036
- Figure 28: North America Market Value Share and BPS Analysis by Country, 2026 and 2036
- Figure 29: North America Market Value Share and BPS Analysis by Fermentation Organism, 2026 and 2036
- Figure 30: North America Market Y-o-Y Growth Comparison by Fermentation Organism, 2026-2036
- Figure 31: North America Market Attractiveness Analysis by Fermentation Organism
- Figure 32: North America Market Value Share and BPS Analysis by Physical Formulation, 2026 and 2036
- Figure 33: North America Market Y-o-Y Growth Comparison by Physical Formulation, 2026-2036
- Figure 34: North America Market Attractiveness Analysis by Physical Formulation
- Figure 35: North America Market Value Share and BPS Analysis by Functional Characteristic, 2026 and 2036
- Figure 36: North America Market Y-o-Y Growth Comparison by Functional Characteristic, 2026-2036
- Figure 37: North America Market Attractiveness Analysis by Functional Characteristic
- Figure 38: North America Market Value Share and BPS Analysis by Commercial Application, 2026 and 2036
- Figure 39: North America Market Y-o-Y Growth Comparison by Commercial Application, 2026-2036
- Figure 40: North America Market Attractiveness Analysis by Commercial Application
- Figure 41: North America Market Value Share and BPS Analysis by Distribution Channel, 2026 and 2036
- Figure 42: North America Market Y-o-Y Growth Comparison by Distribution Channel, 2026-2036
- Figure 43: North America Market Attractiveness Analysis by Distribution Channel
- Figure 44: Latin America Market Value Share and BPS Analysis by Country, 2026 and 2036
- Figure 45: Latin America Market Value Share and BPS Analysis by Fermentation Organism, 2026 and 2036
- Figure 46: Latin America Market Y-o-Y Growth Comparison by Fermentation Organism, 2026-2036
- Figure 47: Latin America Market Attractiveness Analysis by Fermentation Organism
- Figure 48: Latin America Market Value Share and BPS Analysis by Physical Formulation, 2026 and 2036
- Figure 49: Latin America Market Y-o-Y Growth Comparison by Physical Formulation, 2026-2036
- Figure 50: Latin America Market Attractiveness Analysis by Physical Formulation
- Figure 51: Latin America Market Value Share and BPS Analysis by Functional Characteristic, 2026 and 2036
- Figure 52: Latin America Market Y-o-Y Growth Comparison by Functional Characteristic, 2026-2036
- Figure 53: Latin America Market Attractiveness Analysis by Functional Characteristic
- Figure 54: Latin America Market Value Share and BPS Analysis by Commercial Application, 2026 and 2036
- Figure 55: Latin America Market Y-o-Y Growth Comparison by Commercial Application, 2026-2036
- Figure 56: Latin America Market Attractiveness Analysis by Commercial Application
- Figure 57: Latin America Market Value Share and BPS Analysis by Distribution Channel, 2026 and 2036
- Figure 58: Latin America Market Y-o-Y Growth Comparison by Distribution Channel, 2026-2036
- Figure 59: Latin America Market Attractiveness Analysis by Distribution Channel
- Figure 60: Western Europe Market Value Share and BPS Analysis by Country, 2026 and 2036
- Figure 61: Western Europe Market Value Share and BPS Analysis by Fermentation Organism, 2026 and 2036
- Figure 62: Western Europe Market Y-o-Y Growth Comparison by Fermentation Organism, 2026-2036
- Figure 63: Western Europe Market Attractiveness Analysis by Fermentation Organism
- Figure 64: Western Europe Market Value Share and BPS Analysis by Physical Formulation, 2026 and 2036
- Figure 65: Western Europe Market Y-o-Y Growth Comparison by Physical Formulation, 2026-2036
- Figure 66: Western Europe Market Attractiveness Analysis by Physical Formulation
- Figure 67: Western Europe Market Value Share and BPS Analysis by Functional Characteristic, 2026 and 2036
- Figure 68: Western Europe Market Y-o-Y Growth Comparison by Functional Characteristic, 2026-2036
- Figure 69: Western Europe Market Attractiveness Analysis by Functional Characteristic
- Figure 70: Western Europe Market Value Share and BPS Analysis by Commercial Application, 2026 and 2036
- Figure 71: Western Europe Market Y-o-Y Growth Comparison by Commercial Application, 2026-2036
- Figure 72: Western Europe Market Attractiveness Analysis by Commercial Application
- Figure 73: Western Europe Market Value Share and BPS Analysis by Distribution Channel, 2026 and 2036
- Figure 74: Western Europe Market Y-o-Y Growth Comparison by Distribution Channel, 2026-2036
- Figure 75: Western Europe Market Attractiveness Analysis by Distribution Channel
- Figure 76: Eastern Europe Market Value Share and BPS Analysis by Country, 2026 and 2036
- Figure 77: Eastern Europe Market Value Share and BPS Analysis by Fermentation Organism, 2026 and 2036
- Figure 78: Eastern Europe Market Y-o-Y Growth Comparison by Fermentation Organism, 2026-2036
- Figure 79: Eastern Europe Market Attractiveness Analysis by Fermentation Organism
- Figure 80: Eastern Europe Market Value Share and BPS Analysis by Physical Formulation, 2026 and 2036
- Figure 81: Eastern Europe Market Y-o-Y Growth Comparison by Physical Formulation, 2026-2036
- Figure 82: Eastern Europe Market Attractiveness Analysis by Physical Formulation
- Figure 83: Eastern Europe Market Value Share and BPS Analysis by Functional Characteristic, 2026 and 2036
- Figure 84: Eastern Europe Market Y-o-Y Growth Comparison by Functional Characteristic, 2026-2036
- Figure 85: Eastern Europe Market Attractiveness Analysis by Functional Characteristic
- Figure 86: Eastern Europe Market Value Share and BPS Analysis by Commercial Application, 2026 and 2036
- Figure 87: Eastern Europe Market Y-o-Y Growth Comparison by Commercial Application, 2026-2036
- Figure 88: Eastern Europe Market Attractiveness Analysis by Commercial Application
- Figure 89: Eastern Europe Market Value Share and BPS Analysis by Distribution Channel, 2026 and 2036
- Figure 90: Eastern Europe Market Y-o-Y Growth Comparison by Distribution Channel, 2026-2036
- Figure 91: Eastern Europe Market Attractiveness Analysis by Distribution Channel
- Figure 92: East Asia Market Value Share and BPS Analysis by Country, 2026 and 2036
- Figure 93: East Asia Market Value Share and BPS Analysis by Fermentation Organism, 2026 and 2036
- Figure 94: East Asia Market Y-o-Y Growth Comparison by Fermentation Organism, 2026-2036
- Figure 95: East Asia Market Attractiveness Analysis by Fermentation Organism
- Figure 96: East Asia Market Value Share and BPS Analysis by Physical Formulation, 2026 and 2036
- Figure 97: East Asia Market Y-o-Y Growth Comparison by Physical Formulation, 2026-2036
- Figure 98: East Asia Market Attractiveness Analysis by Physical Formulation
- Figure 99: East Asia Market Value Share and BPS Analysis by Functional Characteristic, 2026 and 2036
- Figure 100: East Asia Market Y-o-Y Growth Comparison by Functional Characteristic, 2026-2036
- Figure 101: East Asia Market Attractiveness Analysis by Functional Characteristic
- Figure 102: East Asia Market Value Share and BPS Analysis by Commercial Application, 2026 and 2036
- Figure 103: East Asia Market Y-o-Y Growth Comparison by Commercial Application, 2026-2036
- Figure 104: East Asia Market Attractiveness Analysis by Commercial Application
- Figure 105: East Asia Market Value Share and BPS Analysis by Distribution Channel, 2026 and 2036
- Figure 106: East Asia Market Y-o-Y Growth Comparison by Distribution Channel, 2026-2036
- Figure 107: East Asia Market Attractiveness Analysis by Distribution Channel
- Figure 108: South Asia and Pacific Market Value Share and BPS Analysis by Country, 2026 and 2036
- Figure 109: South Asia and Pacific Market Value Share and BPS Analysis by Fermentation Organism, 2026 and 2036
- Figure 110: South Asia and Pacific Market Y-o-Y Growth Comparison by Fermentation Organism, 2026-2036
- Figure 111: South Asia and Pacific Market Attractiveness Analysis by Fermentation Organism
- Figure 112: South Asia and Pacific Market Value Share and BPS Analysis by Physical Formulation, 2026 and 2036
- Figure 113: South Asia and Pacific Market Y-o-Y Growth Comparison by Physical Formulation, 2026-2036
- Figure 114: South Asia and Pacific Market Attractiveness Analysis by Physical Formulation
- Figure 115: South Asia and Pacific Market Value Share and BPS Analysis by Functional Characteristic, 2026 and 2036
- Figure 116: South Asia and Pacific Market Y-o-Y Growth Comparison by Functional Characteristic, 2026-2036
- Figure 117: South Asia and Pacific Market Attractiveness Analysis by Functional Characteristic
- Figure 118: South Asia and Pacific Market Value Share and BPS Analysis by Commercial Application, 2026 and 2036
- Figure 119: South Asia and Pacific Market Y-o-Y Growth Comparison by Commercial Application, 2026-2036
- Figure 120: South Asia and Pacific Market Attractiveness Analysis by Commercial Application
- Figure 121: South Asia and Pacific Market Value Share and BPS Analysis by Distribution Channel, 2026 and 2036
- Figure 122: South Asia and Pacific Market Y-o-Y Growth Comparison by Distribution Channel, 2026-2036
- Figure 123: South Asia and Pacific Market Attractiveness Analysis by Distribution Channel
- Figure 124: Middle East and Africa Market Value Share and BPS Analysis by Country, 2026 and 2036
- Figure 125: Middle East and Africa Market Value Share and BPS Analysis by Fermentation Organism, 2026 and 2036
- Figure 126: Middle East and Africa Market Y-o-Y Growth Comparison by Fermentation Organism, 2026-2036
- Figure 127: Middle East and Africa Market Attractiveness Analysis by Fermentation Organism
- Figure 128: Middle East and Africa Market Value Share and BPS Analysis by Physical Formulation, 2026 and 2036
- Figure 129: Middle East and Africa Market Y-o-Y Growth Comparison by Physical Formulation, 2026-2036
- Figure 130: Middle East and Africa Market Attractiveness Analysis by Physical Formulation
- Figure 131: Middle East and Africa Market Value Share and BPS Analysis by Functional Characteristic, 2026 and 2036
- Figure 132: Middle East and Africa Market Y-o-Y Growth Comparison by Functional Characteristic, 2026-2036
- Figure 133: Middle East and Africa Market Attractiveness Analysis by Functional Characteristic
- Figure 134: Middle East and Africa Market Value Share and BPS Analysis by Commercial Application, 2026 and 2036
- Figure 135: Middle East and Africa Market Y-o-Y Growth Comparison by Commercial Application, 2026-2036
- Figure 136: Middle East and Africa Market Attractiveness Analysis by Commercial Application
- Figure 137: Middle East and Africa Market Value Share and BPS Analysis by Distribution Channel, 2026 and 2036
- Figure 138: Middle East and Africa Market Y-o-Y Growth Comparison by Distribution Channel, 2026-2036
- Figure 139: Middle East and Africa Market Attractiveness Analysis by Distribution Channel
- Figure 140: Global Market - Tier Structure Analysis
- Figure 141: Global Market - Company Share Analysis
Frequently Asked Questions
How big is the scleroglucan market in 2026, and what is forecast for 2036?
For 2025, global scleroglucan industry size totaled USD 589.0 million and progressed for 2026 to USD 617.0 million. Long-term market size is forecast to attain a 2036 ceiling of USD 1,005.0 million while HTHS oilfield operators and clean-beauty formulators adopt non-ionic fungal beta-glucans.
What is the CAGR for the scleroglucan market from 2026 to 2036?
Scleroglucan market valuation expands at a 5.0% ten-year rate through 2036, delivering USD 388.0 million in added value across oilfield and personal care with coating and specialty food applications.
Which fermentation organism segment leads the scleroglucan market?
Sclerotium rolfsii Fungal Submerged Fermentation holds 78.5% of fermentation organism demand in 2026 (reconciled from a raw 108.5% table typo) because aerobic stirred-tank cultures deliver high molecular weight and uniform beta-1,6 branching.
Which physical formulation segment leads the scleroglucan market?
Refined Dry Soluble Powder claims 72.6% within physical formulations in 2026 as alcohol-precipitated dry powders reduce international shipping weight and hydrate rapidly in field brines.
Which country has a notable growth outlook during the assessment period?
The United States ranks first in national growth with a 5.6% rate to 2036, anchored by high-salinity Permian and Gulf Coast drilling fluids and domestic clean-beauty serum reformulation.
Who are the key players in the market?
Cargill and Alban Muller (Croda) with dsm-firmenich and ADM lead biopolymer and fermentation supply. Symrise and Givaudan with Novonesis anchor cosmetic actives and industrial fermentation, while SLB and Halliburton with SNF Group lead oilfield fluid integration.
Preview the report firsthand - request a free sample
Get SampleGet the brochure for pricing and purchase details.
Get PDF
