Reports

- Global Locations -

Headquarters

Future Market Insights, Inc.

Christiana Corporate, 200
Continental Drive, Suite 401,
Newark, Delaware - 19713,
United States

T: +1-845-579-5705

Americas

Future Market Insights, Inc.

616 Corporate Way, Suite 2-9018,
Valley Cottage, NY 10989, United States

T: +1-347-918-3531

MEA

Future Market Insights

1602-6 Jumeirah Bay X2 Tower, Plot No: JLT-PH2-X2A,
Jumeirah Lakes Towers, Dubai,
United Arab Emirates

Europe

Future Market Insights

3rd Floor, 207 Regent Street,
W1B 3HH London
United Kingdom

T: + 44 (0) 20 8123 9659
D: +44 (0) 20 3287 4268

Asia Pacific

Future Market Insights

IndiaLand Global Tech Park, Unit UG-1, Behind Grand HighStreet, Phase 1, Hinjawadi, MH, Pune – 411057, India

Teleradiology Market Outlook for 2023 to 2033

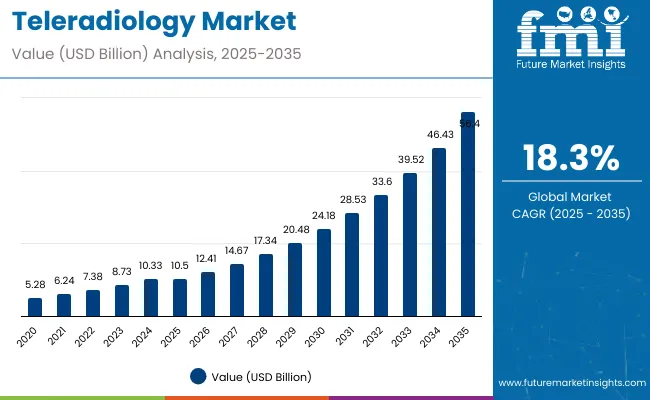
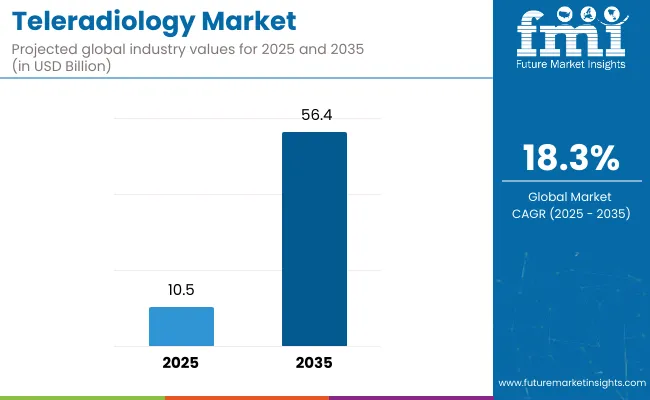
The valuation of the teleradiology market is estimated to be US$ 7,567.50 million in 2023. The market was valued at US$ 6,489.20 million in 2022. The market is projected to show outstanding growth over the forecast period, expanding at a CAGR of 18.4% through 2033. The size of the market is predicted to reach US$ 40,873.30 million by 2033.

Consumption Analysis of the Teleradiology Market

  • Teleradiology is employed in examining patients in the absence of radiologists. The increasing number of patients makes the physical examination of patients by doctors difficult. In such cases, the help of teleradiology is sought.
  • Adoption of technology in the healthcare sector is rising rapidly. The integration of technology into healthcare is paving the way for the use of teleradiology.
  • Diagnostic testing is rising due to the prevalence of diseases requiring procedures like X-ray, CT scans, and MRI. The teleradiology market benefits as a result of the increase in diagnostic testing.
  • Producers in the market are focusing on the high effectiveness of the products. Thus, features like high-resolution images and seamless transmission are being developed, boosting market growth.
  • Teleradiology was earlier limited to emergencies. However, due to the increased healthcare institutions and patients, teleradiology is now being incorporated into healthcare procedures more frequently.
Attributes Details
Teleradiology Market Value in 2023 US$ 7,567.50 million
Projected Market Value by 2033 US$ 40,873.30 million
Value-based CAGR from 2023 to 2033 18.4%

Don't pay for what you don't need

Customize your report by selecting specific countries or regions and save 30%!

Historical Performance of the Teleradiology Market

The size of the teleradiology market was US$ 2,865.00 million in 2018. The market progressed at a CAGR of 22.0% during the historical period from 2018 to 2022.

The adoption of teleradiology into healthcare procedures is expected to rise during the historical period. The pandemic highlighted the need for teleradiology as there were restrictions on travel. The pandemic period also led to an increased number of patients. To manage the load of patients, doctors resorted to teleradiology. The market value reached US$ 6,489.20 million in 2022.

Market Value (2018) US$ 2,865.00 million
Historical CAGR (2018 to 2022) 22.0%
Historical Market Valuation (2022) US$ 6,489.20 million

Long-Term Analysis of the Teleradiology Market

The teleradiology market is estimated to be worth US$ 7,567.50 million in 2023. The market is expected to grow at an exceptional CAGR of 18.4% through 2033.

The market's progress over the forecast period is anticipated to be slower than the historical period. The pandemic influenced monumental growth in the historical period. However, the market is still slated to be lucrative during the historical period due to the increasing acceptance of teleradiology.

The incidence of diseases that require diagnostic testing is rising, and thus, there is more demand for diagnostic equipment. The rising demand for diagnostic equipment also leads to the growth of the teleradiology market. As online communication becomes more popular, the virtual travel of information is becoming the norm in many industries. Teleradiology is one way through which the healthcare industry is embracing digitalization. By 2033, the market is projected to reach a valuation of US$ 40,873.30 million.

Teleradiology Market Analysis and Trends

  • Government aid is helping healthcare institutions integrate advanced technology, including teleradiology.
  • Lack of medical personnel in remote and less economically advanced areas is stimulating the demand for teleradiology.
  • Companies in the market are bundling teleradiology with radiology equipment. As a result, hospitals needing radiology equipment are also getting access to teleradiology.
  • Innovations in teleradiology are aiding market growth. For example, 3D report viewing lays a better picture of the specific organ.
  • With several technological advancements, AI is being integrated with teleradiology to achieve greater efficiency. This reduces the reading time of scans by the machine.
  • New imaging procedures, such as computed tomography, magnetic resonance imaging, and molecular imaging, are being introduced in the healthcare sector, expanding the purview of imaging procedures. An increase in imaging procedures is conducive to the growth of teleradiology.
  • With the rapidly aging population, the number of patients is expected to increase, intensifying the demand for teleradiology.
Sabyasachi Ghosh
Sabyasachi Ghosh

Principal Consultant

Talk to Analyst

Find your sweet spots for generating winning opportunities in this market.

Comparative View of Adjacent Markets

In addition to the teleradiology market, two related markets have been discussed in the section below. One is closely tied to the teleradiology market, while the other is related to medical imaging. These markets are the teleradiology service market and the specific imaging solution market.

By analyzing the three markets in conjunction, the positive trend of healthcare technologies can be observed. The rapid progress of technology in the healthcare sector is a common trend observed.

Teleradiology Market:

Attributes Teleradiology Market
Value-based CAGR (2023 to 2033) 18.4%
Projected Market Value (2033) US$ 40,873.30 million
Market Trends
  • Government aid helping market growth
  • Teleradiology helping in medical services for remote and rural areas
Growth Factors
  • Busy working schedules of doctors seeing professionals turn to teleradiology
  • Increasing diagnostic testing

Teleradiology Service Market:

Attributes Teleradiology Service Market
Value-based CAGR (2023 to 2033) 12.2%
Projected Market Value (2033) US$ 22,069.5 million
Market Trends
  • Mobile radiology applications making working convenient
  • 3D printing technologies giving new dimension to market
Growth Factors
  • Digital revolution in the healthcare industry
  • Favorable regulatory frameworks

Specific Imaging Solution Market:

Attributes Specific Imaging Solution Market
Value-based CAGR (2023 to 2033) 6.5%
Projected Market Value (2033) US$ 756.3 Million
Market Trends
  • AI-powered image analysis
  • Usage of the Internet of Things (IoT) and data analytics in imaging solutions
Growth Factors
  • Specific imaging solution reducing the time required from medical professionals
  • Prevalence of diseases that require specific imaging solutions increasing

Category-wise Outlook

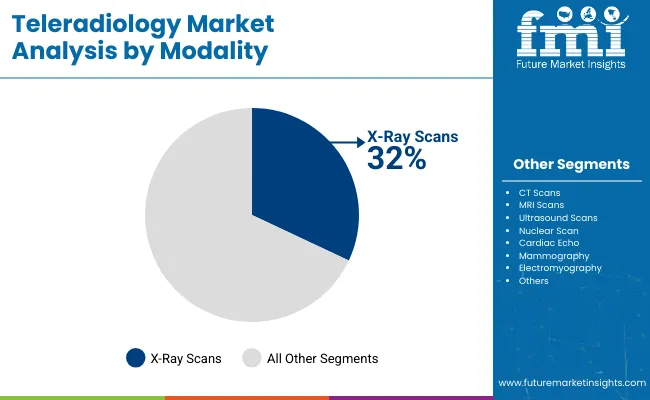
X-Rays Have Overtaken Other Scans to Become Top Modality in Market

The X-ray technique has emerged as the top scan type in the market. The X-ray segment is expected to account for 23.1% of the market share by modality in 2023.

CT scans ruled the market by modality, especially during the pandemic when issues such as heart problems had increased. However, X-ray scans have gradually overtaken CT scans and are now most routinely used in teleradiology.

Attributes Details
Top Modality X-rays
Market Share in 2023 23.1%

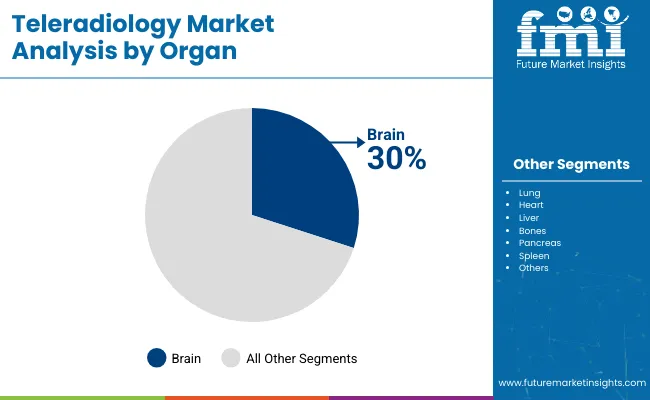
Teleradiology is Most Commonly Used in Brain Scans

Scans of the brain are the most popular application of teleradiology. The brain segment is anticipated to hold 28.2% of the market share in 2023.

Scans of the brain include computed tomography (CT), magnetic resonance imaging (MRI), and positive emission tomography (PET). As the incidence of brain problems continues, the need for scans increases.

Attributes Details
Top Organ Brain
Market Share in 2023 28.2%

Get the data you need at a Fraction of the cost

Personalize your report by choosing insights you need
and save 40%!

Country-wise Analysis

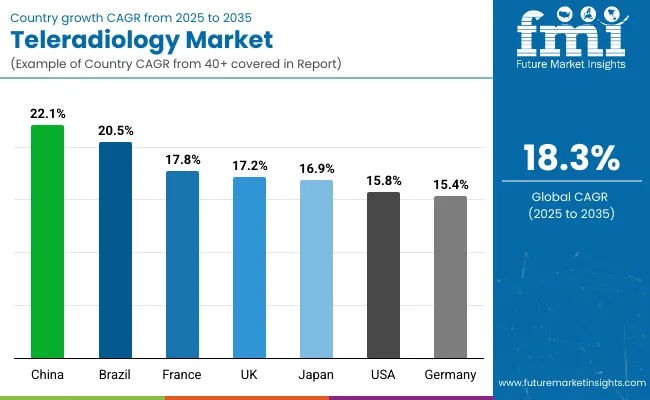
The Asia Pacific is marked for exponential growth in the market. The rising population in the region is leading to an increase in the number of healthcare institutions. However, in-person healthcare is not always practical. As such, medical professionals in Asia Pacific are resorting to teleradiology to contend with the increasing need for medical scans.

North America and Europe are other lucrative regions in the market; though the pace of progress in the two regions is estimated to be lower than in Asia Pacific, still significant opportunities are present.

Countries CAGR (2023 to 2033)
United States 8.3%
China 23.9%
United Kingdom 11.9%
Germany 11.0%
India 27.6%

Abundance of Healthcare Facilities Makes the United States Fertile Ground for Market

The United States holds a significant market share and is expected to progress at a CAGR of 8.3% through 2033.

The healthcare infrastructure in the United States is growing, and imaging procedures of various kinds are performed regularly in the United States. Thus, the teleradiology market benefits and is projected to thrive in the United States.

Prevalence of Radiology Experts Drives Market Demand in the United Kingdom

The United Kingdom is one of the most promising countries in the European market. The CAGR for the United Kingdom market is anticipated to be 11.9% through 2033.

There are a high number of professionals working in the radiology field in the United Kingdom. Thus, radiology equipment and scans are commonplace in the country. Teleradiology, too, is flourishing in the United Kingdom.

Aging Population of Germany Necessitates Innovation in Medical Technology, Including Teleradiology

Germany is another European country with significant potential for market growth. The CAGR for Germany is estimated to be 11.0% from 2023 to 2033.

With the rising aging population in Germany, there is an increasing demand for medical equipment. As the number of people afflicted with various problems rises in Germany, so does the need for scans.

Teleradiology Improving Medical Condition of Rural Population in India

India is one of the fastest-growing countries in the market. Over the forecast period, the CAGR for the market in India is projected to be 27.6%.

India is one of the most populous countries in the world. However, a significant portion of the population resides in rural areas, where a shortage of skilled medical personnel is often felt. To make up for the lack of experts in rural areas, the help of teleradiology is highly sought in India.

Cloud-based Teleradiology Increasingly Finding Acceptance in China

China is another Asian country filled with the potential for market growth. The market in China is expected to grow at a CAGR of 23.9% over the forecast years.

The introduction of cloud-based teleradiology has transformed the market in China. Several healthcare facilities in China are accepting teleradiology backed by cloud computing into the fold. Thus, China is a lucrative market for teleradiology.

Competitive Landscape in the Teleradiology Market

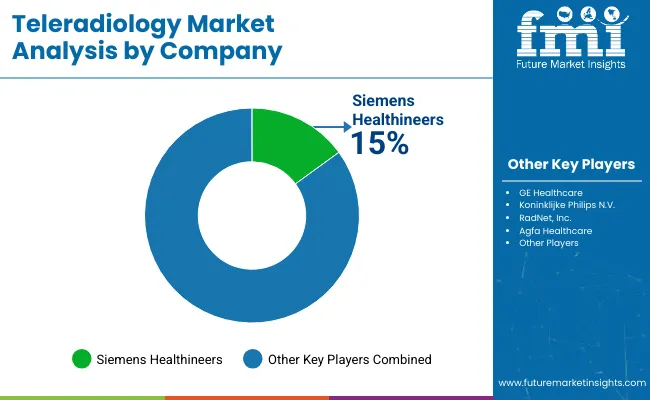
The market is dominated by a few big players. For the companies in the market, innovation is the name of the game. The market players are integrating such advanced technologies like AI and advanced compressing.

While there are a few dominant players in the market, startups are also striving to make room. The initiatives of the startups are often helped by government aid.

Recent Developments in the Teleradiology Market

  • In October 2023, IMAGE Information Systems and Aycan Medical Systems introduced a new version of the iQ-ROUTER. The product, jointly made by the two companies, has a new 5.0 version, enabling smooth data transmission along international lines.
  • Also in October 2023, Egyptian company Rology’s AI-assisted teleradiology platform received approval from the US Food and Drug Administration (FDA).
  • In July 2022, a partnership was established between market players Unilabs and Qure.ai. The partnership aims to develop a platform that helps with chest X-rays.

Key Companies in the Teleradiology Market

  • Cerner Corporation
  • Siemens Healthineers
  • McKesson Corporation
  • Agfa Healthcare
  • MEDNAX Services, Inc.
  • ONRAD Inc.
  • Novarad Corporation
  • TeleDiagnostic Solutions Pvt. Ltd.
  • Teleradiology Solutions
  • Telerad Tech
  • StatRad LLC
  • MedWeb LLC
  • USARAD Holdings, Inc.
  • Everlight Radiology SRL
  • Diagnostics, Vital Radiology Services
  • Telemedicine Clinic

Key Segments

By Modality:

  • X-Ray Scans
  • CT Scans
  • MRI Scans
  • Ultrasound Scans
  • Nuclear Scan
  • Cardiac Echo
  • Mammography
  • Electromyography

By Organ:

  • Brain
  • Lung
  • Heart
  • Liver
  • Bones
  • Pancreas
  • Spleen
  • Others

By Region:

  • North America
  • Latin America
  • Europe
  • South Asia
  • East Asia
  • Oceania
  • Middle East and Africa (MEA)

Frequently Asked Questions

What is the Size of the Teleradiology Market?

The size of the teleradiology market in 2023 is expected to be US$ 7,567.50 million.

How Big Will the Teleradiology Market Be by 2033?

By 2033, the size of the teleradiology market will be US$ 40,873.30 million.

What is the CAGR of the Teleradiology Market in India?

For the forecast period from 2023 to 2033, the teleradiology market in India is expected to progress at an incredible CAGR of 27.6%.

How Will the Teleradiology Market Progress in the United States?

The teleradiology market is expected to grow at a healthy CAGR of 8.3% from 2023 to 2033 in the United States.

Who are the Major Players in the Teleradiology Market?

Cerner Corporation, Siemens Healthineers, McKesson Corporation, and Agfa Healthcare are some of the prominent companies in the market.

Table of Content

1. Executive Summary

    1.1. Global Market Outlook

    1.2. Demand-side Trends

    1.3. Supply-side Trends

    1.4. Technology Roadmap Analysis

    1.5. Analysis and Recommendations

2. Market Overview

    2.1. Market Coverage / Taxonomy

    2.2. Market Definition / Scope / Limitations

3. Market Background

    3.1. Market Dynamics

        3.1.1. Drivers

        3.1.2. Restraints

        3.1.3. Opportunity

        3.1.4. Trends

    3.2. Scenario Forecast

        3.2.1. Demand in Optimistic Scenario

        3.2.2. Demand in Likely Scenario

        3.2.3. Demand in Conservative Scenario

    3.3. Opportunity Map Analysis

    3.4. Investment Feasibility Matrix

    3.5. PESTLE and Porter’s Analysis

    3.6. Regulatory Landscape

        3.6.1. By Key Regions

        3.6.2. By Key Countries

    3.7. Regional Parent Market Outlook

4. Global Market Analysis 2018 to 2022 and Forecast, 2023 to 2033

    4.1. Historical Market Size Value (US$ Million) Analysis, 2018 to 2022

    4.2. Current and Future Market Size Value (US$ Million) Projections, 2023 to 2033

        4.2.1. Y-o-Y Growth Trend Analysis

        4.2.2. Absolute $ Opportunity Analysis

5. Global Market Analysis 2018 to 2022 and Forecast 2023 to 2033, By Modality

    5.1. Introduction / Key Findings

    5.2. Historical Market Size Value (US$ Million) Analysis By Modality, 2018 to 2022

    5.3. Current and Future Market Size Value (US$ Million) Analysis and Forecast By Modality, 2023 to 2033

        5.3.1. X-Ray Scans

        5.3.2. CT Scans

        5.3.3. MRI Scans

        5.3.4. Ultrasound Scans

        5.3.5. Nuclear Scan

        5.3.6. Cardiac Echo

        5.3.7. Mammography

        5.3.8. Electromyography

    5.4. Y-o-Y Growth Trend Analysis By Modality, 2018 to 2022

    5.5. Absolute $ Opportunity Analysis By Modality, 2023 to 2033

6. Global Market Analysis 2018 to 2022 and Forecast 2023 to 2033, By End User

    6.1. Introduction / Key Findings

    6.2. Historical Market Size Value (US$ Million) Analysis By End User, 2018 to 2022

    6.3. Current and Future Market Size Value (US$ Million) Analysis and Forecast By End User, 2023 to 2033

        6.3.1. Hospitals

        6.3.2. Clinics

        6.3.3. Ambulatory Surgical Centres

        6.3.4. Radiology Centres

    6.4. Y-o-Y Growth Trend Analysis By End User, 2018 to 2022

    6.5. Absolute $ Opportunity Analysis By End User, 2023 to 2033

7. Global Market Analysis 2018 to 2022 and Forecast 2023 to 2033, By Region

    7.1. Introduction

    7.2. Historical Market Size Value (US$ Million) Analysis By Region, 2018 to 2022

    7.3. Current Market Size Value (US$ Million) Analysis and Forecast By Region, 2023 to 2033

        7.3.1. North America

        7.3.2. Latin America

        7.3.3. Western Europe

        7.3.4. Eastern Europe

        7.3.5. South Asia and Pacific

        7.3.6. East Asia

        7.3.7. Middle East and Africa

    7.4. Market Attractiveness Analysis By Region

8. North America Market Analysis 2018 to 2022 and Forecast 2023 to 2033, By Country

    8.1. Historical Market Size Value (US$ Million) Trend Analysis By Market Taxonomy, 2018 to 2022

    8.2. Market Size Value (US$ Million) Forecast By Market Taxonomy, 2023 to 2033

        8.2.1. By Country

            8.2.1.1. USA

            8.2.1.2. Canada

        8.2.2. By Modality

        8.2.3. By End User

    8.3. Market Attractiveness Analysis

        8.3.1. By Country

        8.3.2. By Modality

        8.3.3. By End User

    8.4. Key Takeaways

9. Latin America Market Analysis 2018 to 2022 and Forecast 2023 to 2033, By Country

    9.1. Historical Market Size Value (US$ Million) Trend Analysis By Market Taxonomy, 2018 to 2022

    9.2. Market Size Value (US$ Million) Forecast By Market Taxonomy, 2023 to 2033

        9.2.1. By Country

            9.2.1.1. Brazil

            9.2.1.2. Mexico

            9.2.1.3. Rest of Latin America

        9.2.2. By Modality

        9.2.3. By End User

    9.3. Market Attractiveness Analysis

        9.3.1. By Country

        9.3.2. By Modality

        9.3.3. By End User

    9.4. Key Takeaways

10. Western Europe Market Analysis 2018 to 2022 and Forecast 2023 to 2033, By Country

    10.1. Historical Market Size Value (US$ Million) Trend Analysis By Market Taxonomy, 2018 to 2022

    10.2. Market Size Value (US$ Million) Forecast By Market Taxonomy, 2023 to 2033

        10.2.1. By Country

            10.2.1.1. Germany

            10.2.1.2. UK

            10.2.1.3. France

            10.2.1.4. Spain

            10.2.1.5. Italy

            10.2.1.6. Rest of Western Europe

        10.2.2. By Modality

        10.2.3. By End User

    10.3. Market Attractiveness Analysis

        10.3.1. By Country

        10.3.2. By Modality

        10.3.3. By End User

    10.4. Key Takeaways

11. Eastern Europe Market Analysis 2018 to 2022 and Forecast 2023 to 2033, By Country

    11.1. Historical Market Size Value (US$ Million) Trend Analysis By Market Taxonomy, 2018 to 2022

    11.2. Market Size Value (US$ Million) Forecast By Market Taxonomy, 2023 to 2033

        11.2.1. By Country

            11.2.1.1. Poland

            11.2.1.2. Russia

            11.2.1.3. Czech Republic

            11.2.1.4. Romania

            11.2.1.5. Rest of Eastern Europe

        11.2.2. By Modality

        11.2.3. By End User

    11.3. Market Attractiveness Analysis

        11.3.1. By Country

        11.3.2. By Modality

        11.3.3. By End User

    11.4. Key Takeaways

12. South Asia and Pacific Market Analysis 2018 to 2022 and Forecast 2023 to 2033, By Country

    12.1. Historical Market Size Value (US$ Million) Trend Analysis By Market Taxonomy, 2018 to 2022

    12.2. Market Size Value (US$ Million) Forecast By Market Taxonomy, 2023 to 2033

        12.2.1. By Country

            12.2.1.1. India

            12.2.1.2. Bangladesh

            12.2.1.3. Australia

            12.2.1.4. New Zealand

            12.2.1.5. Rest of South Asia and Pacific

        12.2.2. By Modality

        12.2.3. By End User

    12.3. Market Attractiveness Analysis

        12.3.1. By Country

        12.3.2. By Modality

        12.3.3. By End User

    12.4. Key Takeaways

13. East Asia Market Analysis 2018 to 2022 and Forecast 2023 to 2033, By Country

    13.1. Historical Market Size Value (US$ Million) Trend Analysis By Market Taxonomy, 2018 to 2022

    13.2. Market Size Value (US$ Million) Forecast By Market Taxonomy, 2023 to 2033

        13.2.1. By Country

            13.2.1.1. China

            13.2.1.2. Japan

            13.2.1.3. South Korea

        13.2.2. By Modality

        13.2.3. By End User

    13.3. Market Attractiveness Analysis

        13.3.1. By Country

        13.3.2. By Modality

        13.3.3. By End User

    13.4. Key Takeaways

14. Middle East and Africa Market Analysis 2018 to 2022 and Forecast 2023 to 2033, By Country

    14.1. Historical Market Size Value (US$ Million) Trend Analysis By Market Taxonomy, 2018 to 2022

    14.2. Market Size Value (US$ Million) Forecast By Market Taxonomy, 2023 to 2033

        14.2.1. By Country

            14.2.1.1. GCC Countries

            14.2.1.2. South Africa

            14.2.1.3. Israel

            14.2.1.4. Rest of MEA

        14.2.2. By Modality

        14.2.3. By End User

    14.3. Market Attractiveness Analysis

        14.3.1. By Country

        14.3.2. By Modality

        14.3.3. By End User

    14.4. Key Takeaways

15. Key Countries Market Analysis

    15.1. USA

        15.1.1. Pricing Analysis

        15.1.2. Market Share Analysis, 2022

            15.1.2.1. By Modality

            15.1.2.2. By End User

    15.2. Canada

        15.2.1. Pricing Analysis

        15.2.2. Market Share Analysis, 2022

            15.2.2.1. By Modality

            15.2.2.2. By End User

    15.3. Brazil

        15.3.1. Pricing Analysis

        15.3.2. Market Share Analysis, 2022

            15.3.2.1. By Modality

            15.3.2.2. By End User

    15.4. Mexico

        15.4.1. Pricing Analysis

        15.4.2. Market Share Analysis, 2022

            15.4.2.1. By Modality

            15.4.2.2. By End User

    15.5. Germany

        15.5.1. Pricing Analysis

        15.5.2. Market Share Analysis, 2022

            15.5.2.1. By Modality

            15.5.2.2. By End User

    15.6. UK

        15.6.1. Pricing Analysis

        15.6.2. Market Share Analysis, 2022

            15.6.2.1. By Modality

            15.6.2.2. By End User

    15.7. France

        15.7.1. Pricing Analysis

        15.7.2. Market Share Analysis, 2022

            15.7.2.1. By Modality

            15.7.2.2. By End User

    15.8. Spain

        15.8.1. Pricing Analysis

        15.8.2. Market Share Analysis, 2022

            15.8.2.1. By Modality

            15.8.2.2. By End User

    15.9. Italy

        15.9.1. Pricing Analysis

        15.9.2. Market Share Analysis, 2022

            15.9.2.1. By Modality

            15.9.2.2. By End User

    15.10. Poland

        15.10.1. Pricing Analysis

        15.10.2. Market Share Analysis, 2022

            15.10.2.1. By Modality

            15.10.2.2. By End User

    15.11. Russia

        15.11.1. Pricing Analysis

        15.11.2. Market Share Analysis, 2022

            15.11.2.1. By Modality

            15.11.2.2. By End User

    15.12. Czech Republic

        15.12.1. Pricing Analysis

        15.12.2. Market Share Analysis, 2022

            15.12.2.1. By Modality

            15.12.2.2. By End User

    15.13. Romania

        15.13.1. Pricing Analysis

        15.13.2. Market Share Analysis, 2022

            15.13.2.1. By Modality

            15.13.2.2. By End User

    15.14. India

        15.14.1. Pricing Analysis

        15.14.2. Market Share Analysis, 2022

            15.14.2.1. By Modality

            15.14.2.2. By End User

    15.15. Bangladesh

        15.15.1. Pricing Analysis

        15.15.2. Market Share Analysis, 2022

            15.15.2.1. By Modality

            15.15.2.2. By End User

    15.16. Australia

        15.16.1. Pricing Analysis

        15.16.2. Market Share Analysis, 2022

            15.16.2.1. By Modality

            15.16.2.2. By End User

    15.17. New Zealand

        15.17.1. Pricing Analysis

        15.17.2. Market Share Analysis, 2022

            15.17.2.1. By Modality

            15.17.2.2. By End User

    15.18. China

        15.18.1. Pricing Analysis

        15.18.2. Market Share Analysis, 2022

            15.18.2.1. By Modality

            15.18.2.2. By End User

    15.19. Japan

        15.19.1. Pricing Analysis

        15.19.2. Market Share Analysis, 2022

            15.19.2.1. By Modality

            15.19.2.2. By End User

    15.20. South Korea

        15.20.1. Pricing Analysis

        15.20.2. Market Share Analysis, 2022

            15.20.2.1. By Modality

            15.20.2.2. By End User

    15.21. GCC Countries

        15.21.1. Pricing Analysis

        15.21.2. Market Share Analysis, 2022

            15.21.2.1. By Modality

            15.21.2.2. By End User

    15.22. South Africa

        15.22.1. Pricing Analysis

        15.22.2. Market Share Analysis, 2022

            15.22.2.1. By Modality

            15.22.2.2. By End User

    15.23. Israel

        15.23.1. Pricing Analysis

        15.23.2. Market Share Analysis, 2022

            15.23.2.1. By Modality

            15.23.2.2. By End User

16. Market Structure Analysis

    16.1. Competition Dashboard

    16.2. Competition Benchmarking

    16.3. Market Share Analysis of Top Players

        16.3.1. By Regional

        16.3.2. By Modality

        16.3.3. By End User

17. Competition Analysis

    17.1. Competition Deep Dive

        17.1.1. Cerner Corporation

            17.1.1.1. Overview

            17.1.1.2. Product Portfolio

            17.1.1.3. Profitability by Market Segments

            17.1.1.4. Sales Footprint

            17.1.1.5. Strategy Overview

                17.1.1.5.1. Marketing Strategy

        17.1.2. Siemens Healthineers

            17.1.2.1. Overview

            17.1.2.2. Product Portfolio

            17.1.2.3. Profitability by Market Segments

            17.1.2.4. Sales Footprint

            17.1.2.5. Strategy Overview

                17.1.2.5.1. Marketing Strategy

        17.1.3. McKesson Corporation

            17.1.3.1. Overview

            17.1.3.2. Product Portfolio

            17.1.3.3. Profitability by Market Segments

            17.1.3.4. Sales Footprint

            17.1.3.5. Strategy Overview

                17.1.3.5.1. Marketing Strategy

        17.1.4. Agfa Healthcare

            17.1.4.1. Overview

            17.1.4.2. Product Portfolio

            17.1.4.3. Profitability by Market Segments

            17.1.4.4. Sales Footprint

            17.1.4.5. Strategy Overview

                17.1.4.5.1. Marketing Strategy

        17.1.5. MEDNAX Services, Inc.

            17.1.5.1. Overview

            17.1.5.2. Product Portfolio

            17.1.5.3. Profitability by Market Segments

            17.1.5.4. Sales Footprint

            17.1.5.5. Strategy Overview

                17.1.5.5.1. Marketing Strategy

        17.1.6. ONRAD Inc.

            17.1.6.1. Overview

            17.1.6.2. Product Portfolio

            17.1.6.3. Profitability by Market Segments

            17.1.6.4. Sales Footprint

            17.1.6.5. Strategy Overview

                17.1.6.5.1. Marketing Strategy

        17.1.7. Novarad Corporation

            17.1.7.1. Overview

            17.1.7.2. Product Portfolio

            17.1.7.3. Profitability by Market Segments

            17.1.7.4. Sales Footprint

            17.1.7.5. Strategy Overview

                17.1.7.5.1. Marketing Strategy

        17.1.8. TeleDiagnostic Solutions Pvt. Ltd.

            17.1.8.1. Overview

            17.1.8.2. Product Portfolio

            17.1.8.3. Profitability by Market Segments

            17.1.8.4. Sales Footprint

            17.1.8.5. Strategy Overview

                17.1.8.5.1. Marketing Strategy

        17.1.9. Solutions

            17.1.9.1. Overview

            17.1.9.2. Product Portfolio

            17.1.9.3. Profitability by Market Segments

            17.1.9.4. Sales Footprint

            17.1.9.5. Strategy Overview

                17.1.9.5.1. Marketing Strategy

        17.1.10. Telerad Tech

            17.1.10.1. Overview

            17.1.10.2. Product Portfolio

            17.1.10.3. Profitability by Market Segments

            17.1.10.4. Sales Footprint

            17.1.10.5. Strategy Overview

                17.1.10.5.1. Marketing Strategy

        17.1.11. StatRad LLC

            17.1.11.1. Overview

            17.1.11.2. Product Portfolio

            17.1.11.3. Profitability by Market Segments

            17.1.11.4. Sales Footprint

            17.1.11.5. Strategy Overview

                17.1.11.5.1. Marketing Strategy

        17.1.12. MedWeb LLC

            17.1.12.1. Overview

            17.1.12.2. Product Portfolio

            17.1.12.3. Profitability by Market Segments

            17.1.12.4. Sales Footprint

            17.1.12.5. Strategy Overview

                17.1.12.5.1. Marketing Strategy

        17.1.13. USARAD Holdings, Inc.

            17.1.13.1. Overview

            17.1.13.2. Product Portfolio

            17.1.13.3. Profitability by Market Segments

            17.1.13.4. Sales Footprint

            17.1.13.5. Strategy Overview

                17.1.13.5.1. Marketing Strategy

        17.1.14. Everlight Radiology

            17.1.14.1. Overview

            17.1.14.2. Product Portfolio

            17.1.14.3. Profitability by Market Segments

            17.1.14.4. Sales Footprint

            17.1.14.5. Strategy Overview

                17.1.14.5.1. Marketing Strategy

        17.1.15. SRL Diagnostics,

            17.1.15.1. Overview

            17.1.15.2. Product Portfolio

            17.1.15.3. Profitability by Market Segments

            17.1.15.4. Sales Footprint

            17.1.15.5. Strategy Overview

                17.1.15.5.1. Marketing Strategy

        17.1.16. Vital Radiology Services

            17.1.16.1. Overview

            17.1.16.2. Product Portfolio

            17.1.16.3. Profitability by Market Segments

            17.1.16.4. Sales Footprint

            17.1.16.5. Strategy Overview

                17.1.16.5.1. Marketing Strategy

        17.1.17. Telemedicine Clinic.

            17.1.17.1. Overview

            17.1.17.2. Product Portfolio

            17.1.17.3. Profitability by Market Segments

            17.1.17.4. Sales Footprint

            17.1.17.5. Strategy Overview

                17.1.17.5.1. Marketing Strategy

18. Assumptions & Acronyms Used

19. Research Methodology

Don't pay for what you don't need

Customize your report by selecting specific countries or regions and save 30%!

List of Tables

Table 1: Global Market Value (US$ Million) Forecast by Region, 2023 to 2033

Table 2: Global Market Value (US$ Million) Forecast by Modality, 2023 to 2033

Table 3: Global Market Value (US$ Million) Forecast by End User, 2023 to 2033

Table 4: North America Market Value (US$ Million) Forecast by Country, 2023 to 2033

Table 5: North America Market Value (US$ Million) Forecast by Modality, 2023 to 2033

Table 6: North America Market Value (US$ Million) Forecast by End User, 2023 to 2033

Table 7: Latin America Market Value (US$ Million) Forecast by Country, 2023 to 2033

Table 8: Latin America Market Value (US$ Million) Forecast by Modality, 2023 to 2033

Table 9: Latin America Market Value (US$ Million) Forecast by End User, 2023 to 2033

Table 10: Western Europe Market Value (US$ Million) Forecast by Country, 2023 to 2033

Table 11: Western Europe Market Value (US$ Million) Forecast by Modality, 2023 to 2033

Table 12: Western Europe Market Value (US$ Million) Forecast by End User, 2023 to 2033

Table 13: Eastern Europe Market Value (US$ Million) Forecast by Country, 2023 to 2033

Table 14: Eastern Europe Market Value (US$ Million) Forecast by Modality, 2023 to 2033

Table 15: Eastern Europe Market Value (US$ Million) Forecast by End User, 2023 to 2033

Table 16: South Asia and Pacific Market Value (US$ Million) Forecast by Country, 2023 to 2033

Table 17: South Asia and Pacific Market Value (US$ Million) Forecast by Modality, 2023 to 2033

Table 18: South Asia and Pacific Market Value (US$ Million) Forecast by End User, 2023 to 2033

Table 19: East Asia Market Value (US$ Million) Forecast by Country, 2023 to 2033

Table 20: East Asia Market Value (US$ Million) Forecast by Modality, 2023 to 2033

Table 21: East Asia Market Value (US$ Million) Forecast by End User, 2023 to 2033

Table 22: Middle East and Africa Market Value (US$ Million) Forecast by Country, 2023 to 2033

Table 23: Middle East and Africa Market Value (US$ Million) Forecast by Modality, 2023 to 2033

Table 24: Middle East and Africa Market Value (US$ Million) Forecast by End User, 2023 to 2033
Sabyasachi Ghosh
Sabyasachi Ghosh

Principal Consultant

Talk to Analyst

Find your sweet spots for generating winning opportunities in this market.

List of Charts

Figure 1: Global Market Value (US$ Million) by Modality, 2023 to 2033

Figure 2: Global Market Value (US$ Million) by End User, 2023 to 2033

Figure 3: Global Market Value (US$ Million) by Region, 2023 to 2033

Figure 4: Global Market Value (US$ Million) Analysis by Region, 2023 to 2033

Figure 5: Global Market Value Share (%) and BPS Analysis by Region, 2023 to 2033

Figure 6: Global Market Y-o-Y Growth (%) Projections by Region, 2023 to 2033

Figure 7: Global Market Value (US$ Million) Analysis by Modality, 2023 to 2033

Figure 8: Global Market Value Share (%) and BPS Analysis by Modality, 2023 to 2033

Figure 9: Global Market Y-o-Y Growth (%) Projections by Modality, 2023 to 2033

Figure 10: Global Market Value (US$ Million) Analysis by End User, 2023 to 2033

Figure 11: Global Market Value Share (%) and BPS Analysis by End User, 2023 to 2033

Figure 12: Global Market Y-o-Y Growth (%) Projections by End User, 2023 to 2033

Figure 13: Global Market Attractiveness by Modality, 2023 to 2033

Figure 14: Global Market Attractiveness by End User, 2023 to 2033

Figure 15: Global Market Attractiveness by Region, 2023 to 2033

Figure 16: North America Market Value (US$ Million) by Modality, 2023 to 2033

Figure 17: North America Market Value (US$ Million) by End User, 2023 to 2033

Figure 18: North America Market Value (US$ Million) by Country, 2023 to 2033

Figure 19: North America Market Value (US$ Million) Analysis by Country, 2023 to 2033

Figure 20: North America Market Value Share (%) and BPS Analysis by Country, 2023 to 2033

Figure 21: North America Market Y-o-Y Growth (%) Projections by Country, 2023 to 2033

Figure 22: North America Market Value (US$ Million) Analysis by Modality, 2023 to 2033

Figure 23: North America Market Value Share (%) and BPS Analysis by Modality, 2023 to 2033

Figure 24: North America Market Y-o-Y Growth (%) Projections by Modality, 2023 to 2033

Figure 25: North America Market Value (US$ Million) Analysis by End User, 2023 to 2033

Figure 26: North America Market Value Share (%) and BPS Analysis by End User, 2023 to 2033

Figure 27: North America Market Y-o-Y Growth (%) Projections by End User, 2023 to 2033

Figure 28: North America Market Attractiveness by Modality, 2023 to 2033

Figure 29: North America Market Attractiveness by End User, 2023 to 2033

Figure 30: North America Market Attractiveness by Country, 2023 to 2033

Figure 31: Latin America Market Value (US$ Million) by Modality, 2023 to 2033

Figure 32: Latin America Market Value (US$ Million) by End User, 2023 to 2033

Figure 33: Latin America Market Value (US$ Million) by Country, 2023 to 2033

Figure 34: Latin America Market Value (US$ Million) Analysis by Country, 2023 to 2033

Figure 35: Latin America Market Value Share (%) and BPS Analysis by Country, 2023 to 2033

Figure 36: Latin America Market Y-o-Y Growth (%) Projections by Country, 2023 to 2033

Figure 37: Latin America Market Value (US$ Million) Analysis by Modality, 2023 to 2033

Figure 38: Latin America Market Value Share (%) and BPS Analysis by Modality, 2023 to 2033

Figure 39: Latin America Market Y-o-Y Growth (%) Projections by Modality, 2023 to 2033

Figure 40: Latin America Market Value (US$ Million) Analysis by End User, 2023 to 2033

Figure 41: Latin America Market Value Share (%) and BPS Analysis by End User, 2023 to 2033

Figure 42: Latin America Market Y-o-Y Growth (%) Projections by End User, 2023 to 2033

Figure 43: Latin America Market Attractiveness by Modality, 2023 to 2033

Figure 44: Latin America Market Attractiveness by End User, 2023 to 2033

Figure 45: Latin America Market Attractiveness by Country, 2023 to 2033

Figure 46: Western Europe Market Value (US$ Million) by Modality, 2023 to 2033

Figure 47: Western Europe Market Value (US$ Million) by End User, 2023 to 2033

Figure 48: Western Europe Market Value (US$ Million) by Country, 2023 to 2033

Figure 49: Western Europe Market Value (US$ Million) Analysis by Country, 2023 to 2033

Figure 50: Western Europe Market Value Share (%) and BPS Analysis by Country, 2023 to 2033

Figure 51: Western Europe Market Y-o-Y Growth (%) Projections by Country, 2023 to 2033

Figure 52: Western Europe Market Value (US$ Million) Analysis by Modality, 2023 to 2033

Figure 53: Western Europe Market Value Share (%) and BPS Analysis by Modality, 2023 to 2033

Figure 54: Western Europe Market Y-o-Y Growth (%) Projections by Modality, 2023 to 2033

Figure 55: Western Europe Market Value (US$ Million) Analysis by End User, 2023 to 2033

Figure 56: Western Europe Market Value Share (%) and BPS Analysis by End User, 2023 to 2033

Figure 57: Western Europe Market Y-o-Y Growth (%) Projections by End User, 2023 to 2033

Figure 58: Western Europe Market Attractiveness by Modality, 2023 to 2033

Figure 59: Western Europe Market Attractiveness by End User, 2023 to 2033

Figure 60: Western Europe Market Attractiveness by Country, 2023 to 2033

Figure 61: Eastern Europe Market Value (US$ Million) by Modality, 2023 to 2033

Figure 62: Eastern Europe Market Value (US$ Million) by End User, 2023 to 2033

Figure 63: Eastern Europe Market Value (US$ Million) by Country, 2023 to 2033

Figure 64: Eastern Europe Market Value (US$ Million) Analysis by Country, 2023 to 2033

Figure 65: Eastern Europe Market Value Share (%) and BPS Analysis by Country, 2023 to 2033

Figure 66: Eastern Europe Market Y-o-Y Growth (%) Projections by Country, 2023 to 2033

Figure 67: Eastern Europe Market Value (US$ Million) Analysis by Modality, 2023 to 2033

Figure 68: Eastern Europe Market Value Share (%) and BPS Analysis by Modality, 2023 to 2033

Figure 69: Eastern Europe Market Y-o-Y Growth (%) Projections by Modality, 2023 to 2033

Figure 70: Eastern Europe Market Value (US$ Million) Analysis by End User, 2023 to 2033

Figure 71: Eastern Europe Market Value Share (%) and BPS Analysis by End User, 2023 to 2033

Figure 72: Eastern Europe Market Y-o-Y Growth (%) Projections by End User, 2023 to 2033

Figure 73: Eastern Europe Market Attractiveness by Modality, 2023 to 2033

Figure 74: Eastern Europe Market Attractiveness by End User, 2023 to 2033

Figure 75: Eastern Europe Market Attractiveness by Country, 2023 to 2033

Figure 76: South Asia and Pacific Market Value (US$ Million) by Modality, 2023 to 2033

Figure 77: South Asia and Pacific Market Value (US$ Million) by End User, 2023 to 2033

Figure 78: South Asia and Pacific Market Value (US$ Million) by Country, 2023 to 2033

Figure 79: South Asia and Pacific Market Value (US$ Million) Analysis by Country, 2023 to 2033

Figure 80: South Asia and Pacific Market Value Share (%) and BPS Analysis by Country, 2023 to 2033

Figure 81: South Asia and Pacific Market Y-o-Y Growth (%) Projections by Country, 2023 to 2033

Figure 82: South Asia and Pacific Market Value (US$ Million) Analysis by Modality, 2023 to 2033

Figure 83: South Asia and Pacific Market Value Share (%) and BPS Analysis by Modality, 2023 to 2033

Figure 84: South Asia and Pacific Market Y-o-Y Growth (%) Projections by Modality, 2023 to 2033

Figure 85: South Asia and Pacific Market Value (US$ Million) Analysis by End User, 2023 to 2033

Figure 86: South Asia and Pacific Market Value Share (%) and BPS Analysis by End User, 2023 to 2033

Figure 87: South Asia and Pacific Market Y-o-Y Growth (%) Projections by End User, 2023 to 2033

Figure 88: South Asia and Pacific Market Attractiveness by Modality, 2023 to 2033

Figure 89: South Asia and Pacific Market Attractiveness by End User, 2023 to 2033

Figure 90: South Asia and Pacific Market Attractiveness by Country, 2023 to 2033

Figure 91: East Asia Market Value (US$ Million) by Modality, 2023 to 2033

Figure 92: East Asia Market Value (US$ Million) by End User, 2023 to 2033

Figure 93: East Asia Market Value (US$ Million) by Country, 2023 to 2033

Figure 94: East Asia Market Value (US$ Million) Analysis by Country, 2023 to 2033

Figure 95: East Asia Market Value Share (%) and BPS Analysis by Country, 2023 to 2033

Figure 96: East Asia Market Y-o-Y Growth (%) Projections by Country, 2023 to 2033

Figure 97: East Asia Market Value (US$ Million) Analysis by Modality, 2023 to 2033

Figure 98: East Asia Market Value Share (%) and BPS Analysis by Modality, 2023 to 2033

Figure 99: East Asia Market Y-o-Y Growth (%) Projections by Modality, 2023 to 2033

Figure 100: East Asia Market Value (US$ Million) Analysis by End User, 2023 to 2033

Figure 101: East Asia Market Value Share (%) and BPS Analysis by End User, 2023 to 2033

Figure 102: East Asia Market Y-o-Y Growth (%) Projections by End User, 2023 to 2033

Figure 103: East Asia Market Attractiveness by Modality, 2023 to 2033

Figure 104: East Asia Market Attractiveness by End User, 2023 to 2033

Figure 105: East Asia Market Attractiveness by Country, 2023 to 2033

Figure 106: Middle East and Africa Market Value (US$ Million) by Modality, 2023 to 2033

Figure 107: Middle East and Africa Market Value (US$ Million) by End User, 2023 to 2033

Figure 108: Middle East and Africa Market Value (US$ Million) by Country, 2023 to 2033

Figure 109: Middle East and Africa Market Value (US$ Million) Analysis by Country, 2023 to 2033

Figure 110: Middle East and Africa Market Value Share (%) and BPS Analysis by Country, 2023 to 2033

Figure 111: Middle East and Africa Market Y-o-Y Growth (%) Projections by Country, 2023 to 2033

Figure 112: Middle East and Africa Market Value (US$ Million) Analysis by Modality, 2023 to 2033

Figure 113: Middle East and Africa Market Value Share (%) and BPS Analysis by Modality, 2023 to 2033

Figure 114: Middle East and Africa Market Y-o-Y Growth (%) Projections by Modality, 2023 to 2033

Figure 115: Middle East and Africa Market Value (US$ Million) Analysis by End User, 2023 to 2033

Figure 116: Middle East and Africa Market Value Share (%) and BPS Analysis by End User, 2023 to 2033

Figure 117: Middle East and Africa Market Y-o-Y Growth (%) Projections by End User, 2023 to 2033

Figure 118: Middle East and Africa Market Attractiveness by Modality, 2023 to 2033

Figure 119: Middle East and Africa Market Attractiveness by End User, 2023 to 2033

Figure 120: Middle East and Africa Market Attractiveness by Country, 2023 to 2033

Recommendations

Healthcare

Teleradiology Service Market

Published : October 2023

Healthcare

Radiology Information System RIS Market

Published : October 2022

Explore Healthcare Insights

View Reports