Reports

- Global Locations -

Headquarters

Future Market Insights, Inc.

Christiana Corporate, 200
Continental Drive, Suite 401,
Newark, Delaware - 19713,
United States

T: +1-845-579-5705

Americas

Future Market Insights, Inc.

616 Corporate Way, Suite 2-9018,
Valley Cottage, NY 10989, United States

T: +1-347-918-3531

MEA

Future Market Insights

1602-6 Jumeirah Bay X2 Tower, Plot No: JLT-PH2-X2A,
Jumeirah Lakes Towers, Dubai,
United Arab Emirates

Europe

Future Market Insights

3rd Floor, 207 Regent Street,
W1B 3HH London
United Kingdom

T: + 44 (0) 20 8123 9659
D: +44 (0) 20 3287 4268

Asia Pacific

Future Market Insights

IndiaLand Global Tech Park, Unit UG-1, Behind Grand HighStreet, Phase 1, Hinjawadi, MH, Pune – 411057, India

Telehealth Kiosk Market Outlook for 2024 to 2034

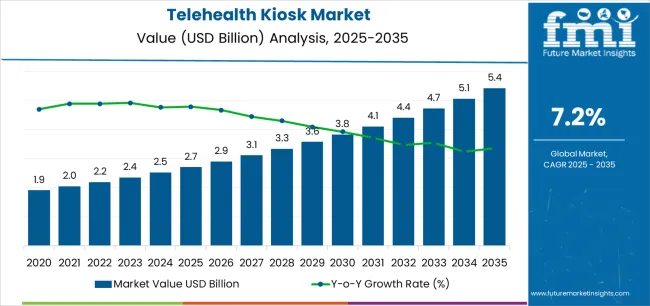
The telehealth kiosk market is valued at US$ 2,060.50 million in 2024 and is expected to rise at a stable CAGR of around 7.20% over the forecast period. The industry is witnessing a rise due to the integration of IoT-enabled vital sign monitoring, AI and virtual assistants, and personal health records (PHR) integration.

Attributes Details
Telehealth Kiosk Market Value for 2024 US$ 2,525 million
Telehealth Kiosk Market Value for 2034 US$ 4,129.80 million
Telehealth Kiosk Market Forecast CAGR for 2024 to 2034 7.20%

The industry is expanding as AI-enabled kiosks gain traction in the healthcare sector. Health ATMs can help hospitals cut costs. This factor calls for a wider adoption rate of telehealth kiosks during the forecast period. As a result, the industry is anticipated to cross a valuation of US$ 4,129.80 million through 2034.

Don't pay for what you don't need

Customize your report by selecting specific countries or regions and save 30%!

Report Highlights

  • Telehealth kiosks enable medical attendants to devote more effort to understanding considerations and spend less time on office tasks. Thus, the adoption of the well-being booth is likely to support market growth.
  • Health ATMs or self-service kiosks are now being used in hospitals to cut costs of paperwork for patient information as well as self-check-in. These can be viewed as health kiosks because they have the potential of enhancing the market.
  • Telemedicine kiosks can rearrange office work into direct care of patients. As a result, the use of health kiosks is likely to boost the market's progress.
  • Patients using telehealth booths are likely to visit the trauma center less often. As a result, the industry is expected to gain traction as the use of medical kiosks grows significantly

Telehealth Kiosk Market Trends

Integration with Cloud-based Services

Telehealth kiosks connected to cloud-based services that provide essential patient storage are on the rise within the healthcare industry. This usefulness is coordinated with pharmacies that respond quickly, in compliance with legitimate prescriptions, and with suitable payment options for the necessary pharmaceuticals. The knowledge acquired from such sophisticated functionality has enhanced patient-doctor engagement, improved hospital administration, and offered emerging market enterprises a quick and cost-effective option in the telehealth kiosk sector.

Digital Transformation in Healthcare

The increase in digitalization across healthcare businesses significantly impacts the market growth rate. Also, the adoption of 5G in hospital kiosks that will benefit from faster speed and payment efficiency. This is contributing to the increase in the demand for telehealth kiosks in addition to the increasing number of payment kiosks in healthcare industry. Moreover, it is expected that a rising biometrics and face recognition technologies integrated hospital kiosk are likely to support market expansion.

Sabyasachi Ghosh
Sabyasachi Ghosh

Principal Consultant

Talk to Analyst

Find your sweet spots for generating winning opportunities in this market.

Comparative View of the Adjacent Telehealth Kiosk Market

This section provides a comparative view of the telehealth kiosk industry, the telehealth and telemedicine market, and the telemedicine equipment market.

Telehealth Kiosk Market:

Attributes Telehealth Kiosk Market
CAGR (2024 to 2034) 7.20%
Opportunity Expanding access to care in underserved areas through cost-effective telehealth kiosk deployments
Key Trends Integration of AI-powered symptom checkers and personalized health recommendations in telehealth kiosks

Telehealth and Telemedicine Market:

Attributes Telehealth and Telemedicine Market
CAGR (2024 to 2034) 24%
Opportunity Growth in chronic disease management and remote patient monitoring using telemedicine technologies
Key Trends Integration of wearables and remote monitoring devices with telehealth platforms for real-time patient data collection

Telemedicine Equipment Market:

Attributes Telemedicine Equipment Market
CAGR (2024 to 2034) 15.6%
Opportunity Development of portable and user-friendly telemedicine equipment for convenient remote consultations
Key Trends Increased adoption of artificial intelligence (AI) for automating tasks and improving diagnostic accuracy in telemedicine equipment

Analysis by Segments

This section provides detailed insights into specific segments in the telehealth kiosk industry.

Telehealth Kios System Segment Leads the Telehealth Kiosk Industry in 2024

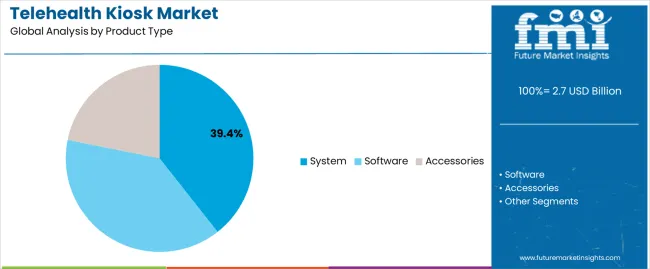
By Product Type System
Market Share in 2024 67.50%

In 2024, telehealth kiosk systems are likely to hold 67.50% of the market share.

  • Telehealth kiosk systems are made up of many components such as vital sign monitors, video conferencing technology, and patient data storage which altogether constitute one solution for distance consultations and health diagnoses.
  • This system may be customized by healthcare facilities’ different needs thus ensuring easy integration with existing workflows.
  • Telehealth kiosk systems feature user-friendly interfaces that enable patients to go through consultations or access health information on their own.
    Major providers of such telehealth kiosks strongly emphasize robust encryption measures and security protocols to provide a safe haven for patient details.

Teleconsultation Segment Predicted to Dominate the Industry in 2024

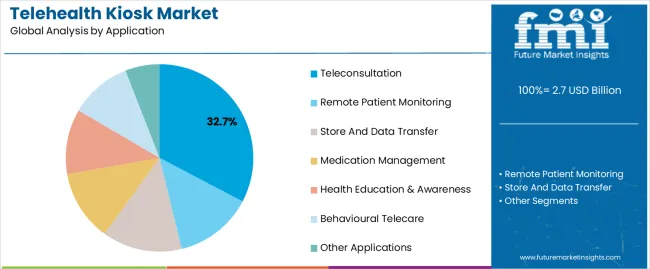
Leading Application Segment Teleconsultation
Market Share in 2024 29.80%

In 2024, teleconsultation leads among application segments in the telehealth kiosk industry with a significant share of 29.80%.

  • The demand for convenient healthcare has led to a situation where many patients are turning to telehealth kiosks in order to have consultations over the phone hence saving time and space while at it.
  • In places where doctors’ offices are not available or far away, rural residents can visit telehealth kiosks which will allow them having remote consultation with medical practitioners.
  • Therefore these types of services are suitable for telemonitoring chronic diseases and prescription refill after prescriptions completion through teleconsultations.
  • Besides, supportive government regulations and insurance coverage for various types of telemedicine services drive the adoption of tele-consultations via health kiosks.

Get the data you need at a Fraction of the cost

Personalize your report by choosing insights you need
and save 40%!

Analysis by Country

The section analyzes the telehealth kiosk market across key countries, including the United States, United Kingdom, China, Japan, and South Korea. The analysis delves into the specific factors driving the demand for telehealth kiosks in these countries.

Countries CAGR
United States 3.40%
United Kingdom 4.50%
China 4.80%
Japan 2.20%
South Korea 4.50%

United States

The United States market is anticipated to grow at a rate of 3.40% by 2034. Due to the large population in the United States, there is a high demand for healthcare services. In some places, there are not enough healthcare workers; therefore, another way is necessary. Telehealth kiosks come fully packed with technology that enables easy access by all types of patients through secure means of communication thus popularizing them among patients worldwide. Increased insurance coverage has lead to growth in the use of telehealth kiosks.

United Kingdom Telehealth Kiosk Industry

The telehealth kiosk market in the UK has been projected to grow at a CAGR of 4.50% through 2034. The United Kingdom faces problems with regard to access to doctors in some areas, similar to the United States health system.

Telehealth kiosks represent an enticing answer by providing remote consultations. It is worth noting that the UK government actively advocates for programs developed to improve accessibility and other stages of adoption of telehealth technologies, including telehealth kiosks.

China’s Telehealth Kiosk Industry

China’s telehealth kiosk market has seen stable expansion, and it is expected to continue this trend with a CAGR of 4.8% towards 2034. There are growing medical needs since China has a huge population which continues to grow at a steady pace. The government supports offering these kinds of services via technology because it knows it can solve such problems. As a result, telehealth kiosks can be introduced as an intervention that bridges all gaps present in accessing healthcare especially in remote areas of China.

Telehealth Kiosk Industry in Japan

In Japan, the growth of the telehealth kiosk market is projected to be at a 2.20% CAGR through 2034, showing a mature healthcare system with an established health infrastructure. Still, there is a potential for growth as they merge with existing services.

Telehealth kiosks could provide remote monitoring that can be very useful in managing chronic conditions in Japan, which has a rapidly aging population. The healthcare sector of Japan is open to new technologies and innovations; hence, it can widely accept telehealth kiosks.

Telehealth Kiosk Industry in South Korea

South Korea's telehealth kiosk market is projected to expand by a CAGR of 4.50% through 2034. This growth has led the South Korean government to consider telehealth initiatives that would enhance telehealth kiosk performance.

South Korea, just like Japan, has an aging population that requires remote healthcare monitoring and consultations provided by these centers. As technology advances, South Korea leads in innovation, and this sets a good stage for deploying the use of telehealth kiosks as technology matures and user experience improves.
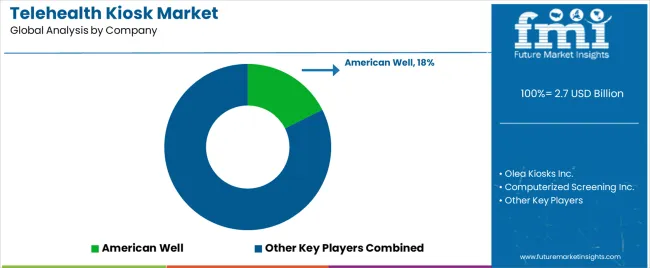
Competition Outlook of the Telehealth Kiosk Industry

A conflict is building up between traditional healthcare providers and telehealth firms that concentrate on that service. Telehealth kiosks may be viewed by established hospitals and clinics as potentially dangerous in the sense of losing patients. On the other hand, some might consider this by coming up with their own telehealth kiosk solutions or teaming up with already existing telehealth companies.

In contrast, this is seen as an opportunity for exclusive telehealth firms to extend their services beyond conventional medical centers and provide convenient healthcare. This rivalry is consequently positive for patients since it brings about new ideas in terms of innovation that could also lower service costs due to market pressure.

Established players and telehealth-focused companies are looking into fostering partnerships and acknowledging the significance of a holistic healthcare journey. Case in point, these alliances can come about through brand sharing so that one partner can benefit from another’s reputation, thus attracting more clients. Moreover, ensuring technology integration facilitates smooth data transfer between hospital or clinic IT systems and telehealth kiosks.

Recent Developments in the Telehealth Kiosk Industry

  • Fullerton Health, a supplier of business healthcare solutions, introduced a telemedicine kiosk in September 2021 to assist migrant workers in Singapore.
  • Docty opened 100 digital healthcare kiosks in India in March 2022 under the name 'Gali Gali Me Digital Clinic.' This initiative is designed to assist patients in receiving timely consultations, prescriptions, electronic medical records (EMR), pharmacy, and lab services at a reduced cost across more than 28 specialties.
  • Lord's Mark Industries joins the Medtech space with distribution agreements and the launch of Medical Kiosks in January 2022 to improve public healthcare infrastructure.

Leading Players in the Telehealth Kiosk Sector

  • American Well
  • Olea Kiosks Inc.
  • Computerized Screening Inc.
  • H & S Quality in Software SpA
  • AMD Global Telemedicine, Inc.
  • InTouch Health
  • Computerized Screening Inc.
  • ZIVELO Inc.

Key Coverage in the Telehealth Kiosk Industry Report

  • Market Analysis of Telemedicine
  • Telehealth & Telemedicine Industry Forecast
  • Demand Analysis of Telehealth Kiosk
  • Digital Health Market Outlook
  • Sales Outlook of Telemedicine Equipment

Key Segments

By Product Type:

  • System
    • Outdoor Kiosks
    • Indoor Kiosks
  • Software
  • Accessories

By Application:

  • Teleconsultation
  • Remote Patient Monitoring
  • Store and Data Transfer
  • Medication Management
  • Health Education & Awareness
  • Behavioural Telecare
  • Other Applications

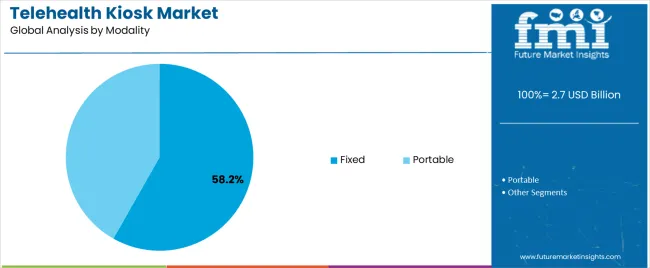
By Modality:

  • Portable
  • Fixed

By End User:

  • Hospital Settings
  • Clinic Settings
  • Office Premises
  • Retail Outlets
  • Supermarkets/Hypermarkets
  • Community Centres
  • Other End Users

By Region:

  • North America
  • Latin America
  • Europe
  • East Asia
  • South Asia
  • Oceania
  • Middle East and Africa

Frequently Asked Questions

What is the Market Potential for Telehealth Kiosk?

The telehealth kiosk market is projected to expand at a CAGR of 7.20% by 2034.

Which Application Segment Dominates the Telehealth Kiosk Market?

The teleconsultation segment is anticipated to lead the industry.

Which Telehealth Kiosk Firms Are Major?

Some major telehealth kiosk companies include American Well, Olea Kiosks Inc., and Computerized Screening Inc.

What is the Outlook for Telehealth Kiosk’s Market Growth in 2034?

The market for telehealth kiosks is projected to exceed U$ 4129.80 million by 2034.

What influences the Demand for Telehealth Kiosk?

Increasing demand for telehealth kiosks is attributed to the increasing need for accessible, affordable, and convenient healthcare solutions.

Table of Content

1. Executive Summary

    1.1. Global Market Outlook

    1.2. Demand-side Trends

    1.3. Supply-side Trends

    1.4. Technology Roadmap Analysis

    1.5. Analysis and Recommendations

2. Market Overview

    2.1. Market Coverage / Taxonomy

    2.2. Market Definition / Scope / Limitations

3. Market Background

    3.1. Market Dynamics

        3.1.1. Drivers

        3.1.2. Restraints

        3.1.3. Opportunity

        3.1.4. Trends

    3.2. Scenario Forecast

        3.2.1. Demand in Optimistic Scenario

        3.2.2. Demand in Likely Scenario

        3.2.3. Demand in Conservative Scenario

    3.3. Opportunity Map Analysis

    3.4. Investment Feasibility Matrix

    3.5. PESTLE and Porter’s Analysis

    3.6. Regulatory Landscape

        3.6.1. By Key Regions

        3.6.2. By Key Countries

    3.7. Regional Parent Market Outlook

4. Global Market Analysis 2019 to 2023 and Forecast, 2024 to 2034

    4.1. Historical Market Size Value (US$ Million) Analysis, 2019 to 2023

    4.2. Current and Future Market Size Value (US$ Million) Projections, 2024 to 2034

        4.2.1. Y-o-Y Growth Trend Analysis

        4.2.2. Absolute $ Opportunity Analysis

5. Global Market Analysis 2019 to 2023 and Forecast 2024 to 2034, By Type

    5.1. Introduction / Key Findings

    5.2. Historical Market Size Value (US$ Million) Analysis By Type, 2019 to 2023

    5.3. Current and Future Market Size Value (US$ Million) Analysis and Forecast By Type, 2024 to 2034

        5.3.1. Vital Signs Monitoring

        5.3.2. Teleconsultation

        5.3.3. Digital Pharmacy

        5.3.4. Others

    5.4. Y-o-Y Growth Trend Analysis By Type, 2019 to 2023

    5.5. Absolute $ Opportunity Analysis By Type, 2024 to 2034

6. Global Market Analysis 2019 to 2023 and Forecast 2024 to 2034, By Application

    6.1. Introduction / Key Findings

    6.2. Historical Market Size Value (US$ Million) Analysis By Application, 2019 to 2023

    6.3. Current and Future Market Size Value (US$ Million) Analysis and Forecast By Application, 2024 to 2034

        6.3.1. Hospitals

        6.3.2. Community Clinics

        6.3.3. Pharmacies

    6.4. Y-o-Y Growth Trend Analysis By Application, 2019 to 2023

    6.5. Absolute $ Opportunity Analysis By Application, 2024 to 2034

7. Global Market Analysis 2019 to 2023 and Forecast 2024 to 2034, By Region

    7.1. Introduction

    7.2. Historical Market Size Value (US$ Million) Analysis By Region, 2019 to 2023

    7.3. Current Market Size Value (US$ Million) Analysis and Forecast By Region, 2024 to 2034

        7.3.1. North America

        7.3.2. Latin America

        7.3.3. Western Europe

        7.3.4. Eastern Europe

        7.3.5. South Asia and Pacific

        7.3.6. East Asia

        7.3.7. Middle East and Africa

    7.4. Market Attractiveness Analysis By Region

8. North America Market Analysis 2019 to 2023 and Forecast 2024 to 2034, By Country

    8.1. Historical Market Size Value (US$ Million) Trend Analysis By Market Taxonomy, 2019 to 2023

    8.2. Market Size Value (US$ Million) Forecast By Market Taxonomy, 2024 to 2034

        8.2.1. By Country

            8.2.1.1. USA

            8.2.1.2. Canada

        8.2.2. By Type

        8.2.3. By Application

    8.3. Market Attractiveness Analysis

        8.3.1. By Country

        8.3.2. By Type

        8.3.3. By Application

    8.4. Key Takeaways

9. Latin America Market Analysis 2019 to 2023 and Forecast 2024 to 2034, By Country

    9.1. Historical Market Size Value (US$ Million) Trend Analysis By Market Taxonomy, 2019 to 2023

    9.2. Market Size Value (US$ Million) Forecast By Market Taxonomy, 2024 to 2034

        9.2.1. By Country

            9.2.1.1. Brazil

            9.2.1.2. Mexico

            9.2.1.3. Rest of Latin America

        9.2.2. By Type

        9.2.3. By Application

    9.3. Market Attractiveness Analysis

        9.3.1. By Country

        9.3.2. By Type

        9.3.3. By Application

    9.4. Key Takeaways

10. Western Europe Market Analysis 2019 to 2023 and Forecast 2024 to 2034, By Country

    10.1. Historical Market Size Value (US$ Million) Trend Analysis By Market Taxonomy, 2019 to 2023

    10.2. Market Size Value (US$ Million) Forecast By Market Taxonomy, 2024 to 2034

        10.2.1. By Country

            10.2.1.1. Germany

            10.2.1.2. UK

            10.2.1.3. France

            10.2.1.4. Spain

            10.2.1.5. Italy

            10.2.1.6. Rest of Western Europe

        10.2.2. By Type

        10.2.3. By Application

    10.3. Market Attractiveness Analysis

        10.3.1. By Country

        10.3.2. By Type

        10.3.3. By Application

    10.4. Key Takeaways

11. Eastern Europe Market Analysis 2019 to 2023 and Forecast 2024 to 2034, By Country

    11.1. Historical Market Size Value (US$ Million) Trend Analysis By Market Taxonomy, 2019 to 2023

    11.2. Market Size Value (US$ Million) Forecast By Market Taxonomy, 2024 to 2034

        11.2.1. By Country

            11.2.1.1. Poland

            11.2.1.2. Russia

            11.2.1.3. Czech Republic

            11.2.1.4. Romania

            11.2.1.5. Rest of Eastern Europe

        11.2.2. By Type

        11.2.3. By Application

    11.3. Market Attractiveness Analysis

        11.3.1. By Country

        11.3.2. By Type

        11.3.3. By Application

    11.4. Key Takeaways

12. South Asia and Pacific Market Analysis 2019 to 2023 and Forecast 2024 to 2034, By Country

    12.1. Historical Market Size Value (US$ Million) Trend Analysis By Market Taxonomy, 2019 to 2023

    12.2. Market Size Value (US$ Million) Forecast By Market Taxonomy, 2024 to 2034

        12.2.1. By Country

            12.2.1.1. India

            12.2.1.2. Bangladesh

            12.2.1.3. Australia

            12.2.1.4. New Zealand

            12.2.1.5. Rest of South Asia and Pacific

        12.2.2. By Type

        12.2.3. By Application

    12.3. Market Attractiveness Analysis

        12.3.1. By Country

        12.3.2. By Type

        12.3.3. By Application

    12.4. Key Takeaways

13. East Asia Market Analysis 2019 to 2023 and Forecast 2024 to 2034, By Country

    13.1. Historical Market Size Value (US$ Million) Trend Analysis By Market Taxonomy, 2019 to 2023

    13.2. Market Size Value (US$ Million) Forecast By Market Taxonomy, 2024 to 2034

        13.2.1. By Country

            13.2.1.1. China

            13.2.1.2. Japan

            13.2.1.3. South Korea

        13.2.2. By Type

        13.2.3. By Application

    13.3. Market Attractiveness Analysis

        13.3.1. By Country

        13.3.2. By Type

        13.3.3. By Application

    13.4. Key Takeaways

14. Middle East and Africa Market Analysis 2019 to 2023 and Forecast 2024 to 2034, By Country

    14.1. Historical Market Size Value (US$ Million) Trend Analysis By Market Taxonomy, 2019 to 2023

    14.2. Market Size Value (US$ Million) Forecast By Market Taxonomy, 2024 to 2034

        14.2.1. By Country

            14.2.1.1. GCC Countries

            14.2.1.2. South Africa

            14.2.1.3. Israel

            14.2.1.4. Rest of MEA

        14.2.2. By Type

        14.2.3. By Application

    14.3. Market Attractiveness Analysis

        14.3.1. By Country

        14.3.2. By Type

        14.3.3. By Application

    14.4. Key Takeaways

15. Key Countries Market Analysis

    15.1. USA

        15.1.1. Market Share Analysis, 2023

            15.1.1.1. By Type

            15.1.1.2. By Application

    15.2. Canada

        15.2.1. Market Share Analysis, 2023

            15.2.1.1. By Type

            15.2.1.2. By Application

    15.3. Brazil

        15.3.1. Market Share Analysis, 2023

            15.3.1.1. By Type

            15.3.1.2. By Application

    15.4. Mexico

        15.4.1. Market Share Analysis, 2023

            15.4.1.1. By Type

            15.4.1.2. By Application

    15.5. Germany

        15.5.1. Market Share Analysis, 2023

            15.5.1.1. By Type

            15.5.1.2. By Application

    15.6. UK

        15.6.1. Market Share Analysis, 2023

            15.6.1.1. By Type

            15.6.1.2. By Application

    15.7. France

        15.7.1. Market Share Analysis, 2023

            15.7.1.1. By Type

            15.7.1.2. By Application

    15.8. Spain

        15.8.1. Market Share Analysis, 2023

            15.8.1.1. By Type

            15.8.1.2. By Application

    15.9. Italy

        15.9.1. Market Share Analysis, 2023

            15.9.1.1. By Type

            15.9.1.2. By Application

    15.10. Poland

        15.10.1. Market Share Analysis, 2023

            15.10.1.1. By Type

            15.10.1.2. By Application

    15.11. Russia

        15.11.1. Market Share Analysis, 2023

            15.11.1.1. By Type

            15.11.1.2. By Application

    15.12. Czech Republic

        15.12.1. Market Share Analysis, 2023

            15.12.1.1. By Type

            15.12.1.2. By Application

    15.13. Romania

        15.13.1. Market Share Analysis, 2023

            15.13.1.1. By Type

            15.13.1.2. By Application

    15.14. India

        15.14.1. Market Share Analysis, 2023

            15.14.1.1. By Type

            15.14.1.2. By Application

    15.15. Bangladesh

        15.15.1. Market Share Analysis, 2023

            15.15.1.1. By Type

            15.15.1.2. By Application

    15.16. Australia

        15.16.1. Market Share Analysis, 2023

            15.16.1.1. By Type

            15.16.1.2. By Application

    15.17. New Zealand

        15.17.1. Market Share Analysis, 2023

            15.17.1.1. By Type

            15.17.1.2. By Application

    15.18. China

        15.18.1. Market Share Analysis, 2023

            15.18.1.1. By Type

            15.18.1.2. By Application

    15.19. Japan

        15.19.1. Market Share Analysis, 2023

            15.19.1.1. By Type

            15.19.1.2. By Application

    15.20. South Korea

        15.20.1. Market Share Analysis, 2023

            15.20.1.1. By Type

            15.20.1.2. By Application

    15.21. GCC Countries

        15.21.1. Market Share Analysis, 2023

            15.21.1.1. By Type

            15.21.1.2. By Application

    15.22. South Africa

        15.22.1. Market Share Analysis, 2023

            15.22.1.1. By Type

            15.22.1.2. By Application

    15.23. Israel

        15.23.1. Market Share Analysis, 2023

            15.23.1.1. By Type

            15.23.1.2. By Application

16. Market Structure Analysis

    16.1. Competition Dashboard

    16.2. Competition Benchmarking

    16.3. Market Share Analysis of Top Players

        16.3.1. By Regional

        16.3.2. By Type

        16.3.3. By Application

17. Competition Analysis

    17.1. Competition Deep Dive

        17.1.1. American Well

            17.1.1.1. Overview

            17.1.1.2. Product Portfolio

            17.1.1.3. Profitability by Market Segments

            17.1.1.4. Sales Footprint

            17.1.1.5. Strategy Overview

                17.1.1.5.1. Marketing Strategy

        17.1.2. Olea Kiosks Inc.

            17.1.2.1. Overview

            17.1.2.2. Product Portfolio

            17.1.2.3. Profitability by Market Segments

            17.1.2.4. Sales Footprint

            17.1.2.5. Strategy Overview

                17.1.2.5.1. Marketing Strategy

        17.1.3. Computerized Screening Inc.

            17.1.3.1. Overview

            17.1.3.2. Product Portfolio

            17.1.3.3. Profitability by Market Segments

            17.1.3.4. Sales Footprint

            17.1.3.5. Strategy Overview

                17.1.3.5.1. Marketing Strategy

        17.1.4. H & S Quality in Software SpA

            17.1.4.1. Overview

            17.1.4.2. Product Portfolio

            17.1.4.3. Profitability by Market Segments

            17.1.4.4. Sales Footprint

            17.1.4.5. Strategy Overview

                17.1.4.5.1. Marketing Strategy

        17.1.5. AMD Global Telemedicine, Inc.

            17.1.5.1. Overview

            17.1.5.2. Product Portfolio

            17.1.5.3. Profitability by Market Segments

            17.1.5.4. Sales Footprint

            17.1.5.5. Strategy Overview

                17.1.5.5.1. Marketing Strategy

        17.1.6. InTouch Health

            17.1.6.1. Overview

            17.1.6.2. Product Portfolio

            17.1.6.3. Profitability by Market Segments

            17.1.6.4. Sales Footprint

            17.1.6.5. Strategy Overview

                17.1.6.5.1. Marketing Strategy

        17.1.7. ZIVELO Inc

            17.1.7.1. Overview

            17.1.7.2. Product Portfolio

            17.1.7.3. Profitability by Market Segments

            17.1.7.4. Sales Footprint

            17.1.7.5. Strategy Overview

                17.1.7.5.1. Marketing Strategy

        17.1.8. CSI Health

            17.1.8.1. Overview

            17.1.8.2. Product Portfolio

            17.1.8.3. Profitability by Market Segments

            17.1.8.4. Sales Footprint

            17.1.8.5. Strategy Overview

                17.1.8.5.1. Marketing Strategy

        17.1.9. iDoctorCloud

            17.1.9.1. Overview

            17.1.9.2. Product Portfolio

            17.1.9.3. Profitability by Market Segments

            17.1.9.4. Sales Footprint

            17.1.9.5. Strategy Overview

                17.1.9.5.1. Marketing Strategy

        17.1.10. Sonka Medical Technology

            17.1.10.1. Overview

            17.1.10.2. Product Portfolio

            17.1.10.3. Profitability by Market Segments

            17.1.10.4. Sales Footprint

            17.1.10.5. Strategy Overview

                17.1.10.5.1. Marketing Strategy

18. Assumptions & Acronyms Used

19. Research Methodology

Don't pay for what you don't need

Customize your report by selecting specific countries or regions and save 30%!

List of Tables

Table 1: Global Market Value (US$ Million) Forecast by Region, 2019 to 2034

Table 2: Global Market Value (US$ Million) Forecast by Type, 2019 to 2034

Table 3: Global Market Value (US$ Million) Forecast by Application, 2019 to 2034

Table 4: North America Market Value (US$ Million) Forecast by Country, 2019 to 2034

Table 5: North America Market Value (US$ Million) Forecast by Type, 2019 to 2034

Table 6: North America Market Value (US$ Million) Forecast by Application, 2019 to 2034

Table 7: Latin America Market Value (US$ Million) Forecast by Country, 2019 to 2034

Table 8: Latin America Market Value (US$ Million) Forecast by Type, 2019 to 2034

Table 9: Latin America Market Value (US$ Million) Forecast by Application, 2019 to 2034

Table 10: Western Europe Market Value (US$ Million) Forecast by Country, 2019 to 2034

Table 11: Western Europe Market Value (US$ Million) Forecast by Type, 2019 to 2034

Table 12: Western Europe Market Value (US$ Million) Forecast by Application, 2019 to 2034

Table 13: Eastern Europe Market Value (US$ Million) Forecast by Country, 2019 to 2034

Table 14: Eastern Europe Market Value (US$ Million) Forecast by Type, 2019 to 2034

Table 15: Eastern Europe Market Value (US$ Million) Forecast by Application, 2019 to 2034

Table 16: South Asia and Pacific Market Value (US$ Million) Forecast by Country, 2019 to 2034

Table 17: South Asia and Pacific Market Value (US$ Million) Forecast by Type, 2019 to 2034

Table 18: South Asia and Pacific Market Value (US$ Million) Forecast by Application, 2019 to 2034

Table 19: East Asia Market Value (US$ Million) Forecast by Country, 2019 to 2034

Table 20: East Asia Market Value (US$ Million) Forecast by Type, 2019 to 2034

Table 21: East Asia Market Value (US$ Million) Forecast by Application, 2019 to 2034

Table 22: Middle East and Africa Market Value (US$ Million) Forecast by Country, 2019 to 2034

Table 23: Middle East and Africa Market Value (US$ Million) Forecast by Type, 2019 to 2034

Table 24: Middle East and Africa Market Value (US$ Million) Forecast by Application, 2019 to 2034
Sabyasachi Ghosh
Sabyasachi Ghosh

Principal Consultant

Talk to Analyst

Find your sweet spots for generating winning opportunities in this market.

List of Charts

Figure 1: Global Market Value (US$ Million) by Type, 2024 to 2034

Figure 2: Global Market Value (US$ Million) by Application, 2024 to 2034

Figure 3: Global Market Value (US$ Million) by Region, 2024 to 2034

Figure 4: Global Market Value (US$ Million) Analysis by Region, 2019 to 2034

Figure 5: Global Market Value Share (%) and BPS Analysis by Region, 2024 to 2034

Figure 6: Global Market Y-o-Y Growth (%) Projections by Region, 2024 to 2034

Figure 7: Global Market Value (US$ Million) Analysis by Type, 2019 to 2034

Figure 8: Global Market Value Share (%) and BPS Analysis by Type, 2024 to 2034

Figure 9: Global Market Y-o-Y Growth (%) Projections by Type, 2024 to 2034

Figure 10: Global Market Value (US$ Million) Analysis by Application, 2019 to 2034

Figure 11: Global Market Value Share (%) and BPS Analysis by Application, 2024 to 2034

Figure 12: Global Market Y-o-Y Growth (%) Projections by Application, 2024 to 2034

Figure 13: Global Market Attractiveness by Type, 2024 to 2034

Figure 14: Global Market Attractiveness by Application, 2024 to 2034

Figure 15: Global Market Attractiveness by Region, 2024 to 2034

Figure 16: North America Market Value (US$ Million) by Type, 2024 to 2034

Figure 17: North America Market Value (US$ Million) by Application, 2024 to 2034

Figure 18: North America Market Value (US$ Million) by Country, 2024 to 2034

Figure 19: North America Market Value (US$ Million) Analysis by Country, 2019 to 2034

Figure 20: North America Market Value Share (%) and BPS Analysis by Country, 2024 to 2034

Figure 21: North America Market Y-o-Y Growth (%) Projections by Country, 2024 to 2034

Figure 22: North America Market Value (US$ Million) Analysis by Type, 2019 to 2034

Figure 23: North America Market Value Share (%) and BPS Analysis by Type, 2024 to 2034

Figure 24: North America Market Y-o-Y Growth (%) Projections by Type, 2024 to 2034

Figure 25: North America Market Value (US$ Million) Analysis by Application, 2019 to 2034

Figure 26: North America Market Value Share (%) and BPS Analysis by Application, 2024 to 2034

Figure 27: North America Market Y-o-Y Growth (%) Projections by Application, 2024 to 2034

Figure 28: North America Market Attractiveness by Type, 2024 to 2034

Figure 29: North America Market Attractiveness by Application, 2024 to 2034

Figure 30: North America Market Attractiveness by Country, 2024 to 2034

Figure 31: Latin America Market Value (US$ Million) by Type, 2024 to 2034

Figure 32: Latin America Market Value (US$ Million) by Application, 2024 to 2034

Figure 33: Latin America Market Value (US$ Million) by Country, 2024 to 2034

Figure 34: Latin America Market Value (US$ Million) Analysis by Country, 2019 to 2034

Figure 35: Latin America Market Value Share (%) and BPS Analysis by Country, 2024 to 2034

Figure 36: Latin America Market Y-o-Y Growth (%) Projections by Country, 2024 to 2034

Figure 37: Latin America Market Value (US$ Million) Analysis by Type, 2019 to 2034

Figure 38: Latin America Market Value Share (%) and BPS Analysis by Type, 2024 to 2034

Figure 39: Latin America Market Y-o-Y Growth (%) Projections by Type, 2024 to 2034

Figure 40: Latin America Market Value (US$ Million) Analysis by Application, 2019 to 2034

Figure 41: Latin America Market Value Share (%) and BPS Analysis by Application, 2024 to 2034

Figure 42: Latin America Market Y-o-Y Growth (%) Projections by Application, 2024 to 2034

Figure 43: Latin America Market Attractiveness by Type, 2024 to 2034

Figure 44: Latin America Market Attractiveness by Application, 2024 to 2034

Figure 45: Latin America Market Attractiveness by Country, 2024 to 2034

Figure 46: Western Europe Market Value (US$ Million) by Type, 2024 to 2034

Figure 47: Western Europe Market Value (US$ Million) by Application, 2024 to 2034

Figure 48: Western Europe Market Value (US$ Million) by Country, 2024 to 2034

Figure 49: Western Europe Market Value (US$ Million) Analysis by Country, 2019 to 2034

Figure 50: Western Europe Market Value Share (%) and BPS Analysis by Country, 2024 to 2034

Figure 51: Western Europe Market Y-o-Y Growth (%) Projections by Country, 2024 to 2034

Figure 52: Western Europe Market Value (US$ Million) Analysis by Type, 2019 to 2034

Figure 53: Western Europe Market Value Share (%) and BPS Analysis by Type, 2024 to 2034

Figure 54: Western Europe Market Y-o-Y Growth (%) Projections by Type, 2024 to 2034

Figure 55: Western Europe Market Value (US$ Million) Analysis by Application, 2019 to 2034

Figure 56: Western Europe Market Value Share (%) and BPS Analysis by Application, 2024 to 2034

Figure 57: Western Europe Market Y-o-Y Growth (%) Projections by Application, 2024 to 2034

Figure 58: Western Europe Market Attractiveness by Type, 2024 to 2034

Figure 59: Western Europe Market Attractiveness by Application, 2024 to 2034

Figure 60: Western Europe Market Attractiveness by Country, 2024 to 2034

Figure 61: Eastern Europe Market Value (US$ Million) by Type, 2024 to 2034

Figure 62: Eastern Europe Market Value (US$ Million) by Application, 2024 to 2034

Figure 63: Eastern Europe Market Value (US$ Million) by Country, 2024 to 2034

Figure 64: Eastern Europe Market Value (US$ Million) Analysis by Country, 2019 to 2034

Figure 65: Eastern Europe Market Value Share (%) and BPS Analysis by Country, 2024 to 2034

Figure 66: Eastern Europe Market Y-o-Y Growth (%) Projections by Country, 2024 to 2034

Figure 67: Eastern Europe Market Value (US$ Million) Analysis by Type, 2019 to 2034

Figure 68: Eastern Europe Market Value Share (%) and BPS Analysis by Type, 2024 to 2034

Figure 69: Eastern Europe Market Y-o-Y Growth (%) Projections by Type, 2024 to 2034

Figure 70: Eastern Europe Market Value (US$ Million) Analysis by Application, 2019 to 2034

Figure 71: Eastern Europe Market Value Share (%) and BPS Analysis by Application, 2024 to 2034

Figure 72: Eastern Europe Market Y-o-Y Growth (%) Projections by Application, 2024 to 2034

Figure 73: Eastern Europe Market Attractiveness by Type, 2024 to 2034

Figure 74: Eastern Europe Market Attractiveness by Application, 2024 to 2034

Figure 75: Eastern Europe Market Attractiveness by Country, 2024 to 2034

Figure 76: South Asia and Pacific Market Value (US$ Million) by Type, 2024 to 2034

Figure 77: South Asia and Pacific Market Value (US$ Million) by Application, 2024 to 2034

Figure 78: South Asia and Pacific Market Value (US$ Million) by Country, 2024 to 2034

Figure 79: South Asia and Pacific Market Value (US$ Million) Analysis by Country, 2019 to 2034

Figure 80: South Asia and Pacific Market Value Share (%) and BPS Analysis by Country, 2024 to 2034

Figure 81: South Asia and Pacific Market Y-o-Y Growth (%) Projections by Country, 2024 to 2034

Figure 82: South Asia and Pacific Market Value (US$ Million) Analysis by Type, 2019 to 2034

Figure 83: South Asia and Pacific Market Value Share (%) and BPS Analysis by Type, 2024 to 2034

Figure 84: South Asia and Pacific Market Y-o-Y Growth (%) Projections by Type, 2024 to 2034

Figure 85: South Asia and Pacific Market Value (US$ Million) Analysis by Application, 2019 to 2034

Figure 86: South Asia and Pacific Market Value Share (%) and BPS Analysis by Application, 2024 to 2034

Figure 87: South Asia and Pacific Market Y-o-Y Growth (%) Projections by Application, 2024 to 2034

Figure 88: South Asia and Pacific Market Attractiveness by Type, 2024 to 2034

Figure 89: South Asia and Pacific Market Attractiveness by Application, 2024 to 2034

Figure 90: South Asia and Pacific Market Attractiveness by Country, 2024 to 2034

Figure 91: East Asia Market Value (US$ Million) by Type, 2024 to 2034

Figure 92: East Asia Market Value (US$ Million) by Application, 2024 to 2034

Figure 93: East Asia Market Value (US$ Million) by Country, 2024 to 2034

Figure 94: East Asia Market Value (US$ Million) Analysis by Country, 2019 to 2034

Figure 95: East Asia Market Value Share (%) and BPS Analysis by Country, 2024 to 2034

Figure 96: East Asia Market Y-o-Y Growth (%) Projections by Country, 2024 to 2034

Figure 97: East Asia Market Value (US$ Million) Analysis by Type, 2019 to 2034

Figure 98: East Asia Market Value Share (%) and BPS Analysis by Type, 2024 to 2034

Figure 99: East Asia Market Y-o-Y Growth (%) Projections by Type, 2024 to 2034

Figure 100: East Asia Market Value (US$ Million) Analysis by Application, 2019 to 2034

Figure 101: East Asia Market Value Share (%) and BPS Analysis by Application, 2024 to 2034

Figure 102: East Asia Market Y-o-Y Growth (%) Projections by Application, 2024 to 2034

Figure 103: East Asia Market Attractiveness by Type, 2024 to 2034

Figure 104: East Asia Market Attractiveness by Application, 2024 to 2034

Figure 105: East Asia Market Attractiveness by Country, 2024 to 2034

Figure 106: Middle East and Africa Market Value (US$ Million) by Type, 2024 to 2034

Figure 107: Middle East and Africa Market Value (US$ Million) by Application, 2024 to 2034

Figure 108: Middle East and Africa Market Value (US$ Million) by Country, 2024 to 2034

Figure 109: Middle East and Africa Market Value (US$ Million) Analysis by Country, 2019 to 2034

Figure 110: Middle East and Africa Market Value Share (%) and BPS Analysis by Country, 2024 to 2034

Figure 111: Middle East and Africa Market Y-o-Y Growth (%) Projections by Country, 2024 to 2034

Figure 112: Middle East and Africa Market Value (US$ Million) Analysis by Type, 2019 to 2034

Figure 113: Middle East and Africa Market Value Share (%) and BPS Analysis by Type, 2024 to 2034

Figure 114: Middle East and Africa Market Y-o-Y Growth (%) Projections by Type, 2024 to 2034

Figure 115: Middle East and Africa Market Value (US$ Million) Analysis by Application, 2019 to 2034

Figure 116: Middle East and Africa Market Value Share (%) and BPS Analysis by Application, 2024 to 2034

Figure 117: Middle East and Africa Market Y-o-Y Growth (%) Projections by Application, 2024 to 2034

Figure 118: Middle East and Africa Market Attractiveness by Type, 2024 to 2034

Figure 119: Middle East and Africa Market Attractiveness by Application, 2024 to 2034

Figure 120: Middle East and Africa Market Attractiveness by Country, 2024 to 2034

Recommendations

Technology

Telehealth Software Market

Published : May 2023

Healthcare

Telehealth and Telemedicine Market

Published : February 2023

Explore Healthcare Insights

View Reports