
- Market Size (2026)
- USD 120.7 Mn
- Forecast (2036)
- USD 241.9 Mn
- CAGR (2026 to 2036)
- 7.2%
How big is Thaumatin Market in 2026?
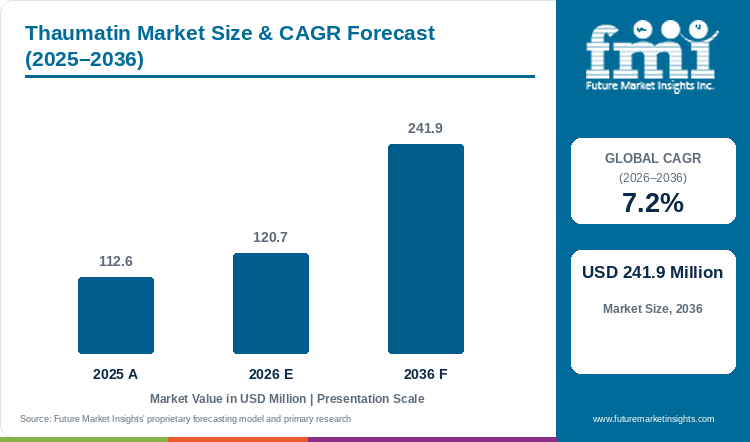
Valued at USD 112.6 million in 2025 and projected to reach USD 120.7 million in 2026, the thaumatin market is expected to hit USD 241.9 million by 2036, registering a CAGR of 7.2%.
Global thaumatin valuation stood at USD 112.6 million for 2025 before rising to USD 120.7 million during 2026. Total category size is projected by FMI to reach USD 241.9 million by 2036, expanding at a compound annual growth rate (CAGR) of 7.2% between 2026 and 2036 while generating an added market value opportunity of USD 121.2 million. West African Katemfe Fruit Thaumatococcus daniellii Extraction holds an estimated 76.4% share of 2026 production source demand, since food processors favor botanical aril extracts that qualify for natural flavoring declarations across Europe and East Asia. Demand for sweet protein modifiers is driven by substitution crossover as beverage and dairy formulators replace bitter single-glycoside stevia and synthetic sweeteners with E957 thaumatin blends at 0.5 to 5 parts per million. Per a November 2025 functional MRI study in NeuroImage on 34 adults, pairing stevia with a flavor modifier reduced hypothalamic bitterness aversion signaling at p equals 0.008 and elevated mouth-fullness perception. That sensory-rescue mechanism separates sweet protein demand from the flavor masking agents category tracking at 3.8% CAGR, since general masking compounds require high inclusion weights whereas thaumatin suppresses metallic aftertastes at micro-gram dosages. Ingredient suppliers are expanding fermentation and excipient platforms to capture that demand, as the US FDA issued a no-questions response for Nomad Bioscience GRAS Notice 1320 in October 2026 covering recombinant thaumatin II at up to 10 mg/kg. Meanwhile, BENEO presented galenIQ taste-masking sachet excipients at CPHI Milan in October 2026 while Givaudan recorded CHF 3,642 million in 2025 Taste and Wellbeing results in January 2026. Beverage and oral-care buyers renew sweet protein contracts on pasteurization stability above 80 degrees Celsius, and suppliers that guarantee year-round aril traceability or GRAS-cleared fermentation capacity retain those accounts through 2036.
Key Market Trends & Insights
- By production source: West African Katemfe Fruit Thaumatococcus daniellii Extraction holds an estimated 76.4% share in 2026 because aqueous aril extraction carries established GRAS and E957 approvals.
- By functional role: Bitterness Masker and Flavor Modifier E957 represents 59.2% in 2026 as sub-sweetness dosing blocks metallic stevia and potassium chloride off-notes.
- By end-use sector: Sugar-Free Gum and Dairy with Reduced-Sugar Beverages account for 44.8% in 2026 because prolonged oral retention extends sweetness perception.
- By form: Spray-Dried Pure and Maltodextrin-Carrier Powder secures 71.8% in 2026 owing to ambient shelf stability and uniform dispersion in dry premixes.
- By formulation blend: Stevia and Monk Fruit Sweetener Blends expand rapidly through 2036 as co-spray-dried modifier systems eliminate licorice linger in zero-sugar drinks.
Regional Highlights
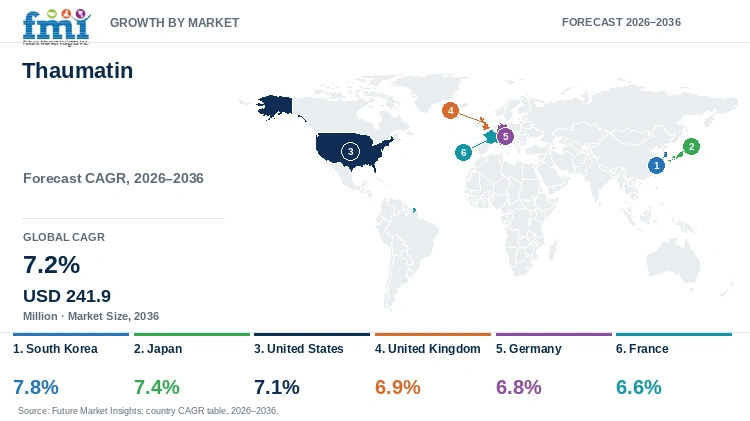
- Top national expansion: South Korea leads national growth projections at a 7.8% CAGR through 2036 under zero-sugar beverage and functional dairy reformulation.
- Broader country progression: Japan tracks at a 7.4% CAGR ahead of the United States at 7.1% and the United Kingdom at 6.9%, whereas Germany advances at 6.8% and France at 6.6%.
Market Size & Forecast
Table 1: Market Size and Forecast for the Thaumatin Market (USD million and CAGR percentage), 2025 to 2036
| Metric | Value |
|---|---|
| 2025 Market Size | USD 112.6 million |
| Estimated Market Size in 2026 | USD 120.7 million |
| Projected Market Size by 2036 | USD 241.9 million |
| CAGR, 2026 to 2036 | 7.2% |
| Added Market Value, 2026 to 2036 | USD 121.2 million |
Beverage and dairy processors with chewable pharmaceutical formulators confront lingering metallic and astringent off-notes when cutting sucrose by more than 30% using high-potency glycosides alone. When brands increase stevia or potassium salt concentrations to hit calorie and sodium targets, bitter T2R receptor activation triggers consumer rejection on repeat purchases. In April 2026, food biochemists reporting within the International Journal of Biological Macromolecules demonstrated that complexing 0.02% thaumatin with 0.1% to 0.5% gum arabic significantly improved thermal sweetness retention and porcine tongue mucosal adhesion after heat processing. Accordingly, R&D directors combine E957 sweet proteins with natural high-intensity sweeteners to round out mid-palate mouthfeel and mask bitter active ingredients.
Treated Beverage & Confectionery Volume and Active-Dosage Sizing
Table 2: Treated Product Volume and Active-Dosage Sizing for the Thaumatin Market (USD million and operational ranges), 2025 to 2036
| Metric | 2025 | 2026 | 2036 |
|---|---|---|---|
| Market size (USD million) | 112.6 | 120.7 | 241.9 |
| Treated food, beverage & oral-care output (million metric tons) | 18.5 to 21.0 | 19.8 to 22.5 | 38.0 to 43.5 |
| Commercial pure & carrier-diluted blend volume (metric tons) | 410.0 to 465.0 | 440.0 to 498.0 | 885.0 to 995.0 |
| Treatment cost per metric ton of finished product (USD) | 5.3 to 6.1 | 5.4 to 6.1 | 5.6 to 6.4 |
Operational note: Treated-output ranges apply regulatory 0.5 to 5.0 ppm flavor-modifier inclusion in beverages and dairy plus 10 to 50 ppm dosing in chewing gum and oral-care pastes.
High-temperature UHT dairy lines and acidic carbonated soft drink bottlers require sweet protein conformations that resist disulfide denaturation during pasteurization. Global flavor houses supply pre-hydrated liquid concentrates and maltodextrin-standardized powders that integrate into low-calorie sweeteners premix hoppers without dusting loss.
Per Capita & Commercial Formulation Line Sizing
Table 3: Per Capita and Formulation Line Valuation Indicators for the Thaumatin Market (USD), 2025 to 2036
| Metric | 2025 | 2026 | 2036 |
|---|---|---|---|
| World population (billion) | 8.2 | 8.3 | 9.0 |
| Market value per 1,000 people (USD) | 13.7 | 14.5 | 26.9 |
| Annual valuation per qualified formulation plant (USD thousand) | 12.8 to 14.6 | 13.6 to 15.5 | 24.8 to 28.2 |
| Precision fermentation & molecular farming share (%) | 21.5% to 23.0% | 23.6% | 34.0% to 38.5% |
Table 4: Industrial Formulation & Functional Role Valuation Indicators for the Thaumatin Market (USD and percentages), 2026
| Metric | Value | Institutional Reference Basis |
|---|---|---|
| Market size, 2026 | USD 120.7 million | 2026 global market value baseline |
| Qualified food, oral-care & feed plants global | 8,400 plants | Beverage, dairy, gum, pharma & feed mills |
| Market value per qualified plant | USD 14,369.0 | Annualized thaumatin procurement |
| Bitterness Masker E957 market value, 2026 | USD 71.5 million | 59.2% functional role allocation |
Removal of synthetic acesulfame potassium and aspartame from chewable tablets and functional drinks requires masking bitter plant isolates and mineral salts. Formulators blend trace thaumatin I and II proteins with sugar substitutes so sweetness onset aligns with sucrose while lingering bitterness disappears.
Analyst Perspective
"Food and oral-care formulators rarely procure thaumatin for standalone bulk sweetness. Instead, buyers specify parts-per-million receptor modulation that rescues reduced-sugar stevia and pea protein formulas from bitter aftertastes. Suppliers that combine traceable West African katemfe extraction with GRAS-cleared precision fermentation will secure multi-year supply agreements as beverage brands cut sugar."
- Nandini Roy Choudhury, Principal Consultant, Future Market Insights.
How is the thaumatin market segmented?
The thaumatin market is segmented by production source and functional role plus end-use sector and form across global regions. In 2026, West African Katemfe Fruit Extraction is projected at 76.4% and Bitterness Masker E957 at 59.2%. Sugar-Free Gum and Dairy with Reduced-Sugar Beverages hold 44.8% while Spray-Dried Powder represents 71.8%.
By production source: West African Katemfe Fruit Thaumatococcus daniellii Extraction plus Precision Fermentation and Plant-Molecular Farming.
By functional role: Bitterness Masker and Flavor Modifier E957 plus High-Intensity Natural Sweetener 2000x Sucrose.
By end-use sector: Sugar-Free Gum and Dairy with Reduced-Sugar Beverages plus Oral Care Toothpaste and Chewable Pharma withStevia Sweetener Blends and Young Piglet Feed Palatants.
By form: Spray-Dried Pure and Maltodextrin-Carrier Powder plus Aqueous Stabilized Liquid Concentrates.
By region: North America and Latin America with Western Europe and Eastern Europe plus East Asia plus South Asia and Pacific with Middle East and Africa.
Why does West African Katemfe Fruit Extraction lead the production source category?
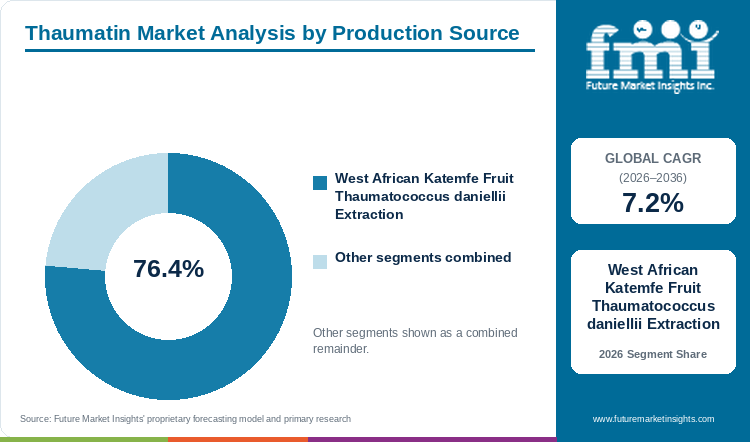
West African Katemfe Fruit Thaumatococcus daniellii Extraction holds an estimated 76.4% of production source demand in 2026, supported by established natural food additive approvals.
Table 5: Production Source Share for the Thaumatin Market (percentage share), 2026
| Production Source | Share (2026) |
|---|---|
| West African Katemfe Fruit Thaumatococcus daniellii Extraction | 76.4% |
| Precision Fermentation and Plant-Molecular Farming | 23.6%* |
| Total | 100.0% |
*Note: Precision fermentation in Komagataella phaffii and plant-molecular farming account for the remaining 23.6% of 2026 global thaumatin production source demand.
Table 6: Production Source Leadership and Market Growth for the Thaumatin Market (segment and CAGR percentage), 2026 to 2036
| Metric | Value |
|---|---|
| Global CAGR (2026 to 2036) | 7.2% |
| Leading Segment | West African Katemfe Fruit Thaumatococcus daniellii Extraction |
Aqueous extraction of wild-harvested Thaumatococcus daniellii fruit arils collected across Cote d'Ivoire and Ghana delivers native thaumatin I and II proteins without genetically modified host declarations. Multinational beverage and dairy buyers evaluating brazzein sweet proteins maintain primary contracts for botanical katemfe extracts because European Union E957 and Japan existing-additive rules authorize plant-extracted thaumatin across broad food categories.
- West African Katemfe Fruit Extraction holds 76.4% of production source value in 2026 because botanical aril isolates qualify for clean-label natural flavor declarations in key markets.
- Givaudan reported in August 2026 that its Ivorian katemfe sourcing network in Agboville engages more than 2,000 collector families and 250 school children under its FairWild traceability and community hygiene program.
What sustains Bitterness Masker and Flavor Modifier E957 leadership in functional role?
Bitterness Masker and Flavor Modifier E957 represents 59.2% of the functional role category in 2026, driven by sub-threshold off-note suppression.
Sub-threshold application of thaumatin at 0.5 to 2 parts per million blocks bitter G-protein-coupled taste receptors while amplifying peppermint and citrus with cocoa aromatics. Formulators developing plant-protein shakes and potassium-enriched electrolyte drinks pair E957 with protein flavor masking agents to neutralize earthy pea and soy hydrolysate notes without adding calories.
- Bitterness Masker and Flavor Modifier E957 represents 59.2% of functional role demand in 2026 as beverage and nutrition brands prioritize off-note neutralization.
- In December 2025, BENEO demonstrated at Fi Europe in Paris that combining short-chain fructooligosaccharides with flavorings with modifying properties cut sugar by 30% in dairy custard while advancing Nutri-Score ratings from C to B.
How do Sugar-Free Gum and Dairy with Reduced-Sugar Beverages lead the end-use sector?
Sugar-Free Gum and Dairy with Reduced-Sugar Beverages account for 44.8% of end-use sector demand in 2026, anchored by slow-release oral sweetness retention.
Positively charged thaumatin proteins bind electrostatically to negatively charged oral mucins, sustaining mint and fruit flavor perception in sugar-free chewing gum for up to 20 minutes of mastication. Confectionery and dairy processors formulating functional chewing gum and reduced-sugar yogurt drinks rely on E957 to restore creamy mouthfeel lost when bulk sucrose is removed.
- Sugar-Free Gum and Dairy with Reduced-Sugar Beverages account for 44.8% of end-use sector valuation in 2026 because gum bases and fermented dairy drinks represent the largest commercial volume.
- A May 2025 study in Food Science and Nutrition confirmed that replacing aspartame with natural stevia and polyol sweetener systems in sugar-free chewing gum preserved instrumental hardness and springiness with accelerated shelf-life stability.
Why does Spray-Dried Pure and Maltodextrin-Carrier Powder lead the form category?
Spray-Dried Pure and Maltodextrin-Carrier Powder secures 71.8% of form valuation in 2026, supported by micro-dosing accuracy and ambient shelf life.
Because pure thaumatin delivers roughly 2,000 times the sweetness of sucrose by weight, direct plant dosing of unstandardized powder risks severe batch-to-batch sensory swings. Spray-dried stabilization of purified sweet protein onto maltodextrin or gum arabic and isomalt carriers allows dry premix blenders and oral care formulations manufacturers to meter homogeneous free-flowing powders without cold-chain storage.
- Spray-Dried Pure and Maltodextrin-Carrier Powder secures 71.8% of form demand in 2026 as dry carrier dilutions prevent weighing errors on industrial batch lines.
- In July 2026, bioengineers at Jiangnan University reported in Sheng Wu Gong Cheng Xue Bao that fed-batch Pichia pastoris fermentation followed by residue-free protease cleavage yielded 126 mg/L of high-purity precursor protein with nearly 100% conversion to native mature thaumatin.
How do Stevia Blends and Animal Feed Palatants expand secondary end-use adoption?
Stevia and Monk Fruit Sweetener Blends with Young Piglet Feed Palatants account for 33.4% of 2026 end-use demand, driven by complementary receptor binding.
Co-crystallization of trace thaumatin with rebaudioside M or mogroside V masks late-onset licorice bitterness while cutting total glycoside cost-in-use by 15% to 25% across tabletop and beverage blends. At the same time, livestock nutritionists incorporate sweet protein palatants into stevia leaf extracts and creep-feed premixes to stimulate voluntary feed intake and prevent post-weaning growth checks in young piglets.
- Secondary end-use sectors across sweetener blends and oral care with animal feed palatants generate 55.2% of combined 2026 demand as formulators exploit cross-category bitterness masking.
- An August 2026 trial in the Journal of Dairy Science demonstrated that incorporating stevia sweetener biomass into ruminant rations linearly increased dry matter intake from 25.2 to 29.5 kg/day and extended daily eating time to 314 minutes.
What are the drivers, restraints, and opportunities in the thaumatin market?
In the thaumatin market, sugar-reduction reformulation and stevia bitterness masking are projected to drive adoption whereas West African katemfe harvest volatility restrains botanical supply and precision-fermented thaumatin II enables scalable beverage deployment.
- Driver: National sugar taxes and clean-label reformulation across beverages and dairy with oral care require sub-threshold sweet proteins to mask bitter stevia and mineral off-notes.
- Restraint: Dependence on wild-foraged West African katemfe arils exposes botanical extract buyers to seasonal rainfall swings and forest collection bottlenecks with high per-kilogram spot prices.
- Opportunity: Commercial scale-up of FDA GRAS-notified recombinant thaumatin II via yeast fermentation and plant-molecular farming enables stable bulk pricing for mass-market carbonated drinks.
Growth Analysis and Future Potential: Qualitative Demand Catalysts
Global beverage and dairy brands are moving beyond first-generation single sweeteners toward multi-component sweetening architectures that replicate the temporal profile of sucrose. When formulators rely solely on rebaudioside A or rebaudioside D, slow receptor dissociation creates a lingering sweet tail that limits consumer repeat purchases. Trace inclusion of parts-per-million thaumatin with feed palatability enhancers and human beverage modulators accelerates sweetness onset and rounds out mid-palate body. In January 2026, neuroscientists at the University of Tokyo and Suntory reported in Frontiers in Nutrition that a calibrated rebaudioside D and glucose with sodium sweetener blend matched sucrose in orbitofrontal cortex palatability activation across 28 healthy adults.
Risk Assessment of the Thaumatin Market: Operational and Formulation Friction
Supply concentration in West African rainforest collection zones and thermal degradation during prolonged high-heat processing represent the primary operational hurdles restraining wider thaumatin adoption. Unprotected thaumatin polypeptides can undergo disulfide scrambling and aggregation when exposed to prolonged UHT sterilization or baking temperatures above 85 degrees Celsius, resulting in sweetness loss. In August 2026, clinical immunologists reporting in Allergology International documented that IgE cross-reactivity to thaumatin-like proteins reached 90.5% in Thai cohorts and 45.7% in Austrian cohorts with fruit allergy, showing why pharmaceutical and food QA teams enforce strict protein purity specifications. Consequently, beverage processors require hydrocolloid co-complexation or thermostable engineered variants before committing national product lines.
Commercial Opportunity Analysis: Formulation Differentiation and Value-Add Formats
Biotechnology fermenters and specialty flavor houses capture high-margin growth by scaling recombinant thaumatin II and rational-designed thermostable variants that eliminate agricultural harvest ceilings. Regulatory clearance via FDA GRAS no-questions letters for yeast-expressed and plant-molecular-farmed sweet proteins allows beverage makers to lock in multi-year fixed-price contracts below botanical katemfe spot rates. In October 2026, protein engineers at Nanjing Tech University reported in the Journal of Agricultural and Food Chemistry that rational design variant R178H retained 63% of its soluble protein fraction after heating at 80 degrees Celsius for two hours compared with 43% for parental scaffold M-882. Thermostable sweet protein grades open pasteurized juice and baked snack with gummy supplement applications through 2036.
Thaumatin Market by Country (2026 to 2036)
FMI country modeling indicates that South Korea leads thaumatin expansion at a 7.8% CAGR through 2036, while Japan advances at 7.4% and the United States at 7.1%. Commercial adoption across East Asian zero-sugar beverage plants and US GRAS-notified sweet protein launches with Western European E957 reformulation programs hinges on national additive schedules and local flavor-house technical support.
Table 7: Country CAGR and Primary Growth Levers for the Thaumatin Market (CAGR percentage and operational drivers), 2026 to 2036
| Country | CAGR (2026 to 2036) | Primary Growth Lever |
|---|---|---|
| South Korea | 7.8% | Zero-sugar RTD beverage and dairy reformulation across KRW 111.9 trillion food sector |
| Japan | 7.4% | Long-standing natural thaumatin additive adoption across USD 174 billion food industry |
| United States | 7.1% | FDA GRAS Notices 1319 and 1320 clearing recombinant thaumatin II for food and beverage use |
| United Kingdom | 6.9% | HFSS promotional restrictions and soft-drink levy driving E957 bitterness masking |
| Germany | 6.8% | Clean-label dairy, functional beverage, and chewable pharma sachet reformulation |
| France | 6.6% | Nutri-Score algorithm pressure accelerating E957 modifier use in dairy and patisserie |
Source: Future Market Insights analysis
South Korea Thaumatin Market Outlook (2026 to 2036)
Demand for thaumatin in South Korea is projected to expand at a leading 7.8% CAGR through 2036 as domestic beverage and dairy chaebols aggressively convert flagship carbonated drinks and functional jellies to zero-sugar recipes. What separates South Korea from Western markets is the rapid mainstream adoption of enzymatic and fermented stevia blends that require parts-per-million thaumatin to strip bitter rebaudioside aftertastes. In July 2025, food scientists at Seoul National University of Science and Technology reported in Food Science and Biotechnology that rebaudioside A appeared in 96.8% of monitored processed foods in South Korea under the 4 mg/kg daily intake threshold. Local beverage formulators pair E957 with glucosylated stevia to preserve clean sweetness across retail channels.
Key takeaway: In South Korea, rapid zero-sugar beverage conversion and high steviol glycoside usage are projected to drive leading demand for thaumatin flavor modifiers.
Japan Thaumatin Market Outlook (2026 to 2036)
Unlike markets that only recently cleared sweet proteins, Japan has applied natural katemfe-derived thaumatin for decades across chilled coffee and savory sauces with pickled vegetables and oral-care products under its Existing Food Additives list. Valuation of thaumatin in Japan is forecast to progress at a 7.4% CAGR between 2026 and 2036 across beverage bottlers and pharmaceutical lozenge plants. Per the April 2026 USDA Foreign Agricultural Service report on Japan, the national food processing sector generated USD 174 billion in 2025 while prioritizing health-oriented soft drinks and shelf-stable functional foods. Domestic ingredient specialists including San-Ei Gen F.F.I. supply customized aqueous and spray-dried thaumatin preparations that mask bitterness in amino-acid sports drinks and elderly nutritional jellies.
Key takeaway: In Japan, established regulatory acceptance across savory and beverage categories with domestic flavor-house blending is forecast to sustain steady thaumatin expansion.
United States Thaumatin Market Outlook (2026 to 2036)
Whereas Asian buyers rely heavily on botanical katemfe imports, growth in the United States is propelled by FDA GRAS clearances for precision-fermented and molecular-farmed recombinant thaumatin II. The United States thaumatin market size is anticipated to advance at a 7.1% CAGR through 2036 across RTD protein shakes and zero-sugar sodas with chewable nutraceutical gummies. In October 2026, the US Food and Drug Administration recorded GRAS Notice 1319 from Oobli for Komagataella phaffii-produced thaumatin II as a general-purpose sweetener and flavor enhancer plus Nomad Bioscience GRAS Notice 1320. Domestic beverage and supplement formulators adopt FEMA GRAS and FDA-notified sweet proteins to cut added sugar grams on Nutrition Facts panels without synthetic sweetener declarations.
Key takeaway: In the United States, FDA GRAS clearances for recombinant thaumatin II and added-sugar label reduction are anticipated to accelerate commercial procurement.
United Kingdom Thaumatin Market Outlook (2026 to 2036)
Expansion of the thaumatin market in the United Kingdom is estimated at a 6.9% CAGR from 2026 to 2036, anchored by the Soft Drinks Industry Levy and retail promotional restrictions on high-sugar foods. What distinguishes the United Kingdom from continental Europe is the dominant 52.2% grocery share held by supermarket private-label brands that mandate aggressive calorie and sugar cuts without artificial aspartame or acesulfame-K. Per the March 2026 USDA Foreign Agricultural Service report on the United Kingdom, food and drink represents the nation's largest manufacturing sector and actively reformulates recipes under strict advertising and clean-label rules. Botanical extractor Natex UK Limited supports domestic beverage and oral-care contract packers with purified E957 grades.
Key takeaway: In the United Kingdom, soft-drink levy thresholds and supermarket private-label reformulation charters are estimated to sustain demand for E957 thaumatin.
Germany Thaumatin Market Outlook (2026 to 2036)
Germany tracks at a 6.8% CAGR between 2026 and 2036 as Europe's largest dairy and functional beverage hub integrates E957 flavor modifiers into reduced-sugar lines and over-the-counter pharmaceutical excipients. Domestic consumers exhibit strong skepticism toward synthetic intense sweeteners, compelling dairy cooperatives and beverage bottlers to pair steviol glycosides and isomaltulose with trace thaumatin to mask bitter off-notes. Per the March 2026 USDA Foreign Agricultural Service report on Germany, the national food and drink processing industry generated USD 270.1 billion (EUR 232.7 billion) across convenience and health with organic product segments. Mannheim-based BENEO GmbH and local flavor compounders formulate pre-calibrated sweetener and excipient systems for chewable tablets and direct-to-mouth sachets with protein-fortified quark desserts.
Key takeaway: In Germany, clean-label dairy reformulation and pharmaceutical sachet excipient engineering are slated to support consistent procurement of E957 modifiers.
France Thaumatin Market Outlook (2026 to 2036)
France is projected to record a 6.6% CAGR in the thaumatin market through 2036 as stricter Nutri-Score algorithm weightings penalize both added sugars and artificial sweeteners in packaged beverages and chilled dairy. Unlike markets focused on tabletop packets, demand in France centers on sub-threshold flavor modification in gourmet yogurts and fruit preparations with oral-care mouthwashes and pediatric pharmaceutical suspensions. Per the April 2026 USDA Foreign Agricultural Service report on France, roughly 17 thousand to 18 thousand agri-food enterprises generate USD 215 billion to USD 225 billion annually while navigating intense regulatory and retail margin pressures. Avignon botanical extraction expertise within Givaudan's Naturex heritage network anchors direct technical supply of E957 aril extracts to domestic food processors.
Key takeaway: In France, Nutri-Score reformulation pressure across chilled dairy and domestic botanical extraction capacity are likely to anchor steady E957 adoption.
Full report country CAGRs cover: North America; Latin America; Western Europe; Eastern Europe; East Asia; South Asia and Pacific; Middle East and Africa.
Who are the notable companies in the thaumatin market?
Naturex Givaudan SA and San-Ei Gen F.F.I., Inc. with Natex UK Limited are notable companies in the thaumatin market. Beneo GmbH and Conagen Inc. with Elo Life Systems also lead commercial supply.
Competitive positioning in the thaumatin industry separates vertically integrated West African botanical extractors and functional taste-modulation houses from synthetic-biology precision fermenters. Naturex Givaudan SA and Natex UK Limited operate primary Thaumatococcus daniellii aril collection and aqueous extraction supply chains. San-Ei Gen F.F.I., Inc. and Beneo GmbH formulate multi-component taste-masking and sweetness-modulating systems, whereas Conagen Inc. and Elo Life Systems scale microbial fermentation and plant-molecular farming pathways.
- Botanical Katemfe Extractors and Taste Leaders: Naturex Givaudan SA and Natex UK Limited manage West African katemfe aril sourcing and aqueous ultrafiltration with global Talin and E957 distribution.
- Functional Sweetener and Excipient Formulators: San-Ei Gen F.F.I., Inc. and Beneo GmbH integrate thaumatin into customized beverage flavor modifiers and dairy stabilizers with pharmaceutical sachet excipients.
- Precision Fermentation and Molecular Farming Innovators: Conagen Inc. and Elo Life Systems engineer microbial cell factories and plant-molecular farming platforms to produce scalable recombinant sweet proteins.
Competitive Benchmarking: Thaumatin Market
Table 8: Competitive Benchmarking for the Thaumatin Market (qualitative capability ratings), 2026
| Company | Botanical E957 Extraction | Fermentation & Biotech Scale | Bitterness-Masking Formulation | Geographic Reach |
|---|---|---|---|---|
| Naturex Givaudan SA | High | Medium | High | Global Taste & Wellbeing network; Ivorian katemfe sourcing and Talin brand |
| San-Ei Gen F.F.I., Inc. | Medium | Medium | High | Japan, East Asia, and global food additive and flavor-modifier solutions |
| Natex UK Limited | High | Low | Medium | UK, European, and international pure botanical thaumatin extraction |
| Beneo GmbH | Medium | Medium | High | Europe, Americas, and Asia-Pacific functional sweeteners and pharma excipients |
| Conagen Inc. | Low | High | High | North America and global precision-fermented thaumatin proteins and modulators |
| Elo Life Systems | Low | High | Medium | United States and global plant-molecular-farmed high-intensity sweet proteins |
Scoring basis: Botanical E957 Extraction evaluates direct West African Thaumatococcus daniellii sourcing and aqueous purification capacity, whereas Fermentation & Biotech Scale rates commercial microbial or plant-molecular expression platforms. Formulation capability for bitterness masking measures application-lab readiness to co-formulate thaumatin with stevia and monk fruit plus pharmaceutical excipients.
Key Developments in the Thaumatin Market
- Givaudan SA reported CHF 3,642 million in Taste and Wellbeing results on January 29, 2026 and expanded its Ivorian katemfe collector traceability and community hygiene program in August 2026.
- BENEO GmbH presented its galenIQ taste-masking sachet excipients at CPHI Milan on October 6, 2026 after demonstrating 30% sugar-reduced FMP dairy prototypes at Fi Europe in December 2025.
- The US FDA logged GRAS Notice 1319 and issued a no-questions response letter for GRAS Notice 1320 in October 2026, clearing recombinant thaumatin II for commercial food and beverage sweetening.
Key Players in the Thaumatin Market
Botanical Katemfe Extractors and Taste Leaders
- Naturex Givaudan SA
- Natex UK Limited
Functional Sweetener and Excipient Formulators
- San-Ei Gen F.F.I., Inc.
- Beneo GmbH
Precision Fermentation and Molecular Farming Innovators
- Conagen Inc.
- Elo Life Systems
Thaumatin Market - Report Scope
Table 9: Report Scope for the Thaumatin Market (coverage fields and definitions), 2026 to 2036
| Coverage field | Report scope |
|---|---|
| Market breakdown | Production Source; Functional Role; End-Use Sector; Form; Region |
| Quantitative Units | USD Million |
| Market Definition | Includes commercial supplier valuation from pure thaumatin I and II proteins (CAS 53850-34-3, E957, FEMA 3732) and standardized carrier dilutions (spray-dried maltodextrin/gum arabic powders and aqueous liquid concentrates) produced via West African Thaumatococcus daniellii extraction, microbial precision fermentation, or plant-molecular farming. Category Scope Note: Excludes bulk commodity polyols, standalone steviol glycosides sold without thaumatin, and synthetic intense sweeteners. |
| Regions Covered | North America; Latin America; Western Europe; Eastern Europe; East Asia; South Asia and Pacific; Middle East and Africa |
| Countries Covered | South Korea, Japan, United States, United Kingdom, Germany, France, and additional countries in the full report |
| Key Companies Covered | Naturex Givaudan SA, San-Ei Gen F.F.I., Inc., Natex UK Limited, Beneo GmbH, Conagen Inc., Elo Life Systems |
| Forecast Period | 2026 to 2036 |
| Approach | Primary and secondary research with top-down and bottom-up market triangulation. |
Thaumatin Market - Research Methodology
Table 10: Research Methodology for the Thaumatin Market (research methods and approach), 2026 edition
| Method | Approach |
|---|---|
| Primary Research | Structured interviews with botanical aril procurement directors in Cote d'Ivoire and Europe, yeast fermentation bioprocess engineers, beverage sensory scientists, and swine feed palatant formulators to validate ppm inclusion rates. |
| Secondary Research | Analysis of US FDA GRAS Notice Inventory filings (GRN 1319 and GRN 1320), EFSA E957 food additive specifications, USDA FAS Food Processing Ingredients Annual reports, PubMed sweet-protein thermostability studies, and corporate annual filings. |
| Market Sizing and Forecasting | Top-down parent natural high-intensity sweeteners and flavor-masking baselines reconciled against bottom-up treated food, oral-care, and feed tonnage (19.8M to 22.5M MT in 2026) and active ppm dosing costs from 2026 to 2036. |
| Country Forecasting Model | Econometric national projections weight zero-sugar beverage reformulation rates, national additive permissions (E957, FEMA GRAS, Japan Existing Additives), and stevia co-masking demand across six focal countries. |
| Operational Benchmark Traceability | Treated-volume and facility valuation indicators in Tables 2, 3, and 4 trace to FDA GRN mg/kg use ceilings, Journal of Agricultural and Food Chemistry fermentation titers, and USDA FAS national processing registries. |
| Data Triangulation and Validation | Valuation estimates isolate pure and carrier-standardized thaumatin proteins across botanical and recombinant routes while strictly excluding unblended stevia, monk fruit, and synthetic sweeteners. |
Thaumatin Market by Segments
Thaumatin Market segmented by Production Source:
- West African Katemfe Fruit Thaumatococcus daniellii Extraction
- Precision Fermentation and Plant-Molecular Farming
Thaumatin Market segmented by Functional Role:
- Bitterness Masker and Flavor Modifier E957
- High-Intensity Natural Sweetener 2000x Sucrose
Thaumatin Market segmented by End-Use Sector:
- Chewing Gum, Dairy, and Reduced-Sugar Beverages
- Oral Care Toothpaste, Mouthwash, and Chewable Pharma
- Stevia and Monk Fruit Sweetener Blends
- Young Piglet and Companion Animal Feed Palatants
Thaumatin Market segmented by Form:
- Spray-Dried Pure and Maltodextrin-Carrier Powder
- Aqueous Stabilized Liquid Concentrates
Thaumatin Market by Region
- North America
- United States
- Canada
- Latin America
- Brazil
- Mexico
- Argentina
- Chile
- Western Europe
- Germany
- France
- United Kingdom
- Italy
- Spain
- Benelux
- Nordics
- Eastern Europe
- Poland
- Czech Republic
- Romania
- Hungary
- East Asia
- China
- Japan
- South Korea
- South Asia and Pacific
- India
- ASEAN
- Australia and New Zealand
- Middle East and Africa
- GCC Countries
- South Africa
- Türkiye
- Israel
Research Sources and Bibliography
- [1] Ko, H. K., Shi, J., Eidenberger, T., Shi, W., & McCabe, C. (2025, November 15). Human neural synergy when combining stevia with a flavour modifier and the neural effects of sucrose vs stevia. NeuroImage, 322, 121552 (PubMed PMID 41135746).
- [2] Maki, S., Fujiwara, M., Fujiwara, Y., Nakabayashi, M., Morimoto, S., Tanaka, S., Fujiwara, S., Hagiwara, M., & Inaka, K. (2025, February 13). Magnetic effects of thaumatin crystals; observation of crystal growth by magneto-Archimedes levitation and magnetic orientation. PLoS ONE, 20(2), e0315335 (PubMed PMID 39946396).
- [3] U.S. Food and Drug Administration. (2026, October 15). GRAS Notice No. 1320: Thaumatin II intended for use as a sweetener in various food categories. U.S. Department of Health and Human Services FDA GRAS Notice Inventory.
- [4] BENEO GmbH. (2026, October 6). Sachet demand puts formulation science in focus as BENEO heads to CPHI Milan 2026. BENEO GmbH Press Releases.
- [5] Givaudan SA. (2026, January 29). 2025 Full year results: Strong financial performance and 2025 strategy targets exceeded. Givaudan SA Media Releases.
- [6] Zheng, W., Zuo, J., Ma, S., Deng, Z., Zhang, X., Song, R., Li, B., Chen, Y., & Guo, J. (2026, April 15). Sweetness perception enhancement of thaumatin via gum arabic complexation: Improved thermostability and oral retention. International Journal of Biological Macromolecules, 361, 151778 (PubMed PMID 41997322).
- [7] Givaudan SA. (2026, August 14). Givaudan Foundation expands hygiene access for katemfe children. Givaudan SA Integrated Report.
- [8] BENEO GmbH. (2025, December 2). BENEO helps producers improve nutritional profiles for weight management at Fi Europe 2025. BENEO GmbH News Releases.
- [9] Aykut, A., & Kirkin, C. (2025, May 15). Developing Sugar-Free Chewing Gum With Stevia as an Aspartame Alternative. Food Science & Nutrition, 13(5), e70296 (PubMed PMID 40376605).
- [10] Shao, Q., Xiang, Y., Sun, Y., Hui, T., & Wang, Y. (2026, July 25). High-purity production of native-conformation sweet protein thaumatin via cell factory fermentation and specific enzymatic cleavage. Sheng Wu Gong Cheng Xue Bao, 42(7), 3019-3037 (PubMed PMID 42522615).
- [11] Nehme Marinho, M., Sarwar, Z., Adeoti, T. M., Perdomo, M., Marinho, G. P., Vincent, A. C. S., Cardoso, J. B., Kononoff, P. J., & Santos, J. E. P. (2026, August 21). Effects of partial replacement of corn silage and oat silage with dried extracted stevia plant on production, feeding behavior, and digestibility in dairy cows. Journal of Dairy Science, S0022-0302(26)03202-9 (PubMed PMID 42628873).
- [12] Nakamura, Y., Takahashi, R., & Ohkuri, T. (2026, January 7). A low-calorie rebaudioside D-glucose-sodium sweetener matches sucrose in palatability and neural responses in a functional MRI study of healthy adults. Frontiers in Nutrition, 12, 1699670 (PubMed PMID 41572976).
- [13] Sompornrattanaphan, M., Kabasser, S., Hemmer, W., Bernklau, D., Sheshori, E., Aumayr, M., Mittermann, I., Krikeerati, T., Vichara-Anont, I., Chokevittaya, P., Ruangsirarak, U., Wongsa, C., Lupinek, C., & Thongngarm, T. (2026, August 13). A proposed thaumatin-like protein (TLP) syndrome: Sensitization patterns, reaction severity, and multiple-fruit reactivity in Thai and Austrian banana-allergic adult cohorts. Allergology International, S1323-8930(26)00084-5 (PubMed PMID 42595651).
- [14] Wang, L., Yang, Y., Dong, J., Wang, H., Zhu, Z., & Jiang, L. (2026, October 21). Enhancing the Thermostability of Sweet Protein Thaumatin II by Integrated Rational Design. Journal of Agricultural and Food Chemistry, 74(41), 32538-32548 (PubMed PMID 42904968).
- [15] Cho, J., Park, H. J., Yun, C. I., & Kim, Y. J. (2025, July 31). Validation and determination of steviol glycosides in processed food products. Food Science and Biotechnology, 34(15), 3527-3536 (PubMed PMID 41113266).
- [16] USDA Foreign Agricultural Service. (2026, April 1). Japan: Food Processing Ingredients Annual. U.S. Department of Agriculture GAIN Report JA2026-0012.
- [17] U.S. Food and Drug Administration. (2026, October 21). GRAS Notice No. 1319: Thaumatin II preparation produced by Komagataella phaffii P-THM-354. U.S. Department of Health and Human Services FDA GRAS Notice Inventory.
- [18] USDA Foreign Agricultural Service. (2026, March 24). United Kingdom: Food Processing Ingredients Annual. U.S. Department of Agriculture GAIN Report UK2026-0008.
- [19] USDA Foreign Agricultural Service. (2026, March 30). Germany: Food Processing Ingredients Annual. U.S. Department of Agriculture GAIN Report GM2026-0007.
- [20] USDA Foreign Agricultural Service. (2026, April 3). France: Food Processing Ingredients Annual. U.S. Department of Agriculture GAIN Report FR2026-0003.
- [21] Wang, L., Liu, Z., Zhang, L., Liu, Y., Li, X., Zhu, L., Zhu, Z., & Jiang, L. (2025, June 18). Improving the Soluble Expression of Sweet Protein Thaumatin II through Directed Evolution in Escherichia coli. Journal of Agricultural and Food Chemistry, 73(24), 15178-15188 (PubMed PMID 40461947).
- [22] Lifshitz, Y., Saban, R., Paz, S., Paz, K. G., Samish, I., Jenkins, A. L., Zeltser, D., & Eldor, R. (2026, May 25). sweelin, a novel sweet protein, does not affect blood glucose and insulin levels - a double-blind, crossover, randomized study. Food Chemistry, 520, 149790 (PubMed PMID 42208445).
- [23] Kim, H. J., Kim, O. C., Hong, S. J., Kang, H. J., Jang, D. E., Park, B. S., Cho, J. Y., & Kim, Y. M. (2025, November 15). Bioconversion and characteristics of the rebaudioside D-like compound by glucosyltransferases combination. Food Chemistry, 492(Pt 1), 145391 (PubMed PMID 40628072).
- [24] Asadi Garmaroudi, M. M., Sedaghati, M., & Shakouri, M. J. (2025, September 21). Probiotic Dairy Dessert With Stevia and Sage Mucilage. Food Science & Nutrition, 13(9), e70986 (PubMed PMID 40989147).
This bibliography is provided for reader reference and is not exhaustive. The full report contains the complete reference list and detailed citations.
This Report Answers
- How large is the thaumatin market in 2026 and what is forecast for 2036?
- Which sugar-reduction and bitterness-masking pressures support demand for thaumatin?
- Why does West African Katemfe Fruit Extraction lead the production source category?
- Why does Bitterness Masker and Flavor Modifier E957 lead functional role demand?
- How do growth rates differ across South Korea and Japan versus the United States and the United Kingdom?
- Which leading companies supply botanical aril extracts versus precision-fermented sweet proteins?
- What limits thermal stability or botanical aril supply in the thaumatin market?
- What should beverage formulators evaluate when pairing thaumatin with stevia or monk fruit?
Table of Content
- Key Takeaways
- Market Size and CAGR
- Top Growth Driver
- Fastest Growing Segment
- Leading Region
- Key Companies
- Emerging Opportunities
- Executive Summary
- Global Market Outlook
- Demand-side Trends
- Supply-side Trends
- Technology Roadmap Analysis
- Analysis and Recommendations
- Analyst Perspective (What is happening? Why now? What should investors know?)
- Key Questions Answered
- How large is the market?
- What is the CAGR?
- What are key trends?
- Which region dominates?
- Who are the leaders?
Read More...
- Market Overview
- Market Coverage / Taxonomy
- Market Definition / Scope / Limitations
- Research Methodology
- Chapter Orientation
- Analytical Lens and Working Hypotheses
- Market Structure, Signals, and Trend Drivers
- Benchmarking and Cross-market Comparability
- Market Sizing, Forecasting, and Opportunity Mapping
- Research Design and Evidence Framework
- Desk Research Programme (Secondary Evidence)
- Expert Input and Fieldwork (Primary Evidence)
- Tooling, Models, and Reference Databases
- Data Engineering and Model Build
- Quality Assurance and Audit Trail
- Market Background
- Market Dynamics (Drivers, Restraints, Opportunity, Trends)
- Scenario Forecast (Optimistic, Likely, Conservative)
- Impact Analysis
- AI Impact
- Sustainability Impact
- Regulatory Impact
- Technology Impact
- Consumer / Buyer Analysis
- Purchase Drivers
- Adoption Barriers
- Buyer Journey
- Opportunity Map Analysis
- Product Life Cycle Analysis
- Supply Chain Analysis
- Investment Feasibility Matrix
- Value Chain Analysis
- PESTLE and Porter's Analysis
- Regulatory Landscape
- Regional Parent Market Outlook
- Production and Consumption Statistics
- Import and Export Statistics
- Global Market Analysis and Forecast, 2021 to 2036
- Historical Market Size Value (USD Million) Analysis, 2021 to 2025
- Current and Future Market Size Value (USD Million) Projections, 2026 to 2036
- Y-o-Y Growth Trend Analysis
- Absolute $ Opportunity Analysis
- Global Market Pricing Analysis, 2021 to 2036
- Global Market Analysis and Forecast, By Production Source, 2021 to 2036
- Introduction / Key Findings
- Historical Market Size Value (USD Million) Analysis By Production Source, 2021 to 2025
- Current and Future Market Size Value (USD Million) Analysis and Forecast By Production Source, 2026 to 2036
- West African Katemfe Fruit Thaumatococcus daniellii Extraction
- Precision Fermentation and Plant-Molecular Farming
- Y-o-Y Growth Trend Analysis By Production Source, 2021 to 2025
- Absolute $ Opportunity Analysis By Production Source, 2026 to 2036
- Global Market Analysis and Forecast, By Functional Role, 2021 to 2036
- Introduction / Key Findings
- Historical Market Size Value (USD Million) Analysis By Functional Role, 2021 to 2025
- Current and Future Market Size Value (USD Million) Analysis and Forecast By Functional Role, 2026 to 2036
- Bitterness Masker and Flavor Modifier E957
- High-Intensity Natural Sweetener 2000x Sucrose
- Y-o-Y Growth Trend Analysis By Functional Role, 2021 to 2025
- Absolute $ Opportunity Analysis By Functional Role, 2026 to 2036
- Global Market Analysis and Forecast, By End-Use Sector, 2021 to 2036
- Introduction / Key Findings
- Historical Market Size Value (USD Million) Analysis By End-Use Sector, 2021 to 2025
- Current and Future Market Size Value (USD Million) Analysis and Forecast By End-Use Sector, 2026 to 2036
- Chewing Gum, Dairy, and Reduced-Sugar Beverages
- Oral Care Toothpaste, Mouthwash, and Chewable Pharma
- Stevia and Monk Fruit Sweetener Blends
- Young Piglet and Companion Animal Feed Palatants
- Y-o-Y Growth Trend Analysis By End-Use Sector, 2021 to 2025
- Absolute $ Opportunity Analysis By End-Use Sector, 2026 to 2036
- Global Market Analysis and Forecast, By Form, 2021 to 2036
- Introduction / Key Findings
- Historical Market Size Value (USD Million) Analysis By Form, 2021 to 2025
- Current and Future Market Size Value (USD Million) Analysis and Forecast By Form, 2026 to 2036
- Spray-Dried Pure and Maltodextrin-Carrier Powder
- Aqueous Stabilized Liquid Concentrates
- Y-o-Y Growth Trend Analysis By Form, 2021 to 2025
- Absolute $ Opportunity Analysis By Form, 2026 to 2036
- Global Market Analysis and Forecast, By Region, 2021 to 2036
- Introduction
- Historical Market Size Value (USD Million) Analysis By Region, 2021 to 2025
- Current Market Size Value (USD Million) Analysis and Forecast By Region, 2026 to 2036
- North America
- Latin America
- Western Europe
- Eastern Europe
- East Asia
- South Asia and Pacific
- Middle East and Africa
- Market Attractiveness Analysis By Region
- North America Market Analysis and Forecast, By Country, 2021 to 2036
- Historical Market Size Value (USD Million) Trend Analysis By Market Taxonomy, 2021 to 2025
- Market Size Value (USD Million) Forecast By Market Taxonomy, 2026 to 2036
- By Country
- United States
- Canada
- By Production Source
- By Functional Role
- By End-Use Sector
- By Form
- By Country
- Market Attractiveness Analysis
- By Country
- By Production Source
- By Functional Role
- By End-Use Sector
- By Form
- Key Takeaways
- Latin America Market Analysis and Forecast, By Country
- Historical Market Size Value (USD Million) Trend Analysis By Market Taxonomy, 2021 to 2025
- Market Size Value (USD Million) Forecast By Market Taxonomy, 2026 to 2036
- By Country
- Brazil
- Mexico
- Argentina
- Chile
- By Production Source
- By Functional Role
- By End-Use Sector
- By Form
- By Country
- Market Attractiveness Analysis
- By Country
- By Production Source
- By Functional Role
- By End-Use Sector
- By Form
- Key Takeaways
- Western Europe Market Analysis and Forecast, By Country
- Historical Market Size Value (USD Million) Trend Analysis By Market Taxonomy, 2021 to 2025
- Market Size Value (USD Million) Forecast By Market Taxonomy, 2026 to 2036
- By Country
- Germany
- France
- United Kingdom
- Italy
- Spain
- Benelux
- Nordics
- By Production Source
- By Functional Role
- By End-Use Sector
- By Form
- By Country
- Market Attractiveness Analysis
- By Country
- By Production Source
- By Functional Role
- By End-Use Sector
- By Form
- Key Takeaways
- Eastern Europe Market Analysis and Forecast, By Country
- Historical Market Size Value (USD Million) Trend Analysis By Market Taxonomy, 2021 to 2025
- Market Size Value (USD Million) Forecast By Market Taxonomy, 2026 to 2036
- By Country
- Poland
- Czech Republic
- Romania
- Hungary
- By Production Source
- By Functional Role
- By End-Use Sector
- By Form
- By Country
- Market Attractiveness Analysis
- By Country
- By Production Source
- By Functional Role
- By End-Use Sector
- By Form
- Key Takeaways
- East Asia Market Analysis and Forecast, By Country
- Historical Market Size Value (USD Million) Trend Analysis By Market Taxonomy, 2021 to 2025
- Market Size Value (USD Million) Forecast By Market Taxonomy, 2026 to 2036
- By Country
- China
- Japan
- South Korea
- By Production Source
- By Functional Role
- By End-Use Sector
- By Form
- By Country
- Market Attractiveness Analysis
- By Country
- By Production Source
- By Functional Role
- By End-Use Sector
- By Form
- Key Takeaways
- South Asia and Pacific Market Analysis and Forecast, By Country
- Historical Market Size Value (USD Million) Trend Analysis By Market Taxonomy, 2021 to 2025
- Market Size Value (USD Million) Forecast By Market Taxonomy, 2026 to 2036
- By Country
- India
- ASEAN
- Australia and New Zealand
- By Production Source
- By Functional Role
- By End-Use Sector
- By Form
- By Country
- Market Attractiveness Analysis
- By Country
- By Production Source
- By Functional Role
- By End-Use Sector
- By Form
- Key Takeaways
- Middle East and Africa Market Analysis and Forecast, By Country
- Historical Market Size Value (USD Million) Trend Analysis By Market Taxonomy, 2021 to 2025
- Market Size Value (USD Million) Forecast By Market Taxonomy, 2026 to 2036
- By Country
- GCC Countries
- South Africa
- Türkiye
- Israel
- By Production Source
- By Functional Role
- By End-Use Sector
- By Form
- By Country
- Market Attractiveness Analysis
- By Country
- By Production Source
- By Functional Role
- By End-Use Sector
- By Form
- Key Takeaways
- Key Countries Market Analysis
- United States
- Pricing Analysis
- Market Share Analysis, 2025
- By Production Source
- By Functional Role
- By End-Use Sector
- By Form
- Canada
- Pricing Analysis
- Market Share Analysis, 2025
- By Production Source
- By Functional Role
- By End-Use Sector
- By Form
- Mexico
- Pricing Analysis
- Market Share Analysis, 2025
- By Production Source
- By Functional Role
- By End-Use Sector
- By Form
- Brazil
- Pricing Analysis
- Market Share Analysis, 2025
- By Production Source
- By Functional Role
- By End-Use Sector
- By Form
- Chile
- Pricing Analysis
- Market Share Analysis, 2025
- By Production Source
- By Functional Role
- By End-Use Sector
- By Form
- Germany
- Pricing Analysis
- Market Share Analysis, 2025
- By Production Source
- By Functional Role
- By End-Use Sector
- By Form
- United Kingdom
- Pricing Analysis
- Market Share Analysis, 2025
- By Production Source
- By Functional Role
- By End-Use Sector
- By Form
- Italy
- Pricing Analysis
- Market Share Analysis, 2025
- By Production Source
- By Functional Role
- By End-Use Sector
- By Form
- Spain
- Pricing Analysis
- Market Share Analysis, 2025
- By Production Source
- By Functional Role
- By End-Use Sector
- By Form
- France
- Pricing Analysis
- Market Share Analysis, 2025
- By Production Source
- By Functional Role
- By End-Use Sector
- By Form
- India
- Pricing Analysis
- Market Share Analysis, 2025
- By Production Source
- By Functional Role
- By End-Use Sector
- By Form
- ASEAN
- Pricing Analysis
- Market Share Analysis, 2025
- By Production Source
- By Functional Role
- By End-Use Sector
- By Form
- Australia and New Zealand
- Pricing Analysis
- Market Share Analysis, 2025
- By Production Source
- By Functional Role
- By End-Use Sector
- By Form
- China
- Pricing Analysis
- Market Share Analysis, 2025
- By Production Source
- By Functional Role
- By End-Use Sector
- By Form
- Japan
- Pricing Analysis
- Market Share Analysis, 2025
- By Production Source
- By Functional Role
- By End-Use Sector
- By Form
- South Korea
- Pricing Analysis
- Market Share Analysis, 2025
- By Production Source
- By Functional Role
- By End-Use Sector
- By Form
- Poland
- Pricing Analysis
- Market Share Analysis, 2025
- By Production Source
- By Functional Role
- By End-Use Sector
- By Form
- Hungary
- Pricing Analysis
- Market Share Analysis, 2025
- By Production Source
- By Functional Role
- By End-Use Sector
- By Form
- Türkiye
- Pricing Analysis
- Market Share Analysis, 2025
- By Production Source
- By Functional Role
- By End-Use Sector
- By Form
- South Africa
- Pricing Analysis
- Market Share Analysis, 2025
- By Production Source
- By Functional Role
- By End-Use Sector
- By Form
- United States
- Market Structure Analysis
- Competition Dashboard
- Competition Benchmarking
- Market Share Analysis of Top Players
- By Regional
- By Production Source
- By Functional Role
- By End-Use Sector
- By Form
- Emerging Startups
- Innovation Benchmarking
- Competition Analysis
- Competition Deep Dive
- Naturex Givaudan SA
- Overview
- Product Portfolio
- Profitability by Market Segments
- Sales Footprint
- Strategy Overview
- Marketing Strategy
- Product Strategy
- Channel Strategy
- San-Ei Gen F.F.I., Inc.
- Natex UK Limited
- Beneo GmbH
- Conagen Inc.
- Elo Life Systems
- Naturex Givaudan SA
- Case Studies
- Success Stories
- Recent Developments
- Competition Deep Dive
- Assumptions & Acronyms Used
List of Tables
- Table 1: Global Market Value (USD Million) Forecast by Region, 2021 to 2036
- Table 2: Global Market Value (USD Million) Forecast by Production Source, 2021 to 2036
- Table 3: Global Market Value (USD Million) Forecast by Functional Role, 2021 to 2036
- Table 4: Global Market Value (USD Million) Forecast by End-Use Sector, 2021 to 2036
- Table 5: Global Market Value (USD Million) Forecast by Form, 2021 to 2036
- Table 6: North America Market Value (USD Million) Forecast by Country, 2021 to 2036
- Table 7: North America Market Value (USD Million) Forecast by Production Source, 2021 to 2036
- Table 8: North America Market Value (USD Million) Forecast by Functional Role, 2021 to 2036
- Table 9: North America Market Value (USD Million) Forecast by End-Use Sector, 2021 to 2036
- Table 10: North America Market Value (USD Million) Forecast by Form, 2021 to 2036
- Table 11: Latin America Market Value (USD Million) Forecast by Country, 2021 to 2036
- Table 12: Latin America Market Value (USD Million) Forecast by Production Source, 2021 to 2036
- Table 13: Latin America Market Value (USD Million) Forecast by Functional Role, 2021 to 2036
- Table 14: Latin America Market Value (USD Million) Forecast by End-Use Sector, 2021 to 2036
- Table 15: Latin America Market Value (USD Million) Forecast by Form, 2021 to 2036
- Table 16: Western Europe Market Value (USD Million) Forecast by Country, 2021 to 2036
- Table 17: Western Europe Market Value (USD Million) Forecast by Production Source, 2021 to 2036
- Table 18: Western Europe Market Value (USD Million) Forecast by Functional Role, 2021 to 2036
- Table 19: Western Europe Market Value (USD Million) Forecast by End-Use Sector, 2021 to 2036
- Table 20: Western Europe Market Value (USD Million) Forecast by Form, 2021 to 2036
- Table 21: Eastern Europe Market Value (USD Million) Forecast by Country, 2021 to 2036
- Table 22: Eastern Europe Market Value (USD Million) Forecast by Production Source, 2021 to 2036
- Table 23: Eastern Europe Market Value (USD Million) Forecast by Functional Role, 2021 to 2036
- Table 24: Eastern Europe Market Value (USD Million) Forecast by End-Use Sector, 2021 to 2036
- Table 25: Eastern Europe Market Value (USD Million) Forecast by Form, 2021 to 2036
- Table 26: East Asia Market Value (USD Million) Forecast by Country, 2021 to 2036
- Table 27: East Asia Market Value (USD Million) Forecast by Production Source, 2021 to 2036
- Table 28: East Asia Market Value (USD Million) Forecast by Functional Role, 2021 to 2036
- Table 29: East Asia Market Value (USD Million) Forecast by End-Use Sector, 2021 to 2036
- Table 30: East Asia Market Value (USD Million) Forecast by Form, 2021 to 2036
- Table 31: South Asia and Pacific Market Value (USD Million) Forecast by Country, 2021 to 2036
- Table 32: South Asia and Pacific Market Value (USD Million) Forecast by Production Source, 2021 to 2036
- Table 33: South Asia and Pacific Market Value (USD Million) Forecast by Functional Role, 2021 to 2036
- Table 34: South Asia and Pacific Market Value (USD Million) Forecast by End-Use Sector, 2021 to 2036
- Table 35: South Asia and Pacific Market Value (USD Million) Forecast by Form, 2021 to 2036
- Table 36: Middle East and Africa Market Value (USD Million) Forecast by Country, 2021 to 2036
- Table 37: Middle East and Africa Market Value (USD Million) Forecast by Production Source, 2021 to 2036
- Table 38: Middle East and Africa Market Value (USD Million) Forecast by Functional Role, 2021 to 2036
- Table 39: Middle East and Africa Market Value (USD Million) Forecast by End-Use Sector, 2021 to 2036
- Table 40: Middle East and Africa Market Value (USD Million) Forecast by Form, 2021 to 2036
List of Figures
- Figure 1: Global Market Pricing Analysis
- Figure 2: Global Market Value (USD Million) Forecast 2021-2036
- Figure 3: Global Market Value Share and BPS Analysis by Production Source, 2026 and 2036
- Figure 4: Global Market Y-o-Y Growth Comparison by Production Source, 2026-2036
- Figure 5: Global Market Attractiveness Analysis by Production Source
- Figure 6: Global Market Value Share and BPS Analysis by Functional Role, 2026 and 2036
- Figure 7: Global Market Y-o-Y Growth Comparison by Functional Role, 2026-2036
- Figure 8: Global Market Attractiveness Analysis by Functional Role
- Figure 9: Global Market Value Share and BPS Analysis by End-Use Sector, 2026 and 2036
- Figure 10: Global Market Y-o-Y Growth Comparison by End-Use Sector, 2026-2036
- Figure 11: Global Market Attractiveness Analysis by End-Use Sector
- Figure 12: Global Market Value Share and BPS Analysis by Form, 2026 and 2036
- Figure 13: Global Market Y-o-Y Growth Comparison by Form, 2026-2036
- Figure 14: Global Market Attractiveness Analysis by Form
- Figure 15: Global Market Value (USD Million) Share and BPS Analysis by Region, 2026 and 2036
- Figure 16: Global Market Y-o-Y Growth Comparison by Region, 2026-2036
- Figure 17: Global Market Attractiveness Analysis by Region
- Figure 18: North America Market Incremental Dollar Opportunity, 2026-2036
- Figure 19: Latin America Market Incremental Dollar Opportunity, 2026-2036
- Figure 20: Western Europe Market Incremental Dollar Opportunity, 2026-2036
- Figure 21: Eastern Europe Market Incremental Dollar Opportunity, 2026-2036
- Figure 22: East Asia Market Incremental Dollar Opportunity, 2026-2036
- Figure 23: South Asia and Pacific Market Incremental Dollar Opportunity, 2026-2036
- Figure 24: Middle East and Africa Market Incremental Dollar Opportunity, 2026-2036
- Figure 25: North America Market Value Share and BPS Analysis by Country, 2026 and 2036
- Figure 26: North America Market Value Share and BPS Analysis by Production Source, 2026 and 2036
- Figure 27: North America Market Y-o-Y Growth Comparison by Production Source, 2026-2036
- Figure 28: North America Market Attractiveness Analysis by Production Source
- Figure 29: North America Market Value Share and BPS Analysis by Functional Role, 2026 and 2036
- Figure 30: North America Market Y-o-Y Growth Comparison by Functional Role, 2026-2036
- Figure 31: North America Market Attractiveness Analysis by Functional Role
- Figure 32: North America Market Value Share and BPS Analysis by End-Use Sector, 2026 and 2036
- Figure 33: North America Market Y-o-Y Growth Comparison by End-Use Sector, 2026-2036
- Figure 34: North America Market Attractiveness Analysis by End-Use Sector
- Figure 35: North America Market Value Share and BPS Analysis by Form, 2026 and 2036
- Figure 36: North America Market Y-o-Y Growth Comparison by Form, 2026-2036
- Figure 37: North America Market Attractiveness Analysis by Form
- Figure 38: Latin America Market Value Share and BPS Analysis by Country, 2026 and 2036
- Figure 39: Latin America Market Value Share and BPS Analysis by Production Source, 2026 and 2036
- Figure 40: Latin America Market Y-o-Y Growth Comparison by Production Source, 2026-2036
- Figure 41: Latin America Market Attractiveness Analysis by Production Source
- Figure 42: Latin America Market Value Share and BPS Analysis by Functional Role, 2026 and 2036
- Figure 43: Latin America Market Y-o-Y Growth Comparison by Functional Role, 2026-2036
- Figure 44: Latin America Market Attractiveness Analysis by Functional Role
- Figure 45: Latin America Market Value Share and BPS Analysis by End-Use Sector, 2026 and 2036
- Figure 46: Latin America Market Y-o-Y Growth Comparison by End-Use Sector, 2026-2036
- Figure 47: Latin America Market Attractiveness Analysis by End-Use Sector
- Figure 48: Latin America Market Value Share and BPS Analysis by Form, 2026 and 2036
- Figure 49: Latin America Market Y-o-Y Growth Comparison by Form, 2026-2036
- Figure 50: Latin America Market Attractiveness Analysis by Form
- Figure 51: Western Europe Market Value Share and BPS Analysis by Country, 2026 and 2036
- Figure 52: Western Europe Market Value Share and BPS Analysis by Production Source, 2026 and 2036
- Figure 53: Western Europe Market Y-o-Y Growth Comparison by Production Source, 2026-2036
- Figure 54: Western Europe Market Attractiveness Analysis by Production Source
- Figure 55: Western Europe Market Value Share and BPS Analysis by Functional Role, 2026 and 2036
- Figure 56: Western Europe Market Y-o-Y Growth Comparison by Functional Role, 2026-2036
- Figure 57: Western Europe Market Attractiveness Analysis by Functional Role
- Figure 58: Western Europe Market Value Share and BPS Analysis by End-Use Sector, 2026 and 2036
- Figure 59: Western Europe Market Y-o-Y Growth Comparison by End-Use Sector, 2026-2036
- Figure 60: Western Europe Market Attractiveness Analysis by End-Use Sector
- Figure 61: Western Europe Market Value Share and BPS Analysis by Form, 2026 and 2036
- Figure 62: Western Europe Market Y-o-Y Growth Comparison by Form, 2026-2036
- Figure 63: Western Europe Market Attractiveness Analysis by Form
- Figure 64: Eastern Europe Market Value Share and BPS Analysis by Country, 2026 and 2036
- Figure 65: Eastern Europe Market Value Share and BPS Analysis by Production Source, 2026 and 2036
- Figure 66: Eastern Europe Market Y-o-Y Growth Comparison by Production Source, 2026-2036
- Figure 67: Eastern Europe Market Attractiveness Analysis by Production Source
- Figure 68: Eastern Europe Market Value Share and BPS Analysis by Functional Role, 2026 and 2036
- Figure 69: Eastern Europe Market Y-o-Y Growth Comparison by Functional Role, 2026-2036
- Figure 70: Eastern Europe Market Attractiveness Analysis by Functional Role
- Figure 71: Eastern Europe Market Value Share and BPS Analysis by End-Use Sector, 2026 and 2036
- Figure 72: Eastern Europe Market Y-o-Y Growth Comparison by End-Use Sector, 2026-2036
- Figure 73: Eastern Europe Market Attractiveness Analysis by End-Use Sector
- Figure 74: Eastern Europe Market Value Share and BPS Analysis by Form, 2026 and 2036
- Figure 75: Eastern Europe Market Y-o-Y Growth Comparison by Form, 2026-2036
- Figure 76: Eastern Europe Market Attractiveness Analysis by Form
- Figure 77: East Asia Market Value Share and BPS Analysis by Country, 2026 and 2036
- Figure 78: East Asia Market Value Share and BPS Analysis by Production Source, 2026 and 2036
- Figure 79: East Asia Market Y-o-Y Growth Comparison by Production Source, 2026-2036
- Figure 80: East Asia Market Attractiveness Analysis by Production Source
- Figure 81: East Asia Market Value Share and BPS Analysis by Functional Role, 2026 and 2036
- Figure 82: East Asia Market Y-o-Y Growth Comparison by Functional Role, 2026-2036
- Figure 83: East Asia Market Attractiveness Analysis by Functional Role
- Figure 84: East Asia Market Value Share and BPS Analysis by End-Use Sector, 2026 and 2036
- Figure 85: East Asia Market Y-o-Y Growth Comparison by End-Use Sector, 2026-2036
- Figure 86: East Asia Market Attractiveness Analysis by End-Use Sector
- Figure 87: East Asia Market Value Share and BPS Analysis by Form, 2026 and 2036
- Figure 88: East Asia Market Y-o-Y Growth Comparison by Form, 2026-2036
- Figure 89: East Asia Market Attractiveness Analysis by Form
- Figure 90: South Asia and Pacific Market Value Share and BPS Analysis by Country, 2026 and 2036
- Figure 91: South Asia and Pacific Market Value Share and BPS Analysis by Production Source, 2026 and 2036
- Figure 92: South Asia and Pacific Market Y-o-Y Growth Comparison by Production Source, 2026-2036
- Figure 93: South Asia and Pacific Market Attractiveness Analysis by Production Source
- Figure 94: South Asia and Pacific Market Value Share and BPS Analysis by Functional Role, 2026 and 2036
- Figure 95: South Asia and Pacific Market Y-o-Y Growth Comparison by Functional Role, 2026-2036
- Figure 96: South Asia and Pacific Market Attractiveness Analysis by Functional Role
- Figure 97: South Asia and Pacific Market Value Share and BPS Analysis by End-Use Sector, 2026 and 2036
- Figure 98: South Asia and Pacific Market Y-o-Y Growth Comparison by End-Use Sector, 2026-2036
- Figure 99: South Asia and Pacific Market Attractiveness Analysis by End-Use Sector
- Figure 100: South Asia and Pacific Market Value Share and BPS Analysis by Form, 2026 and 2036
- Figure 101: South Asia and Pacific Market Y-o-Y Growth Comparison by Form, 2026-2036
- Figure 102: South Asia and Pacific Market Attractiveness Analysis by Form
- Figure 103: Middle East and Africa Market Value Share and BPS Analysis by Country, 2026 and 2036
- Figure 104: Middle East and Africa Market Value Share and BPS Analysis by Production Source, 2026 and 2036
- Figure 105: Middle East and Africa Market Y-o-Y Growth Comparison by Production Source, 2026-2036
- Figure 106: Middle East and Africa Market Attractiveness Analysis by Production Source
- Figure 107: Middle East and Africa Market Value Share and BPS Analysis by Functional Role, 2026 and 2036
- Figure 108: Middle East and Africa Market Y-o-Y Growth Comparison by Functional Role, 2026-2036
- Figure 109: Middle East and Africa Market Attractiveness Analysis by Functional Role
- Figure 110: Middle East and Africa Market Value Share and BPS Analysis by End-Use Sector, 2026 and 2036
- Figure 111: Middle East and Africa Market Y-o-Y Growth Comparison by End-Use Sector, 2026-2036
- Figure 112: Middle East and Africa Market Attractiveness Analysis by End-Use Sector
- Figure 113: Middle East and Africa Market Value Share and BPS Analysis by Form, 2026 and 2036
- Figure 114: Middle East and Africa Market Y-o-Y Growth Comparison by Form, 2026-2036
- Figure 115: Middle East and Africa Market Attractiveness Analysis by Form
- Figure 116: Global Market - Tier Structure Analysis
- Figure 117: Global Market - Company Share Analysis
Frequently Asked Questions
How big is the thaumatin market in 2026, and what is forecast for 2036?
FMI estimates that global thaumatin market size stood at USD 112.6 million in 2025 and reached USD 120.7 million in 2026. Overall industry valuation is on track to hit USD 241.9 million by 2036 while beverage and oral-care brands expand E957 bitterness masking and recombinant sweet protein adoption.
What is the CAGR for the thaumatin market from 2026 to 2036?
The thaumatin sector is projected to expand at a 7.2% CAGR over the 2026 to 2036 window, adding USD 121.2 million in market value across food and oral-care with feed applications.
Which production source segment leads the thaumatin market?
West African Katemfe Fruit Thaumatococcus daniellii Extraction holds 76.4% of production source demand in 2026 because aqueous botanical isolates hold established E957 and FEMA GRAS with Japan additive approvals.
Which functional role segment leads the thaumatin market?
Bitterness Masker and Flavor Modifier E957 represents 59.2% of functional role valuation in 2026 as parts-per-million dosing neutralizes metallic stevia and potassium salt off-notes.
Which country has a notable growth outlook during the assessment period?
South Korea leads national expansion projections at a 7.8% CAGR through 2036, driven by zero-sugar beverage and dairy reformulation across major domestic food groups.
Who are the key players in the market?
Naturex Givaudan SA and San-Ei Gen F.F.I., Inc. with Natex UK Limited lead botanical extraction and flavor modulation. Beneo GmbH and Conagen Inc. with Elo Life Systems anchor excipient blending and precision fermentation.
Preview the report firsthand - request a free sample
Get SampleGet the brochure for pricing and purchase details.
Get PDF
