Transilluminators Market Size and Share Forecast Outlook 2025 to 2035

The Transilluminators Market is estimated to be valued at USD 117.9 million in 2025 and is projected to reach USD 192.1 million by 2035, registering a compound annual growth rate (CAGR) of 5.0% over the forecast period.
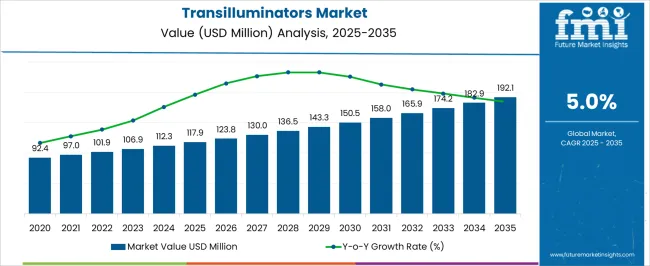
Quick Stats for Transilluminators Market

  • Transilluminators Market Value (2025): USD 117.9 million
  • Transilluminators Market Forecast Value (2035): USD 192.1 million
  • Transilluminators Market Forecast CAGR: 5.0%
  • Leading Segment in Transilluminators Market in 2025: Educational Institutions (55.0%)
  • Key Growth Regions in Transilluminators Market: North America, Asia-Pacific, Europe
  • Top Key Players in Transilluminators Market: GE Healthcare, Philips Healthcare, Siemens Healthineers, Baxter International Inc., Hill-Rom Holdings, Inc., Veinlite, Advin Health Care, TransLite LLC, Lutech Industries, Venoscope LLC

Transilluminators Market Market Value Analysis

Transilluminators Market Key Takeaways

Metric Value
Transilluminators Market Estimated Value in (2025 E) USD 117.9 million
Transilluminators Market Forecast Value in (2035 F) USD 192.1 million
Forecast CAGR (2025 to 2035) 5.0%

Why is the Transilluminators Market Growing?

The Transilluminators market is experiencing robust growth driven by the increasing adoption of molecular biology and microbiology techniques in educational and research institutions. The current scenario reflects a growing demand for advanced laboratory equipment that enables visualization of nucleic acids, proteins, and other biomolecules. In 2025, the market is primarily fueled by investments in academic infrastructure, expanding laboratory curricula, and rising awareness about practical laboratory training.

The evolution of compact, energy-efficient, and software-assisted transilluminators has further enhanced their usability and appeal in educational settings. With an increasing number of institutions integrating hands-on molecular biology programs and microbiology experiments, the demand for transilluminators capable of delivering accurate and reproducible results has surged.

Additionally, improvements in safety features, LED-based illumination, and compatibility with various gel types are shaping the future outlook of the market As educational institutions continue to modernize laboratories and emphasize experiential learning, the Transilluminators market is anticipated to maintain sustained growth, offering scalable and reliable solutions for academic and research purposes.

Segmental Analysis

The transilluminators market is segmented by end use, application, and geographic regions. By end use, transilluminators market is divided into Educational Institutions and Research & Development Laboratories. In terms of application, transilluminators market is classified into Microbiology, Biochemical, Pharmaceutical, and Others. Regionally, the transilluminators industry is classified into North America, Latin America, Western Europe, Eastern Europe, Balkan & Baltic Countries, Russia & Belarus, Central Asia, East Asia, South Asia & Pacific, and the Middle East & Africa.
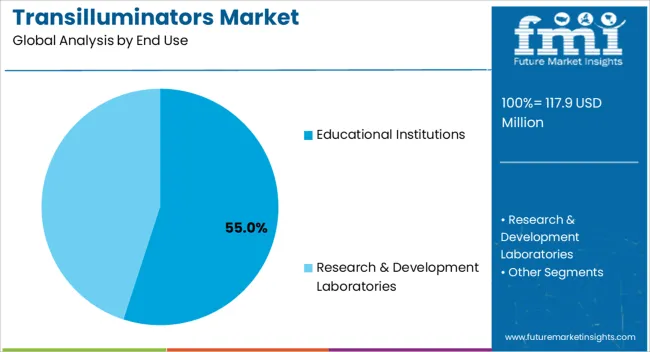
Insights into the Educational Institutions Segment

Transilluminators Market Analysis By End Use

The Educational Institutions end-use segment is expected to account for 55.0% of the Transilluminators market revenue in 2025, making it the largest segment. This dominance is being attributed to the growing emphasis on practical laboratory training across undergraduate and postgraduate programs in molecular biology and microbiology.

Adoption has been accelerated by the need for equipment that allows students to visualize DNA and protein gels safely and efficiently, while accommodating high-throughput laboratory sessions. The popularity of this segment is further supported by the cost-effectiveness, durability, and ease of operation offered by modern transilluminators, which allow multiple students to work simultaneously without compromising experimental accuracy.

With the increasing integration of technology-enhanced learning and virtual lab simulations complementing hands-on training, the demand for reliable and adaptable transilluminators has expanded The growth of this segment is expected to continue as educational institutions prioritize curriculum modernization, safety, and reproducible experimental outcomes, reinforcing the segment’s leadership in the market.
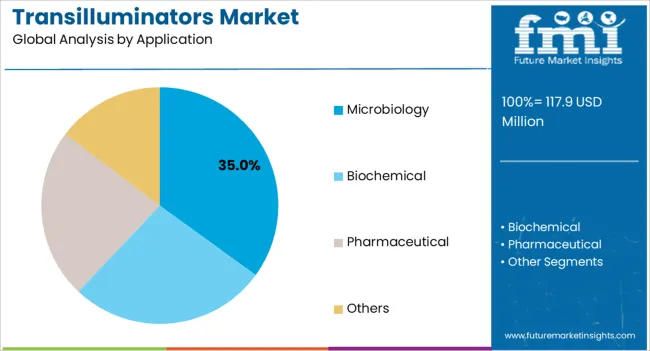
Insights into the Microbiology Segment

Transilluminators Market Analysis By Application

The Microbiology application segment is projected to hold 35.0% of the Transilluminators market revenue in 2025, establishing it as the leading application area. This leadership has been driven by the widespread use of transilluminators in microbiology laboratories for visualization of bacterial DNA, plasmids, and other biomolecular assays.

Adoption has been supported by the enhanced sensitivity and resolution of modern devices, which facilitate precise experimental observations and reliable data collection. The segment’s growth has also been influenced by the increasing focus on research in microbial genetics, antibiotic resistance studies, and biotechnology applications within academic and commercial laboratories.

Additionally, the integration of LED-based illumination systems and compatibility with multiple gel types has improved usability and safety, further driving adoption As research in microbiology continues to expand globally, the demand for advanced transilluminators capable of providing clear visualization and reproducible results is expected to sustain the growth of this segment, solidifying its prominent position in the market.

Market Overview

Transilluminators: Introduction

Ultraviolet transilluminators facilitate the optimum visibility of various electrophoresis gels, such as polyacrylamide and agarose gels. They help visualise the targeted deoxyribonucleic acids and proteins in study samples and specimens under a microscope.

Ultraviolet transilluminators work by emitting high-intensity ultraviolet radiation that passes through the viewing surface. Transilluminators are most frequently used in life science laboratories that are focused on microbiological research and development. Currently, manufacturers are offering stainless steel filter framed transilluminators that are scratch-proof and chemical resistant.

These upgraded solutions are targeted towards the biochemical industry.
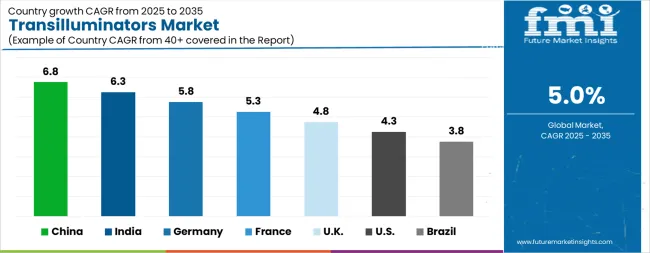
Analysis of Transilluminators Market By Key Countries

Transilluminators Market Cagr Analysis By Country

Country CAGR
China 6.8%
India 6.3%
Germany 5.8%
France 5.3%
UK 4.8%
USA 4.3%
Brazil 3.8%

Country-wise Analysis

The Transilluminators Market is expected to register a CAGR of 5.0% during the forecast period, exhibiting varied country level momentum. China leads with the highest CAGR of 6.8%, followed by India at 6.3%. Developed markets such as Germany, France, and the UK continue to expand steadily, while the USA is likely to grow at consistent rates. Brazil posts the lowest CAGR at 3.8%, yet still underscores a broadly positive trajectory for the global Transilluminators Market. In 2024, Germany held a dominant revenue in the Western Europe market and is expected to grow with a CAGR of 5.8%. The USA Transilluminators Market is estimated to be valued at USD 42.3 million in 2025 and is anticipated to reach a valuation of USD 64.1 million by 2035. Sales are projected to rise at a CAGR of 4.3% over the forecast period between 2025 and 2035. While Japan and South Korea markets are estimated to be valued at USD 6.1 million and USD 3.2 million respectively in 2025.
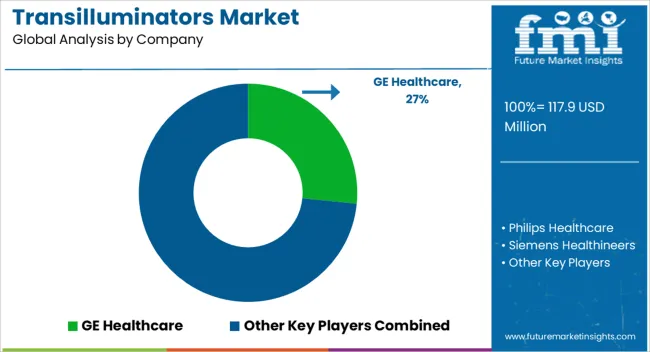
Key Players in the Transilluminators Market

Transilluminators Market Analysis By Company

  • GE Healthcare
  • Philips Healthcare
  • Siemens Healthineers
  • Baxter International Inc.
  • Hill-Rom Holdings, Inc.
  • Veinlite
  • Advin Health Care
  • TransLite LLC
  • Lutech Industries
  • Venoscope LLC

Scope of the Report

Item Value
Quantitative Units USD 117.9 Million
End Use Educational Institutions and Research & Development Laboratories
Application Microbiology, Biochemical, Pharmaceutical, and Others
Regions Covered North America, Europe, Asia-Pacific, Latin America, Middle East & Africa
Country Covered United States, Canada, Germany, France, United Kingdom, China, Japan, India, Brazil, South Africa
Key Companies Profiled GE Healthcare, Philips Healthcare, Siemens Healthineers, Baxter International Inc., Hill-Rom Holdings, Inc., Veinlite, Advin Health Care, TransLite LLC, Lutech Industries, and Venoscope LLC

Transilluminators Market by Segments

End Use:

  • Educational Institutions
  • Research & Development Laboratories

Application:

  • Microbiology
  • Biochemical
  • Pharmaceutical
  • Others

Region:

  • North America
    • USA
    • Canada
    • Mexico
  • Latin America
    • Brazil
    • Chile
    • Rest of Latin America
  • Western Europe
    • Germany
    • UK
    • Italy
    • Spain
    • France
    • Nordic
    • BENELUX
    • Rest of Western Europe
  • Eastern Europe
    • Russia
    • Poland
    • Hungary
    • Balkan & Baltic
    • Rest of Eastern Europe
  • East Asia
    • China
    • Japan
    • South Korea
  • South Asia and Pacific
    • India
    • ASEAN
    • Australia & New Zealand
    • Rest of South Asia and Pacific
  • Middle East & Africa
    • Kingdom of Saudi Arabia
    • Other GCC Countries
    • Turkiye
    • South Africa
    • Other African Union
    • Rest of Middle East & Africa

Frequently Asked Questions

How big is the transilluminators market in 2025?

The global transilluminators market is estimated to be valued at USD 117.9 million in 2025.

What will be the size of transilluminators market in 2035?

The market size for the transilluminators market is projected to reach USD 192.1 million by 2035.

How much will be the transilluminators market growth between 2025 and 2035?

The transilluminators market is expected to grow at a 5.0% CAGR between 2025 and 2035.

What are the key product types in the transilluminators market?

The key product types in transilluminators market are educational institutions and research & development laboratories.

Which application segment to contribute significant share in the transilluminators market in 2025?

In terms of application, microbiology segment to command 35.0% share in the transilluminators market in 2025.

Table of Content

  1. Executive Summary
    • Global Market Outlook
    • Demand-side Trends
    • Supply-side Trends
    • Technology Roadmap Analysis
    • Analysis and Recommendations
  2. Market Overview
    • Market Coverage / Taxonomy
    • Market Definition / Scope / Limitations
  3. Market Background
    • Market Dynamics
      • Drivers
      • Restraints
      • Opportunity
      • Trends
    • Scenario Forecast
      • Demand in Optimistic Scenario
      • Demand in Likely Scenario
      • Demand in Conservative Scenario
    • Opportunity Map Analysis
    • Product Life Cycle Analysis
    • Supply Chain Analysis
    • Investment Feasibility Matrix
    • Value Chain Analysis
    • PESTLE and Porter’s Analysis
    • Regulatory Landscape
    • Regional Parent Market Outlook
    • Production and Consumption Statistics
    • Import and Export Statistics
  4. Global Market Analysis 2020 to 2024 and Forecast, 2025 to 2035
    • Historical Market Size Value (USD Million) Analysis, 2020 to 2024
    • Current and Future Market Size Value (USD Million) Projections, 2025 to 2035
      • Y-o-Y Growth Trend Analysis
      • Absolute $ Opportunity Analysis
  5. Global Market Pricing Analysis 2020 to 2024 and Forecast 2025 to 2035
  6. Global Market Analysis 2020 to 2024 and Forecast 2025 to 2035, By End Use
    • Introduction / Key Findings
    • Historical Market Size Value (USD Million) Analysis By End Use , 2020 to 2024
    • Current and Future Market Size Value (USD Million) Analysis and Forecast By End Use , 2025 to 2035
      • Educational Institutions
      • Research & Development Laboratories
    • Y-o-Y Growth Trend Analysis By End Use , 2020 to 2024
    • Absolute $ Opportunity Analysis By End Use , 2025 to 2035
  7. Global Market Analysis 2020 to 2024 and Forecast 2025 to 2035, By Application
    • Introduction / Key Findings
    • Historical Market Size Value (USD Million) Analysis By Application, 2020 to 2024
    • Current and Future Market Size Value (USD Million) Analysis and Forecast By Application, 2025 to 2035
      • Microbiology
      • Biochemical
      • Pharmaceutical
      • Others
    • Y-o-Y Growth Trend Analysis By Application, 2020 to 2024
    • Absolute $ Opportunity Analysis By Application, 2025 to 2035
  8. Global Market Analysis 2020 to 2024 and Forecast 2025 to 2035, By Region
    • Introduction
    • Historical Market Size Value (USD Million) Analysis By Region, 2020 to 2024
    • Current Market Size Value (USD Million) Analysis and Forecast By Region, 2025 to 2035
      • North America
      • Latin America
      • Western Europe
      • Eastern Europe
      • East Asia
      • South Asia and Pacific
      • Middle East & Africa
    • Market Attractiveness Analysis By Region
  9. North America Market Analysis 2020 to 2024 and Forecast 2025 to 2035, By Country
    • Historical Market Size Value (USD Million) Trend Analysis By Market Taxonomy, 2020 to 2024
    • Market Size Value (USD Million) Forecast By Market Taxonomy, 2025 to 2035
      • By Country
        • USA
        • Canada
        • Mexico
      • By End Use
      • By Application
    • Market Attractiveness Analysis
      • By Country
      • By End Use
      • By Application
    • Key Takeaways
  10. Latin America Market Analysis 2020 to 2024 and Forecast 2025 to 2035, By Country
    • Historical Market Size Value (USD Million) Trend Analysis By Market Taxonomy, 2020 to 2024
    • Market Size Value (USD Million) Forecast By Market Taxonomy, 2025 to 2035
      • By Country
        • Brazil
        • Chile
        • Rest of Latin America
      • By End Use
      • By Application
    • Market Attractiveness Analysis
      • By Country
      • By End Use
      • By Application
    • Key Takeaways
  11. Western Europe Market Analysis 2020 to 2024 and Forecast 2025 to 2035, By Country
    • Historical Market Size Value (USD Million) Trend Analysis By Market Taxonomy, 2020 to 2024
    • Market Size Value (USD Million) Forecast By Market Taxonomy, 2025 to 2035
      • By Country
        • Germany
        • UK
        • Italy
        • Spain
        • France
        • Nordic
        • BENELUX
        • Rest of Western Europe
      • By End Use
      • By Application
    • Market Attractiveness Analysis
      • By Country
      • By End Use
      • By Application
    • Key Takeaways
  12. Eastern Europe Market Analysis 2020 to 2024 and Forecast 2025 to 2035, By Country
    • Historical Market Size Value (USD Million) Trend Analysis By Market Taxonomy, 2020 to 2024
    • Market Size Value (USD Million) Forecast By Market Taxonomy, 2025 to 2035
      • By Country
        • Russia
        • Poland
        • Hungary
        • Balkan & Baltic
        • Rest of Eastern Europe
      • By End Use
      • By Application
    • Market Attractiveness Analysis
      • By Country
      • By End Use
      • By Application
    • Key Takeaways
  13. East Asia Market Analysis 2020 to 2024 and Forecast 2025 to 2035, By Country
    • Historical Market Size Value (USD Million) Trend Analysis By Market Taxonomy, 2020 to 2024
    • Market Size Value (USD Million) Forecast By Market Taxonomy, 2025 to 2035
      • By Country
        • China
        • Japan
        • South Korea
      • By End Use
      • By Application
    • Market Attractiveness Analysis
      • By Country
      • By End Use
      • By Application
    • Key Takeaways
  14. South Asia and Pacific Market Analysis 2020 to 2024 and Forecast 2025 to 2035, By Country
    • Historical Market Size Value (USD Million) Trend Analysis By Market Taxonomy, 2020 to 2024
    • Market Size Value (USD Million) Forecast By Market Taxonomy, 2025 to 2035
      • By Country
        • India
        • ASEAN
        • Australia & New Zealand
        • Rest of South Asia and Pacific
      • By End Use
      • By Application
    • Market Attractiveness Analysis
      • By Country
      • By End Use
      • By Application
    • Key Takeaways
  15. Middle East & Africa Market Analysis 2020 to 2024 and Forecast 2025 to 2035, By Country
    • Historical Market Size Value (USD Million) Trend Analysis By Market Taxonomy, 2020 to 2024
    • Market Size Value (USD Million) Forecast By Market Taxonomy, 2025 to 2035
      • By Country
        • Kingdom of Saudi Arabia
        • Other GCC Countries
        • Turkiye
        • South Africa
        • Other African Union
        • Rest of Middle East & Africa
      • By End Use
      • By Application
    • Market Attractiveness Analysis
      • By Country
      • By End Use
      • By Application
    • Key Takeaways
  16. Key Countries Market Analysis
    • USA
      • Pricing Analysis
      • Market Share Analysis, 2024
        • By End Use
        • By Application
    • Canada
      • Pricing Analysis
      • Market Share Analysis, 2024
        • By End Use
        • By Application
    • Mexico
      • Pricing Analysis
      • Market Share Analysis, 2024
        • By End Use
        • By Application
    • Brazil
      • Pricing Analysis
      • Market Share Analysis, 2024
        • By End Use
        • By Application
    • Chile
      • Pricing Analysis
      • Market Share Analysis, 2024
        • By End Use
        • By Application
    • Germany
      • Pricing Analysis
      • Market Share Analysis, 2024
        • By End Use
        • By Application
    • UK
      • Pricing Analysis
      • Market Share Analysis, 2024
        • By End Use
        • By Application
    • Italy
      • Pricing Analysis
      • Market Share Analysis, 2024
        • By End Use
        • By Application
    • Spain
      • Pricing Analysis
      • Market Share Analysis, 2024
        • By End Use
        • By Application
    • France
      • Pricing Analysis
      • Market Share Analysis, 2024
        • By End Use
        • By Application
    • India
      • Pricing Analysis
      • Market Share Analysis, 2024
        • By End Use
        • By Application
    • ASEAN
      • Pricing Analysis
      • Market Share Analysis, 2024
        • By End Use
        • By Application
    • Australia & New Zealand
      • Pricing Analysis
      • Market Share Analysis, 2024
        • By End Use
        • By Application
    • China
      • Pricing Analysis
      • Market Share Analysis, 2024
        • By End Use
        • By Application
    • Japan
      • Pricing Analysis
      • Market Share Analysis, 2024
        • By End Use
        • By Application
    • South Korea
      • Pricing Analysis
      • Market Share Analysis, 2024
        • By End Use
        • By Application
    • Russia
      • Pricing Analysis
      • Market Share Analysis, 2024
        • By End Use
        • By Application
    • Poland
      • Pricing Analysis
      • Market Share Analysis, 2024
        • By End Use
        • By Application
    • Hungary
      • Pricing Analysis
      • Market Share Analysis, 2024
        • By End Use
        • By Application
    • Kingdom of Saudi Arabia
      • Pricing Analysis
      • Market Share Analysis, 2024
        • By End Use
        • By Application
    • Turkiye
      • Pricing Analysis
      • Market Share Analysis, 2024
        • By End Use
        • By Application
    • South Africa
      • Pricing Analysis
      • Market Share Analysis, 2024
        • By End Use
        • By Application
  17. Market Structure Analysis
    • Competition Dashboard
    • Competition Benchmarking
    • Market Share Analysis of Top Players
      • By Regional
      • By End Use
      • By Application
  18. Competition Analysis
    • Competition Deep Dive
      • GE Healthcare
        • Overview
        • Product Portfolio
        • Profitability by Market Segments (Product/Age /Sales Channel/Region)
        • Sales Footprint
        • Strategy Overview
          • Marketing Strategy
          • Product Strategy
          • Channel Strategy
      • Philips Healthcare
      • Siemens Healthineers
      • Baxter International Inc.
      • Hill-Rom Holdings, Inc.
      • Veinlite
      • Advin Health Care
      • TransLite LLC
      • Lutech Industries
      • Venoscope LLC
  19. Assumptions & Acronyms Used
  20. Research Methodology

List of Tables

  • Table 1: Global Market Value (USD Million) Forecast by Region, 2020 to 2035
  • Table 2: Global Market Value (USD Million) Forecast by End Use , 2020 to 2035
  • Table 3: Global Market Value (USD Million) Forecast by Application, 2020 to 2035
  • Table 4: North America Market Value (USD Million) Forecast by Country, 2020 to 2035
  • Table 5: North America Market Value (USD Million) Forecast by End Use , 2020 to 2035
  • Table 6: North America Market Value (USD Million) Forecast by Application, 2020 to 2035
  • Table 7: Latin America Market Value (USD Million) Forecast by Country, 2020 to 2035
  • Table 8: Latin America Market Value (USD Million) Forecast by End Use , 2020 to 2035
  • Table 9: Latin America Market Value (USD Million) Forecast by Application, 2020 to 2035
  • Table 10: Western Europe Market Value (USD Million) Forecast by Country, 2020 to 2035
  • Table 11: Western Europe Market Value (USD Million) Forecast by End Use , 2020 to 2035
  • Table 12: Western Europe Market Value (USD Million) Forecast by Application, 2020 to 2035
  • Table 13: Eastern Europe Market Value (USD Million) Forecast by Country, 2020 to 2035
  • Table 14: Eastern Europe Market Value (USD Million) Forecast by End Use , 2020 to 2035
  • Table 15: Eastern Europe Market Value (USD Million) Forecast by Application, 2020 to 2035
  • Table 16: East Asia Market Value (USD Million) Forecast by Country, 2020 to 2035
  • Table 17: East Asia Market Value (USD Million) Forecast by End Use , 2020 to 2035
  • Table 18: East Asia Market Value (USD Million) Forecast by Application, 2020 to 2035
  • Table 19: South Asia and Pacific Market Value (USD Million) Forecast by Country, 2020 to 2035
  • Table 20: South Asia and Pacific Market Value (USD Million) Forecast by End Use , 2020 to 2035
  • Table 21: South Asia and Pacific Market Value (USD Million) Forecast by Application, 2020 to 2035
  • Table 22: Middle East & Africa Market Value (USD Million) Forecast by Country, 2020 to 2035
  • Table 23: Middle East & Africa Market Value (USD Million) Forecast by End Use , 2020 to 2035
  • Table 24: Middle East & Africa Market Value (USD Million) Forecast by Application, 2020 to 2035

List of Figures

  • Figure 1: Global Market Pricing Analysis
  • Figure 2: Global Market Value (USD Million) Forecast 2020-2035
  • Figure 3: Global Market Value Share and BPS Analysis by End Use , 2025 and 2035
  • Figure 4: Global Market Y-o-Y Growth Comparison by End Use , 2025-2035
  • Figure 5: Global Market Attractiveness Analysis by End Use
  • Figure 6: Global Market Value Share and BPS Analysis by Application, 2025 and 2035
  • Figure 7: Global Market Y-o-Y Growth Comparison by Application, 2025-2035
  • Figure 8: Global Market Attractiveness Analysis by Application
  • Figure 9: Global Market Value (USD Million) Share and BPS Analysis by Region, 2025 and 2035
  • Figure 10: Global Market Y-o-Y Growth Comparison by Region, 2025-2035
  • Figure 11: Global Market Attractiveness Analysis by Region
  • Figure 12: North America Market Incremental Dollar Opportunity, 2025-2035
  • Figure 13: Latin America Market Incremental Dollar Opportunity, 2025-2035
  • Figure 14: Western Europe Market Incremental Dollar Opportunity, 2025-2035
  • Figure 15: Eastern Europe Market Incremental Dollar Opportunity, 2025-2035
  • Figure 16: East Asia Market Incremental Dollar Opportunity, 2025-2035
  • Figure 17: South Asia and Pacific Market Incremental Dollar Opportunity, 2025-2035
  • Figure 18: Middle East & Africa Market Incremental Dollar Opportunity, 2025-2035
  • Figure 19: North America Market Value Share and BPS Analysis by Country, 2025 and 2035
  • Figure 20: North America Market Value Share and BPS Analysis by End Use , 2025 and 2035
  • Figure 21: North America Market Y-o-Y Growth Comparison by End Use , 2025-2035
  • Figure 22: North America Market Attractiveness Analysis by End Use
  • Figure 23: North America Market Value Share and BPS Analysis by Application, 2025 and 2035
  • Figure 24: North America Market Y-o-Y Growth Comparison by Application, 2025-2035
  • Figure 25: North America Market Attractiveness Analysis by Application
  • Figure 26: Latin America Market Value Share and BPS Analysis by Country, 2025 and 2035
  • Figure 27: Latin America Market Value Share and BPS Analysis by End Use , 2025 and 2035
  • Figure 28: Latin America Market Y-o-Y Growth Comparison by End Use , 2025-2035
  • Figure 29: Latin America Market Attractiveness Analysis by End Use
  • Figure 30: Latin America Market Value Share and BPS Analysis by Application, 2025 and 2035
  • Figure 31: Latin America Market Y-o-Y Growth Comparison by Application, 2025-2035
  • Figure 32: Latin America Market Attractiveness Analysis by Application
  • Figure 33: Western Europe Market Value Share and BPS Analysis by Country, 2025 and 2035
  • Figure 34: Western Europe Market Value Share and BPS Analysis by End Use , 2025 and 2035
  • Figure 35: Western Europe Market Y-o-Y Growth Comparison by End Use , 2025-2035
  • Figure 36: Western Europe Market Attractiveness Analysis by End Use
  • Figure 37: Western Europe Market Value Share and BPS Analysis by Application, 2025 and 2035
  • Figure 38: Western Europe Market Y-o-Y Growth Comparison by Application, 2025-2035
  • Figure 39: Western Europe Market Attractiveness Analysis by Application
  • Figure 40: Eastern Europe Market Value Share and BPS Analysis by Country, 2025 and 2035
  • Figure 41: Eastern Europe Market Value Share and BPS Analysis by End Use , 2025 and 2035
  • Figure 42: Eastern Europe Market Y-o-Y Growth Comparison by End Use , 2025-2035
  • Figure 43: Eastern Europe Market Attractiveness Analysis by End Use
  • Figure 44: Eastern Europe Market Value Share and BPS Analysis by Application, 2025 and 2035
  • Figure 45: Eastern Europe Market Y-o-Y Growth Comparison by Application, 2025-2035
  • Figure 46: Eastern Europe Market Attractiveness Analysis by Application
  • Figure 47: East Asia Market Value Share and BPS Analysis by Country, 2025 and 2035
  • Figure 48: East Asia Market Value Share and BPS Analysis by End Use , 2025 and 2035
  • Figure 49: East Asia Market Y-o-Y Growth Comparison by End Use , 2025-2035
  • Figure 50: East Asia Market Attractiveness Analysis by End Use
  • Figure 51: East Asia Market Value Share and BPS Analysis by Application, 2025 and 2035
  • Figure 52: East Asia Market Y-o-Y Growth Comparison by Application, 2025-2035
  • Figure 53: East Asia Market Attractiveness Analysis by Application
  • Figure 54: South Asia and Pacific Market Value Share and BPS Analysis by Country, 2025 and 2035
  • Figure 55: South Asia and Pacific Market Value Share and BPS Analysis by End Use , 2025 and 2035
  • Figure 56: South Asia and Pacific Market Y-o-Y Growth Comparison by End Use , 2025-2035
  • Figure 57: South Asia and Pacific Market Attractiveness Analysis by End Use
  • Figure 58: South Asia and Pacific Market Value Share and BPS Analysis by Application, 2025 and 2035
  • Figure 59: South Asia and Pacific Market Y-o-Y Growth Comparison by Application, 2025-2035
  • Figure 60: South Asia and Pacific Market Attractiveness Analysis by Application
  • Figure 61: Middle East & Africa Market Value Share and BPS Analysis by Country, 2025 and 2035
  • Figure 62: Middle East & Africa Market Value Share and BPS Analysis by End Use , 2025 and 2035
  • Figure 63: Middle East & Africa Market Y-o-Y Growth Comparison by End Use , 2025-2035
  • Figure 64: Middle East & Africa Market Attractiveness Analysis by End Use
  • Figure 65: Middle East & Africa Market Value Share and BPS Analysis by Application, 2025 and 2035
  • Figure 66: Middle East & Africa Market Y-o-Y Growth Comparison by Application, 2025-2035
  • Figure 67: Middle East & Africa Market Attractiveness Analysis by Application
  • Figure 68: Global Market - Tier Structure Analysis
  • Figure 69: Global Market - Company Share Analysis
Dashboard
Dashboard
Dashboard
Dashboard
Dashboard
Dashboard

Full Research Suite comprises of:

Market outlook & trends analysis

Market outlook & trends analysis

Interviews & case studies

Interviews & case studies

Strategic recommendations

Strategic recommendations

Vendor profiles & capabilities analysis

Vendor profiles & capabilities analysis

5-year forecasts

5-year forecasts

8 regions and 60+ country-level data splits

8 regions and 60+ country-level data splits

Market segment data splits

Market segment data splits

12 months of continuous data updates

12 months of continuous data updates

DELIVERED AS:

PDF EXCEL ONLINE

Full Research Suite


$5000

$7500

$10000

Buy Report Now
Future Market Insights

Transilluminators Market

Chat With MaRIA

Chat With

MaRIA

Hi There, I am MaRIA, Your Market Research Intelligence Assistant. How may I help you?