Turmeric Market Outlook (2023 to 2033)

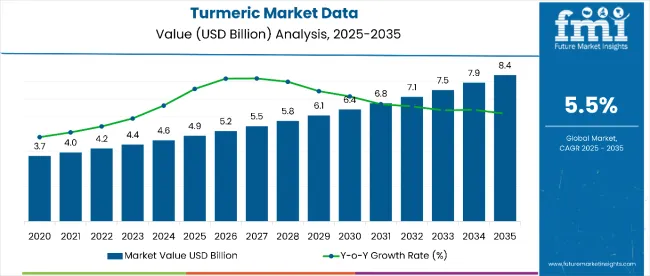
The global turmeric market size is forecast to be valued at US$ 4,419.3 million in 2023. Total turmeric sales worldwide are likely to rise at 5.5% CAGR throughout the forecast period, taking the overall market valuation past US$ 7,579.2 million by 2033.

Growing usage of turmeric in food & beverage products, pharmaceuticals, cosmetics, personal care products, and textiles is driving the global turmeric industry.

Turmeric is a commonly used spice derived from the root of Curcuma longa. It is rich in curcumin and other curcuminoids and is being increasingly used for flavoring and coloring numerous food products.

Turmeric's phytochemistry plays a significant role in health effects. The ingredients in turmeric are known as curcuminoids, which include curcumin, demethoxycurcumin, and bisdemethoxycurcumin. These bioactive compounds have proven to offer significant health benefits.

Turmeric has become an ideal substitute for saffron due to its less inexpensive nature. It is being increasingly used to add flavor and color to seafood, meat products, rice dishes, pickles, etc.

Growing usage of turmeric as a natural food flavoring ingredient coupled with increasing demand for processed food products and beverages is expected to boost the global market during the forecast period.

One of the first features of a product that consumers seem to notice is its color. As the need for clean-label products grows, colors are becoming more than just what the eye can see. Several people are starting to prioritize natural colors when buying products, and businesses of all sizes are taking note.

Consumers are willing to pay more for organic foods because of their health advantages. They prefer products such as organic turmeric to make use of turmeric's therapeutic properties to the fullest extent.

During the projected period, turmeric demand will be boosted by the recent changes in consumer trends and growing knowledge of the advantages of using organic and natural ingredients in food, cosmetics, and medicinal applications.

The market is also anticipated to increase over the forecast period as a result of the rising demand for herbal cosmetics products and the increased use of turmeric in cosmetics.

Like other vibrant plant-based ingredients, turmeric is full of phytonutrients that defend the body from harm by scavenging free radicals (pollution, sunshine), which are responsible for cell damage. It has been linked to a lower risk of developing diseases including cancer and heart disease.

Increasing adoption of turmeric in the pharmaceutical industry is likely to boost sales during the projection period. Thanks to its antiseptic, antibacterial, antioxidant, and anti-inflammatory properties, turmeric finds application in various pharmaceutical products.

Various studies have revealed that turmeric can aid in the management of inflammatory and oxidative conditions, arthritis, hyperlipidemia, metabolic syndrome, and anxiety. This will create lucrative growth opportunities for turmeric manufacturers and suppliers.

Turmeric is also used in home remedies for curing cold, cough, and stomach issues, and several skin conditions. Hence, growing awareness about numerous health benefits of turmeric will help the market to thrive rapidly during the projection period.

Attribute Key Insights
Turmeric Market Estimated Value (2023E) US$ 4,419.3 million
Projected Market Value (2033F) US$ 7,579.2 million
Value-based CAGR (2023 to 2033) 5.5%
Top 3 Countries Marketing Share 30.1%

Don't pay for what you don't need

Customize your report by selecting specific countries or regions and save 30%!

How Has the Market Progressed So Far in 2023?

Market Statistics Details
Jan to Jun (H1), 2021 (A) 3.9%
Jul to Dec (H2), 2021 (A) 4.5%
Jan to Jun (H1), 2022 Projected (P) 4.6%
Jan to Jun (H1), 2022 Outlook (O) 4.3%
Jul to Dec (H2), 2022 Outlook (O) 5.6%
Jul to Dec (H2), 2022 Projected (P) 5.3%
Jan to Jun (H1), 2023 Projected (P) 5.1%
BPS Change : H1, 2022 (O) to H1, 2022 (P) 30
BPS Change : H1, 2022 (O) to H1, 2021 (A) 43
BPS Change: H2, 2022 (O) to H2, 2022 (P) (-) 30
BPS Change: H2, 2022 (O) to H2, 2022 (A) (+) 113

2018 to 2022 Turmeric Sales Outlook Compared to Demand Forecast from 2023 to 2033

Turmeric sales grew at a CAGR of 5.8% during the historical period from 2018 and 2022, as per Future Market Insights’ latest report. For the projection period (2023 to 2033), the global turmeric industry is forecast to expand at 5.5% CAGR, generating lucrative revenues by the end of 2033.

Increasing applications of turmeric across food & beverage industry is driving the global market forward.

Similarly, growing awareness about the potential health benefits of turmeric and the availability of turmeric in a variety of forms are forecast to boost global turmeric sales during the projection period.

Over the past few years, popularity of turmeric has increased significantly due to rising usage of this natural ingredient across thriving food & beverage industry. Turmeric not only helps to provide a distinct flavor to food products but also helps to extend their shelf life.

With growing inclination towards natural food ingredients, demand for turmeric is expected to rise at a significant pace during the projection period. Turmeric manufacturers aim to expand their business by introducing new varieties of turmeric and developing new technologies to achieve stable, improved potency at an economical price.

Nandini Roy Choudhury

Principal Consultant

Talk to Analyst

Find your sweet spots for generating winning opportunities in this market.

Adjacent Markets Overview

Herbs and Spices Market:

Attributes Herbs and Spices Market
CAGR (2023 to 2033) 3.6%
Market Value (2033) US$ 2,43,000 million
Growth Factor Increasing demand for delicious preserved foods and the incorporation of herbs and spices in packaged food products are driving the market forward.
Opportunity Rising awareness about the potential health benefits of herbs and spices will create growth prospects for the market.
Key Trends Growing interest in global cuisines is expected to boost sales of herbs and spices during the projection period.

Spice Oils and Oleoresins Market:

Attributes Spice Oils and Oleoresins Market
CAGR (2023 to 2033) 6.6%
Market Value (2033) US$ 1,523.1 million
Growth Factor Rising applications of spice oils and oleoresins in food & beverage industry is providing a strong impetus to development of the global market.
Opportunity Growing demand for organic products and clean-label ingredients will boost spice oil and oleoresin sales during the assessment period.
Key Trends Increasing usage of spice oils and oleoresins in pharmaceutical, dietary supplements, personal care products, and cosmetics is likely to boost the global market.

Food Flavors Market:

Attributes Food Flavors Market
CAGR (2023 to 2033) 4.9%
Market Value (2033) US$ 17,181 million
Growth Factor Growing demand for food flavors from food & beverage industry is driving the global market forward.
Opportunity Increasing popularity of natural flavors across the world is expected to boost food flavor sales.
Key Trends Rising inclination towards consuming food with improved taste profiles will propel food flavor demand through 2033.

Key Trends Shaping the Global Turmeric Industry

Rise in Aging Population to Boost Demand for Turmeric Industry

According to recent estimates by the United Nations Department of Economic and Social Affairs, currently, there are over 703 million people aged 65 or older. Further, it is estimated that the population aged 65 in several regions will double by 2050.

Manufacturers of turmeric supplements are concentrating on releasing products with turmeric and turmeric extracts that are especially beneficial for the aging population to appeal to the senior market.

Turmeric is recognized for its cleansing properties due to its high antioxidant content, which is crucial in assisting elderly people in getting rid of accumulated waste and toxins from their systems.

As elderly people aim to maintain an active lifestyle and mental acuity, they are utilizing healthy ingredients such as turmeric and turmeric extracts in their diet. This will boost the worldwide turmeric industry during the projection period.

Get the data you need at a Fraction of the cost

Personalize your report by choosing insights you need
and save 40%!

Country-wise Insights:

Region North America
Country United States
CAGR 4.5%
BPS Analysis -127
Market Value (2033) US$ 857.3 million
Region Europe
Country United Kingdom
CAGR 6.1%
BPS Analysis -195
Market Value (2033) US$ 278.4 million
Region Asia Pacific
Country China
CAGR 6.1%
BPS Analysis -26
Market Value (2033) US$ 287.3 million
Region Asia Pacific
Country India
CAGR 9.2%
BPS Analysis -390
Market Value (2033) US$ 198.9 million
Region Asia Pacific
Country Japan
CAGR 7.3%
BPS Analysis +119
Market Value (2033) US$ 154.7 million

What Makes India a Lucrative Market for Turmeric?

Rising Consumption and Export of Turmeric Boosting Sales in India

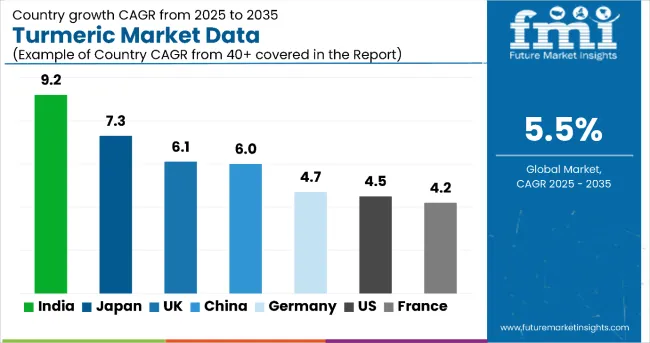
According to Future Market Insights, India’s turmeric market is anticipated to expand at a substantial growth rate of 9.2% CAGR over the forecast period. Total market size in the country is forecast to reach a valuation of US$ 198.9 million by 2033.

Rising usage of turmeric across households and food & beverage sector along with increasing export of spices is a key factor expected to drive demand for turmeric in India market.

The Indian turmeric market is growing swiftly, and the circumstances are favorable for rapid expansion in the coming years. Along with its thriving economy, India has a significant advantage in the turmeric industry as it is the world's leading producer, consumer, and exporter of turmeric.

According to the Trade Promotion Council of India (TPCI), India contributes more than 80% of global turmeric production. Further, the country exported turmeric worth US$ 236 million in 2018.

Due to the expanding disposable income of the middle class and the growing consumer knowledge of the health benefits of turmeric, India is set to emerge as one of the most lucrative markets for turmeric. Manufacturers are likely to use innovative marketing and promotional techniques to boost their revenues.

For the past few centuries, turmeric has been considered India's "golden spice." It is one of the selected Indian products with both mythological and commercial value. In almost every Indian home, turmeric is utilized not only in food but also in cosmetics.

Since ancient times, people in Asia have utilized turmeric, as a key component in Ayurveda, Unani, and traditional medicine. Further, it serves as an indicator of acidity and alkalinity in chemical analysis.

How Will Growth Unfold in the USA Turmeric Market?

Growing Awareness About Health Benefits of Turmeric Fueling Demand in the USA Market

Currently, the USA accounted for a dominant share of 19.4% of the global market and it is anticipated to expand at a steady CAGR of 4.5% during the forecast period. By 2033, the United States turmeric market size is expected to reach US$ 857.3 million.

The market is primarily driven by the health benefits of turmeric and a shift in consumer lifestyles. Similarly, growing focus of people to lose weight, the significance of eating healthy foods, and rising applications of turmeric in cosmetics and pharmaceuticals, are expected to elevate turmeric demand in the country during the forecast period.

In an effort to reduce the expense of their healthcare, consumers are increasingly consuming turmeric and other healthy ingredients to preserve their health. This will help the turmeric industry in the USA expand at a rapid pace.

Further, robust expansion of food service industry in the United States will play a key role in fostering turmeric sales over the next ten years.

What is the Growth Projection for the United Kingdom Market?

Rising Demand for Organic and Natural Ingredients Boosting Turmeric Sales in the United Kingdom

According to Future Market Insights’ latest report, the United Kingdom turmeric market is forecast to accelerate a CAGR of 6.1% between 2023 and 2033, reaching a valuation of US$ 278.4 million by 2033.

Growing usage of turmeric in pharmaceutical sector, increasing popularity of herbal products, and rising demand for organic and natural food ingredients are key factors driving the United Kingdom market.

Similarly, growing popularity of ethnic food is expected to positively influencing turmeric industry in the country.

The United Kingdom is a hub for herbal products. It is considered a prominent importer of herbal medicines and essential oils, which significantly contributes to the growing demand for turmeric.

Turmeric products are becoming increasingly popular in the United Kingdom as a result of the significance of good health with consumers adopting healthier lifestyles and rising demand for organic and natural food ingredients. Further, rising interest in organic Curcuma longa is positively influencing turmeric sales in the country.

Category-wise Insights

Which is the Most Popular Form of Turmeric?

Processed Turmeric Remains the Most Sought After Product Form Worldwide

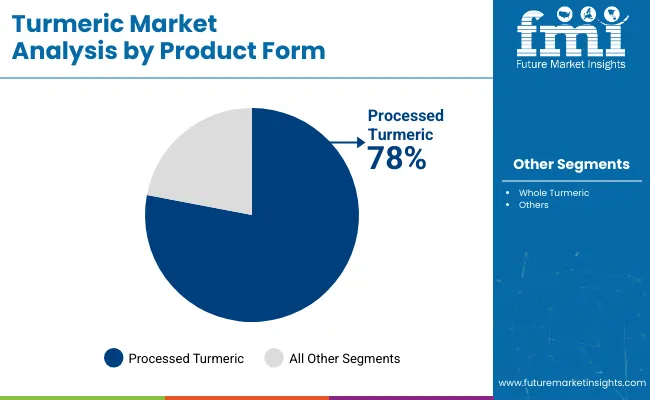
Based on product form, the global market for turmeric market is segmented into whole turmeric and processed turmeric. Among these, processed turmeric segment currently holds around 78.4% share of the global market and it is expected to retain its dominance during the forecast period.

Rising usage of processed turmeric across diverse industries including pharmaceutical, food & beverage, food service, and cosmetics is a key factor driving growth of the target segment.

Which is the Leading End-use Industry for Turmeric?

Most of Turmeric Demand to Arise from Food & Beverage Processing Sector

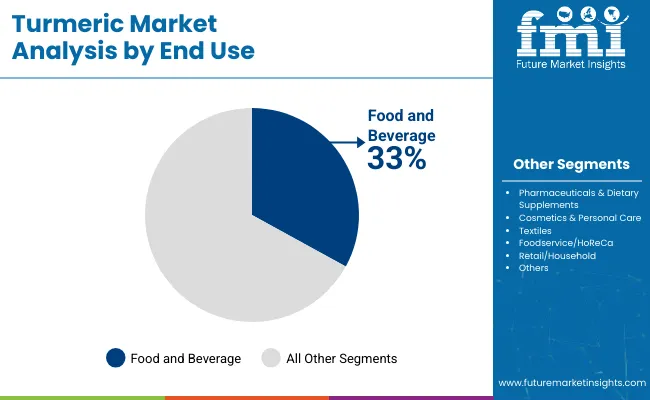
Based on end use, the global turmeric industry is segmented into cosmetics & personal care, food and beverage processing, textiles, pharmaceuticals & dietary supplements, textiles, foodservice/HoReCa, and retail/household.

According to Future Market Insights, food and beverage processing segment dominates the global turmeric industry, accounting for a significant market share of 36.4% in 2023. This is attributed to rapid expansion of food and beverage processing sector and growing usage of turmeric as a spice in processed food products and beverages.

Similarly, rising application of turmeric to flavor or color various foods will aid elevate turmeric demand in the food & beverage processing industry.

Competitive Landscape

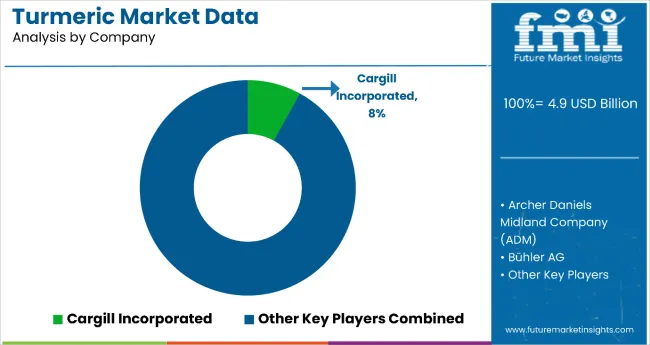
The global turmeric industry is extremely fragmented and competitive due to presence numerous companies. Leading manufacturers of turmeric use a variety of marketing techniques, including new product launches, alliances, partnerships, facility expansions, acquisitions, mergers, and collaborations to gain a competitive edge in the market.

Recent Developments

  • In January 2023, Sunpure South India’s largest edible oil brand entered the spice industry with the launch of turmeric and other powders.
  • In September 2022, Cellavent Healthcare introduced a postbiotic infused fermented turmeric ingredient.

Scope of the Report

Attribute Details
Estimated Market Size (2023) US$ 4,419.3 million
Projected Market Size (2033) US$ 7,579.2 million
Anticipated Growth Rate (2023 to 2033) 5.5% CAGR
Forecast Period 2023 to 2033
Historical Data Available for 2018 to 2022
Market Analysis US$ Million for Value & MT for Volume
Key Regions Covered North America; Latin America; Europe; East Asia; South Asia; Oceania; and the Middle East & Africa
Key Countries Covered USA, Canada, Brazil, Mexico, Argentina, Europe, Germany, United Kingdom, France, Italy, Spain, BENELUX, Nordic, Russia, Poland, China, Japan, South Korea, India, Thailand, Malaysia, Indonesia, Vietnam, Philippines, Singapore, Oceania, Australia, New Zealand, Middle East & Africa, GCC Countries, Türkiye, Egypt, South Africa.
Key Segments Covered Variety, Product Form, Distribution Channel, End User, Nature, and Region
Key Companies Profiled Naturex S.A.; Sabinsa Corporation; Chr. Hansen A/S; Everest Spices; Biomax Life Sciences Ltd.; Sensient Technologies Corporation; ITC Limited; The Archer Daniels Midland Company; Symrise AG; MDH Spices; McCormick & Company; Kancor Ingredients Limited; BOS Natural Flavors (P) Limited; Roha Dyechem Pvt. Ltd.; Frutarom Industries Ltd.; Kalsec, Inc.; DDW The Colour House Corporation; Universal Oleoresins; Ungerer & Company; Vigon International, Inc.; Others
Report Coverage Market Forecast, Company Share Analysis, Competition Intelligence, Drivers Restraints Opportunity Trends Analysis, Market Dynamics and Challenges, and Strategic Growth Initiatives

Turmeric Industry Segmentation

By Variety:

  • Madras Turmeric
  • Alleppey Turmeric
  • West Indian Turmeric
  • Others (Rajapore, BKK, etc.)

By Product Form:

  • Whole Turmeric
  • Processed Turmeric
    • Powder
    • Oleoresin
    • Curcumin
    • Turmeric Oil

By End Use:

  • Food and Beverage Processing
    • Processed Food Products
    • Dairy Products
    • Meat, Poultry, and Seafood
    • Confectionery
    • Baked Goods
    • Sauces, Dressings, and Condiments
    • Spices and Seasoning
    • Beverages
    • Others (Infusions, etc.)
  • Pharmaceuticals & Dietary Supplements
  • Cosmetics & Personal Care
  • Textiles
  • Foodservice/HoReCa
  • Retail/Household

By Distribution Channel:

  • Hypermarkets/Supermarkets
  • Specialty Stores
  • Convenience Stores
  • Online Retail

By Nature:

  • Organic
  • Conventional

By Region:

  • North America
  • Latin America
  • Europe
  • Middle East and Africa
  • East Asia
  • South Asia
  • Oceania

Frequently Asked Questions

What is the Present Turmeric Market Value?

The market is valued at US$ 4,419.3 million in 2023.

Who are the Top Market Players?

Naturex S.A., Sabinsa Corporation, and Chr. Hansen A/S are the top market players.

Which is the Key Segment by End user?

Food and beverage processing is the key end user.

How was the Market’s Historical Performance?

The market registered a 5.8% CAGR From 2018 to 2022.

What is the Estimated Market Share of the United States?

The United States market is likely to hold a 19.4% share through 2033.

Table of Content
1. Executive Summary | Turmeric Market

    1.1. Global Market Outlook

    1.2. Demand Side Trends

    1.3. Supply Side Trends

    1.4. Technology Roadmap

    1.5. Analysis and Recommendations

2. Market Overview

    2.1. Market Coverage / Taxonomy

    2.2. Market Definition

3. Market Dynamics

    3.1. Drivers

        3.1.1. Supply Side Drivers

        3.1.2. Demand Side drivers

        3.1.3. Economic Side Drivers

    3.2. Restraints

    3.3. Opportunity

    3.4. Market trends by Region

    3.5. Forecast Factors - Relevance & Impact

    3.6. Regulations and Policies

4. Global Market - Pricing Analysis

    4.1. Price Point Assessment by Region

        4.1.1. Manufacturer Level Pricing

        4.1.2. Distributor Level Pricing

    4.2. Price Point Assessment by Variety

    4.3. Price Forecast till 2033

5. Value Chain Analysis

    5.1. Operating margins at each node of supply chain

    5.2. List of Active Market Participants

6. Global Market Size (in Value (US$ Million) and Volume (MT) Analysis 2018 to 2022 and Forecast, 2023 to 2033

    6.1. Historical Market Size (in Value (US$ Million) and Volume (MT) Analysis, 2018 to 2022

    6.2. Current and Future Market Size (in Value (US$ Million) and Volume (MT) Analysis, 2023 to 2033

        6.2.1. Y-o-Y Growth Trend Analysis

        6.2.2. Absolute $ Opportunity Analysis

7. Global Market Analysis 2018 to 2022 and Forecast 2023 to 2033, By Variety

    7.1. Introduction / Key Findings

    7.2. Historical Market Size (in Value (US$ Million) and Volume (MT) Analysis by Variety, 2018 to 2022

    7.3. Current and Future Market Size (in Value (US$ Million) and Volume (MT) Analysis and Forecast by Variety, 2023 to 2033

        7.3.1. Madras Turmeric

        7.3.2. Alleppey Turmeric

        7.3.3. West Indian Turmeric

        7.3.4. Others (Rajapore, BKK, etc.)

    7.4. Market Attractiveness Analysis by Variety

8. Global Market Analysis 2018 to 2022 and Forecast 2023 to 2033, By Product Form

    8.1. Introduction / Key Findings

    8.2. Historical Market Size (in Value (US$ Million) and Volume (MT) Analysis by Product Form, 2018 to 2022

    8.3. Current and Future Market Size (in Value (US$ Million) and Volume (MT) Analysis and Forecast by Product Form, 2023 to 2033

        8.3.1. Whole Turmeric

        8.3.2. Processed Turmeric

                8.3.2.1.1. Powder

                8.3.2.1.2. Oleoresin

                8.3.2.1.3. Curcumin

                8.3.2.1.4. Oil

    8.4. Market Attractiveness Analysis by Product Form

9. Global Market Analysis 2018 to 2022 and Forecast 2023 to 2033, By End Use

    9.1. Introduction / Key Findings

    9.2. Historical Market Size (in Value (US$ Million) and Volume (MT) Analysis by End Use, 2018 to 2022

    9.3. Current and Future Market Size (in Value (US$ Million) and Volume (MT) Analysis and Forecast by End Use, 2023 to 2033

        9.3.1. Food and Beverage Processing

                9.3.1.1.1. Processed Food Products

                9.3.1.1.2. Dairy Products

                9.3.1.1.3. Meat, Poultry and Seafood

                9.3.1.1.4. Confectionery

                9.3.1.1.5. Baked Goods

                9.3.1.1.6. Sauces, Dressings and Condiments

                9.3.1.1.7. Spices and Seasoning

                9.3.1.1.8. Beverages

                9.3.1.1.9. Others (Infusions, etc.)

        9.3.2. Pharmaceuticals & Dietary Supplements

        9.3.3. Cosmetics & Personal Care

        9.3.4. Textiles

        9.3.5. Foodservice/HoReCa

        9.3.6. RETAIL/Household

    9.4. Market Attractiveness Analysis by End Use

10. Global Market Analysis 2018 to 2022 and Forecast 2023 to 2033, By Distribution Channel

    10.1. Introduction / Key Findings

    10.2. Historical Market Size (in Value (US$ Million) and Volume (MT) Analysis by Distribution Channel, 2018 to 2022

    10.3. Current and Future Market Size (in Value (US$ Million) and Volume (MT) Analysis and Forecast by Distribution Channel, 2023 to 2033

            10.3.1.1. Hypermarkets/Supermarkets

            10.3.1.2. Specialty Stores

            10.3.1.3. Convenience Stores

            10.3.1.4. Online Retail

    10.4. Market Attractiveness Analysis by Distribution Channel

11. Global Market Analysis 2018 to 2022 and Forecast 2023 to 2033, By Nature

    11.1. Introduction / Key Findings

    11.2. Historical Market Size (in Value (US$ Million) and Volume (MT) Analysis by Nature, 2018 to 2022

    11.3. Current and Future Market Size (in Value (US$ Million) and Volume (MT) Analysis and Forecast by Nature, 2023 to 2033

            11.3.1.1. Organic

            11.3.1.2. Conventional

    11.4. Market Attractiveness Analysis by Nature.

12. Global Market Analysis 2018 to 2022 and Forecast 2023 to 2033, by Region

    12.1. Introduction

    12.2. Historical Market Size (in Value (US$ Million) and Volume (MT) Analysis by Region,

    12.3. Current Market Size (in Value (US$ Million) and Volume (MT) Analysis and Forecast by Region, 2023 to 2033

        12.3.1. North America

        12.3.2. Latin America

        12.3.3. Europe

        12.3.4. East Asia

        12.3.5. South Asia

        12.3.6. Oceania

        12.3.7. Middle East & Africa

    12.4. Market Attractiveness Analysis by Region

13. North America Market Analysis 2018 to 2022 and Forecast 2023 to 2033

    13.1. Introduction

    13.2. Pricing Analysis

    13.3. Historical Market Size (US$ Million) and Volume Trend Analysis by Market Taxonomy, 2018 to 2022

    13.4. Market Size (US$ Million) and Volume Forecast by Market Taxonomy, 2023 to 2033

        13.4.1. By Country

            13.4.1.1. USA

            13.4.1.2. Canada

        13.4.2. By Variety

        13.4.3. By Product Form

        13.4.4. By End Use

        13.4.5. By Distribution Channel

        13.4.6. By Nature

    13.5. Market Attractiveness Analysis

        13.5.1. By Country

        13.5.2. By Variety

        13.5.3. By Product Form

        13.5.4. By End Use

        13.5.5. By Distribution Channel

        13.5.6. By Nature

    13.6. Market Trends

    13.7. Key Market Participants - Intensity Mapping

    13.8. Drivers and Restraints - Impact Analysis

14. Latin America Market Analysis 2018 to 2022 and Forecast 2023 to 2033

    14.1. Introduction

    14.2. Pricing Analysis

    14.3. Historical Market Size (US$ Million) and Volume Trend Analysis by Market Taxonomy, 2018 to 2022

    14.4. Market Size (US$ Million) and Volume Forecast by Market Taxonomy, 2023 to 2033

        14.4.1. By Country

            14.4.1.1. Brazil

            14.4.1.2. Mexico

            14.4.1.3. Colombia

            14.4.1.4. Argentina

            14.4.1.5. Rest of Latin America

        14.4.2. By Variety

        14.4.3. By Product Form

        14.4.4. By End Use

        14.4.5. By Distribution Channel

        14.4.6. By Nature

    14.5. Market Attractiveness Analysis

        14.5.1. By Country

        14.5.2. By Variety

        14.5.3. By Product Form

        14.5.4. By End Use

        14.5.5. By Distribution Channel

        14.5.6. By Nature

    14.6. Market Trends

    14.7. Key Market Participants - Intensity Mapping

    14.8. Drivers and Restraints - Impact Analysis

15. Europe Market Analysis 2018 to 2022 and Forecast 2023 to 2033

    15.1. Introduction

    15.2. Pricing Analysis

    15.3. Historical Market Size (US$ Million) and Volume Trend Analysis by Market Taxonomy, 2018 to 2022

    15.4. Market Size (US$ Million) and Volume Forecast by Market Taxonomy, 2023 to 2033

        15.4.1. By Country

            15.4.1.1. Germany

            15.4.1.2. United Kingdom

            15.4.1.3. France

            15.4.1.4. Italy

            15.4.1.5. Spain

            15.4.1.6. BENELUX

            15.4.1.7. Nordic

            15.4.1.8. Russia

            15.4.1.9. Poland

            15.4.1.10. Rest of Europe

        15.4.2. By Variety

        15.4.3. By Product Form

        15.4.4. By End Use

        15.4.5. By Distribution Channel

        15.4.6. By Nature

    15.5. Market Attractiveness Analysis

        15.5.1. By Country

        15.5.2. By Variety

        15.5.3. By Product Form

        15.5.4. By End Use

        15.5.5. By Distribution Channel

        15.5.6. By Nature

    15.6. Market Trends

    15.7. Key Market Participants - Intensity Mapping

    15.8. Drivers and Restraints - Impact Analysis

16. East Asia Market Analysis 2018 to 2022 and Forecast 2023 to 2033

    16.1. Introduction

    16.2. Pricing Analysis

    16.3. Historical Market Size (US$ Million) and Volume Trend Analysis by Market Taxonomy, 2018 to 2022

    16.4. Market Size (US$ Million) and Volume Forecast by Market Taxonomy, 2023 to 2033

        16.4.1. By Country

            16.4.1.1. China

            16.4.1.2. Japan

            16.4.1.3. South Korea

        16.4.2. By Variety

        16.4.3. By Product Form

        16.4.4. By End Use

        16.4.5. By Distribution Channel

        16.4.6. By Nature

    16.5. Market Attractiveness Analysis

        16.5.1. By Country

        16.5.2. By Variety

        16.5.3. By Product Form

        16.5.4. By End Use

        16.5.5. By Distribution Channel

        16.5.6. By Nature

    16.6. Market Trends

    16.7. Key Market Participants - Intensity Mapping

    16.8. Drivers and Restraints - Impact Analysis

17. South Asia Market Analysis 2018 to 2022 and Forecast 2023 to 2033

    17.1. Introduction

    17.2. Pricing Analysis

    17.3. Historical Market Size (US$ Million) and Volume Trend Analysis by Market Taxonomy, 2018 to 2022

    17.4. Market Size (US$ Million) and Volume Forecast by Market Taxonomy, 2023 to 2033

        17.4.1. By Country

            17.4.1.1. India

            17.4.1.2. Thailand

            17.4.1.3. Malaysia

            17.4.1.4. Indonesia

            17.4.1.5. Singapore

            17.4.1.6. Rest of South Asia

        17.4.2. By Variety

        17.4.3. By Product Form

        17.4.4. By End Use

        17.4.5. By Distribution Channel

        17.4.6. By Nature

    17.5. Market Attractiveness Analysis

        17.5.1. By Country

        17.5.2. By Variety

        17.5.3. By Product Form

        17.5.4. By End Use

        17.5.5. By Distribution Channel

        17.5.6. By Nature

    17.6. Market Trends

    17.7. Key Market Participants - Intensity Mapping

    17.8. Drivers and Restraints - Impact Analysis

18. Oceania Market Analysis 2018 to 2022 and Forecast 2023 to 2033

    18.1. Introduction

    18.2. Pricing Analysis

    18.3. Historical Market Size (US$ Million) and Volume Trend Analysis by Market Taxonomy, 2018 to 2022

    18.4. Market Size (US$ Million) and Volume Forecast by Market Taxonomy, 2023 to 2033

        18.4.1. By Country

            18.4.1.1. Australia

            18.4.1.2. New Zealand

        18.4.2. By Variety

        18.4.3. By Product Form

        18.4.4. By End Use

        18.4.5. By Distribution Channel

        18.4.6. By Nature

    18.5. Market Attractiveness Analysis

        18.5.1. By Country

        18.5.2. By Variety

        18.5.3. By Product Form

        18.5.4. By End Use

        18.5.5. By Distribution Channel

        18.5.6. By Nature

    18.6. Market Trends

    18.7. Key Market Participants - Intensity Mapping

    18.8. Drivers and Restraints - Impact Analysis

19. Middle East & Africa Market Analysis 2018 to 2022 and Forecast 2023 to 2033

    19.1. Introduction

    19.2. Pricing Analysis

    19.3. Historical Market Size (US$ Million) and Volume Trend Analysis by Market Taxonomy, 2018 to 2022

    19.4. Market Size (US$ Million) and Volume Forecast by Market Taxonomy, 2023 to 2033

        19.4.1. By Country

            19.4.1.1. United Arab Emirates

            19.4.1.2. Saudi Arabia

            19.4.1.3. Other GCC Countries

            19.4.1.4. North Africa

            19.4.1.5. South Africa

            19.4.1.6. Central Africa

        19.4.2. By Variety

        19.4.3. By Product Form

        19.4.4. By End Use

        19.4.5. By Distribution Channel

        19.4.6. By Nature

    19.5. Market Attractiveness Analysis

        19.5.1. By Country

        19.5.2. By Variety

        19.5.3. By Product Form

        19.5.4. By End Use

        19.5.5. By Distribution Channel

        19.5.6. By Nature

    19.6. Market Trends

    19.7. Key Market Participants - Intensity Mapping

    19.8. Drivers and Restraints - Impact Analysis

20. Country-level Market Analysis (2018 to 2022 and Forecast 2023 to 2033)

    20.1. USA Market Analysis

        20.1.1. By Variety

        20.1.2. By Product Form

        20.1.3. By End Use

        20.1.4. By Distribution Channel

        20.1.5. By Nature

    20.2. Canada Market Analysis

        20.2.1. By Variety

        20.2.2. By Product Form

        20.2.3. By End Use

        20.2.4. By Distribution Channel

        20.2.5. By Nature

    20.3. Brazil Market Analysis

        20.3.1. By Variety

        20.3.2. By Product Form

        20.3.3. By End Use

        20.3.4. By Distribution Channel

        20.3.5. By Nature

    20.4. Mexico Market Analysis

        20.4.1. By Variety

        20.4.2. By Product Form

        20.4.3. By End Use

        20.4.4. By Distribution Channel

        20.4.5. By Nature

    20.5. Colombia Market Analysis

        20.5.1. By Variety

        20.5.2. By Product Form

        20.5.3. By End Use

        20.5.4. By Distribution Channel

        20.5.5. By Nature

    20.6. Argentina Market Analysis

        20.6.1. By Variety

        20.6.2. By Product Form

        20.6.3. By End Use

        20.6.4. By Distribution Channel

        20.6.5. By Nature

    20.7. Germany Market Analysis

        20.7.1. By Variety

        20.7.2. By Product Form

        20.7.3. By End Use

        20.7.4. By Distribution Channel

        20.7.5. By Nature

    20.8. United Kingdom Market Analysis

        20.8.1. By Variety

        20.8.2. By Product Form

        20.8.3. By End Use

        20.8.4. By Distribution Channel

        20.8.5. By Nature

    20.9. France Market Analysis

        20.9.1. By Variety

        20.9.2. By Product Form

        20.9.3. By End Use

        20.9.4. By Distribution Channel

        20.9.5. By Nature

    20.10. Italy Market Analysis

        20.10.1. By Variety

        20.10.2. By Product Form

        20.10.3. By End Use

        20.10.4. By Price Range

        20.10.5. By Distribution Channel

        20.10.6. By Nature

    20.11. Spain Market Analysis

        20.11.1. By Variety

        20.11.2. By Product Form

        20.11.3. By End Use

        20.11.4. By Distribution Channel

        20.11.5. By Nature

    20.12. Belgium Market Analysis

        20.12.1. By Variety

        20.12.2. By Product Form

        20.12.3. By End Use

        20.12.4. By Distribution Channel

        20.12.5. By Nature

    20.13. Netherlands Market Analysis

        20.13.1. By Variety

        20.13.2. By Product Form

        20.13.3. By End Use

        20.13.4. By Distribution Channel

        20.13.5. By Nature

    20.14. Nordic Market Analysis

        20.14.1. By Variety

        20.14.2. By Product Form

        20.14.3. By End Use

        20.14.4. By Distribution Channel

        20.14.5. By Nature

    20.15. Russia Region Market Analysis

        20.15.1. By Variety

        20.15.2. By Product Form

        20.15.3. By End Use

        20.15.4. By Distribution Channel

        20.15.5. By Nature

    20.16. Poland Market Analysis

        20.16.1. By Variety

        20.16.2. By Product Form

        20.16.3. By End Use

        20.16.4. By Distribution Channel

        20.16.5. By Nature

    20.17. Ukraine Market Analysis

        20.17.1. By Variety

        20.17.2. By Product Form

        20.17.3. By End Use

        20.17.4. By Distribution Channel

        20.17.5. By Nature

    20.18. China Market Analysis

        20.18.1. By Variety

        20.18.2. By Product Form

        20.18.3. By End Use

        20.18.4. By Distribution Channel

        20.18.5. By Nature

    20.19. Japan Market Analysis

        20.19.1. By Variety

        20.19.2. By Product Form

        20.19.3. By End Use

        20.19.4. By Distribution Channel

        20.19.5. By Nature

    20.20. China Market Analysis

        20.20.1. By Variety

        20.20.2. By Product Form

        20.20.3. By End Use

        20.20.4. By Distribution Channel

        20.20.5. By Nature

    20.21. South Korea Market Analysis

        20.21.1. By Variety

        20.21.2. By Product Form

        20.21.3. By End Use

        20.21.4. By Distribution Channel

        20.21.5. By Nature

    20.22. India Market Analysis

        20.22.1. By Variety

        20.22.2. By Product Form

        20.22.3. By End Use

        20.22.4. By Distribution Channel

        20.22.5. By Nature

    20.23. Thailand Market Analysis

        20.23.1. By Variety

        20.23.2. By Product Form

        20.23.3. By End Use

        20.23.4. By Distribution Channel

        20.23.5. By Nature

    20.24. Malaysia Market Analysis

        20.24.1. By Variety

        20.24.2. By Product Form

        20.24.3. By End Use

        20.24.4. By Distribution Channel

        20.24.5. By Nature

    20.25. Indonesia Market Analysis

        20.25.1. By Variety

        20.25.2. By Product Form

        20.25.3. By End Use

        20.25.4. By Distribution Channel

        20.25.5. By Nature

    20.26. Singapore Market Analysis

        20.26.1. By Variety

        20.26.2. By Product Form

        20.26.3. By End Use

        20.26.4. By Distribution Channel

        20.26.5. By Nature

    20.27. Australia Market Analysis

        20.27.1. By Variety

        20.27.2. By Product Form

        20.27.3. By End Use

        20.27.4. By Distribution Channel

        20.27.5. By Nature

    20.28. New Zealand Market Analysis

        20.28.1. By Variety

        20.28.2. By Product Form

        20.28.3. By End Use

        20.28.4. By Distribution Channel

        20.28.5. By Nature

    20.29. United Arab Emirates Market Analysis

        20.29.1. By Variety

        20.29.2. By Product Form

        20.29.3. By End Use

        20.29.4. By Distribution Channel

        20.29.5. By Nature

    20.30. Saudi Arabia Market Analysis

        20.30.1. By Variety

        20.30.2. By Product Form

        20.30.3. By End Use

        20.30.4. By Distribution Channel

        20.30.5. By Nature

21. Market Structure Analysis

    21.1. Global Market Competition - a Dashboard View

    21.2. Industry Structure Analysis

        21.2.1. % tier 1 market players

        21.2.2. % tier 2 market players

        21.2.3. % tier 3 market players

    21.3. Global Market Company Share Analysis

        21.3.1. For Tier 1 Market Players, 2023

        21.3.2. Company Market Share Analysis of Top 5 Players, By Region

    21.4. Key Participants Market Presence (Intensity Mapping) by Region

22. Competition Analysis

    22.1. Competition Dashboard

    22.2. Competition Benchmarking

    22.3. Competition Deep Dive

            22.3.1.1. Product Portfolio

            22.3.1.2. Product Claim

            22.3.1.3. Revenue by Market Segments (Variety/Product Form/End Use/ Distribution Channel/Nature/Region)

            22.3.1.4. Sales Footprint

            22.3.1.5. Strategy Overview

                22.3.1.5.1. Marketing Strategy

                22.3.1.5.2. Product Strategy

                22.3.1.5.3. Channel Strategy

            22.3.1.6. SWOT Analysis

        22.3.2. Sabinsa Corporation

            22.3.2.1. Product Portfolio

            22.3.2.2. Product Claim

            22.3.2.3. Revenue by Market Segments (Variety/Product Form/End Use/ Distribution Channel/Nature/Region)

            22.3.2.4. Sales Footprint

            22.3.2.5. Strategy Overview

                22.3.2.5.1. Marketing Strategy

                22.3.2.5.2. Product Strategy

                22.3.2.5.3. Channel Strategy

            22.3.2.6. SWOT Analysis

        22.3.3. Chr. Hansen A/S

            22.3.3.1. Product Portfolio

            22.3.3.2. Product Claim

            22.3.3.3. Revenue by Market Segments (Variety/Product Form/End Use/ Distribution Channel/Nature/Region)

            22.3.3.4. Sales Footprint

            22.3.3.5. Strategy Overview

                22.3.3.5.1. Marketing Strategy

                22.3.3.5.2. Product Strategy

                22.3.3.5.3. Channel Strategy

            22.3.3.6. SWOT Analysis

        22.3.4. Everest Spices

            22.3.4.1. Product Portfolio

            22.3.4.2. Product Claim

            22.3.4.3. Revenue by Market Segments (Variety/Product Form/End Use/ Distribution Channel/Nature/Region)

            22.3.4.4. Sales Footprint

            22.3.4.5. Strategy Overview

                22.3.4.5.1. Marketing Strategy

                22.3.4.5.2. Product Strategy

                22.3.4.5.3. Channel Strategy

            22.3.4.6. SWOT Analysis

        22.3.5. Biomax Life Sciences Ltd.

            22.3.5.1. Product Portfolio

            22.3.5.2. Product Claim

            22.3.5.3. Revenue by Market Segments (Variety/Product Form/End Use/ Distribution Channel/Nature/Region)

            22.3.5.4. Sales Footprint

            22.3.5.5. Strategy Overview

                22.3.5.5.1. Marketing Strategy

                22.3.5.5.2. Product Strategy

                22.3.5.5.3. Channel Strategy

            22.3.5.6. SWOT Analysis

        22.3.6. Sensient Technologies Corporation

            22.3.6.1. Product Portfolio

            22.3.6.2. Product Claim

            22.3.6.3. Revenue by Market Segments (Variety/Product Form/End Use/ Distribution Channel/Nature/Region)

            22.3.6.4. Sales Footprint

            22.3.6.5. Strategy Overview

                22.3.6.5.1. Marketing Strategy

                22.3.6.5.2. Product Strategy

                22.3.6.5.3. Channel Strategy

            22.3.6.6. SWOT Analysis

        22.3.7. ITC Limited

            22.3.7.1. Product Portfolio

            22.3.7.2. Product Claim

            22.3.7.3. Revenue by Market Segments (Variety/Product Form/End Use/ Distribution Channel/Nature/Region)

            22.3.7.4. Sales Footprint

            22.3.7.5. Strategy Overview

                22.3.7.5.1. Marketing Strategy

                22.3.7.5.2. Product Strategy

                22.3.7.5.3. Channel Strategy

            22.3.7.6. SWOT Analysis

        22.3.8. The Archer Daniels Midland Company

            22.3.8.1. Product Portfolio

            22.3.8.2. Product Claim

            22.3.8.3. Revenue by Market Segments (Variety/Product Form/End Use/ Distribution Channel/Nature/Region)

            22.3.8.4. Sales Footprint

            22.3.8.5. Strategy Overview

                22.3.8.5.1. Marketing Strategy

                22.3.8.5.2. Product Strategy

                22.3.8.5.3. Channel Strategy

            22.3.8.6. SWOT Analysis

        22.3.9. Symrise AG

            22.3.9.1. Product Portfolio

            22.3.9.2. Product Claim

            22.3.9.3. Revenue by Market Segments (Variety/Product Form/End Use/ Distribution Channel/Nature/Region)

            22.3.9.4. Sales Footprint

            22.3.9.5. Strategy Overview

                22.3.9.5.1. Marketing Strategy

                22.3.9.5.2. Product Strategy

                22.3.9.5.3. Channel Strategy

            22.3.9.6. SWOT Analysis

        22.3.10. MDH Spices

            22.3.10.1. Product Portfolio

            22.3.10.2. Product Claim

            22.3.10.3. Revenue by Market Segments (Variety/Product Form/End Use/ Distribution Channel/Nature/Region)

            22.3.10.4. Sales Footprint

            22.3.10.5. Strategy Overview

                22.3.10.5.1. Marketing Strategy

                22.3.10.5.2. Product Strategy

                22.3.10.5.3. Channel Strategy

            22.3.10.6. SWOT Analysis

        22.3.11. McCormick & Company

            22.3.11.1. Product Portfolio

            22.3.11.2. Product Claim

            22.3.11.3. Revenue by Market Segments (Variety/Product Form/End Use/ Distribution Channel/Nature/Region)

            22.3.11.4. Sales Footprint

            22.3.11.5. Strategy Overview

                22.3.11.5.1. Marketing Strategy

                22.3.11.5.2. Product Strategy

                22.3.11.5.3. Channel Strategy

            22.3.11.6. SWOT Analysis

        22.3.12. Kancor Ingredients Limited

            22.3.12.1. Product Portfolio

            22.3.12.2. Product Claim

            22.3.12.3. Revenue by Market Segments (Variety/Product Form/End Use/ Distribution Channel/Nature/Region)

            22.3.12.4. Sales Footprint

            22.3.12.5. Strategy Overview

                22.3.12.5.1. Marketing Strategy

                22.3.12.5.2. Product Strategy

                22.3.12.5.3. Channel Strategy

            22.3.12.6. SWOT Analysis

        22.3.13. BOS Natural Flavors (P) Limited

            22.3.13.1. Product Portfolio

            22.3.13.2. Product Claim

            22.3.13.3. Revenue by Market Segments (Variety/Product Form/End Use/ Distribution Channel/Nature/Region)

            22.3.13.4. Sales Footprint

            22.3.13.5. Strategy Overview

                22.3.13.5.1. Marketing Strategy

                22.3.13.5.2. Product Strategy

                22.3.13.5.3. Channel Strategy

            22.3.13.6. SWOT Analysis

        22.3.14. Roha Dyechem Pvt. Ltd.

            22.3.14.1. Product Portfolio

            22.3.14.2. Product Claim

            22.3.14.3. Revenue by Market Segments (Variety/Product Form/End Use/ Distribution Channel/Nature/Region)

            22.3.14.4. Sales Footprint

            22.3.14.5. Strategy Overview

                22.3.14.5.1. Marketing Strategy

                22.3.14.5.2. Product Strategy

                22.3.14.5.3. Channel Strategy

            22.3.14.6. SWOT Analysis

        22.3.15. Frutarom Industries Ltd.

            22.3.15.1. Product Portfolio

            22.3.15.2. Product Claim

            22.3.15.3. Revenue by Market Segments (Variety/Product Form/End Use/ Distribution Channel/Nature/Region)

            22.3.15.4. Sales Footprint

            22.3.15.5. Strategy Overview

                22.3.15.5.1. Marketing Strategy

                22.3.15.5.2. Product Strategy

                22.3.15.5.3. Channel Strategy

            22.3.15.6. SWOT Analysis

        22.3.16. Kalsec, Inc.

            22.3.16.1. Product Portfolio

            22.3.16.2. Product Claim

            22.3.16.3. Revenue by Market Segments (Variety/Product Form/End Use/ Distribution Channel/Nature/Region)

            22.3.16.4. Sales Footprint

            22.3.16.5. Strategy Overview

                22.3.16.5.1. Marketing Strategy

                22.3.16.5.2. Product Strategy

                22.3.16.5.3. Channel Strategy

            22.3.16.6. SWOT Analysis

        22.3.17. DDW The Colour House Corporation

            22.3.17.1. Product Portfolio

            22.3.17.2. Product Claim

            22.3.17.3. Revenue by Market Segments (Variety/Product Form/End Use/ Distribution Channel/Nature/Region)

            22.3.17.4. Sales Footprint

            22.3.17.5. Strategy Overview

                22.3.17.5.1. Marketing Strategy

                22.3.17.5.2. Product Strategy

                22.3.17.5.3. Channel Strategy

            22.3.17.6. SWOT Analysis

        22.3.18. Universal Oleoresins

            22.3.18.1. Product Portfolio

            22.3.18.2. Product Claim

            22.3.18.3. Revenue by Market Segments (Variety/Product Form/End Use/ Distribution Channel/Nature/Region)

            22.3.18.4. Sales Footprint

            22.3.18.5. Strategy Overview

                22.3.18.5.1. Marketing Strategy

                22.3.18.5.2. Product Strategy

                22.3.18.5.3. Channel Strategy

            22.3.18.6. SWOT Analysis

        22.3.19. Ungerer & Company

            22.3.19.1. Product Portfolio

            22.3.19.2. Product Claim

            22.3.19.3. Revenue by Market Segments (Variety/Product Form/End Use/ Distribution Channel/Nature/Region)

            22.3.19.4. Sales Footprint

            22.3.19.5. Strategy Overview

                22.3.19.5.1. Marketing Strategy

                22.3.19.5.2. Product Strategy

                22.3.19.5.3. Channel Strategy

            22.3.19.6. SWOT Analysis

        22.3.20. Vigon International, Inc.

            22.3.20.1. Product Portfolio

            22.3.20.2. Product Claim

            22.3.20.3. Revenue by Market Segments (Variety/Product Form/End Use/ Distribution Channel/Nature/Region)

            22.3.20.4. Sales Footprint

            22.3.20.5. Strategy Overview

                22.3.20.5.1. Marketing Strategy

                22.3.20.5.2. Product Strategy

                22.3.20.5.3. Channel Strategy

            22.3.20.6. SWOT Analysis

23. Assumptions and Acronyms Used

24. Research Methodology
Recommendations

Food and Beverage

Herb and Spice Market

March 2021

REP-GB-12536

March 2024

333 pages

Food and Beverage

Functional Beverage Market

June 2020

REP-GB-103

October 2023

324 pages

Food and Beverage

Spice Oils and Oleoresins Market

September 2020

REP-GB-4510

February 2023

345 pages

Food and Beverage

Food Flavors Market

June 2022

REP-GB-14907

February 2023

350 pages

Explore Food and Beverage Insights

View Reports