Reports

- Global Locations -

Headquarters

Future Market Insights, Inc.

Christiana Corporate, 200
Continental Drive, Suite 401,
Newark, Delaware - 19713,
United States

T: +1-845-579-5705

Americas

Future Market Insights, Inc.

616 Corporate Way, Suite 2-9018,
Valley Cottage, NY 10989, United States

T: +1-347-918-3531

MEA

Future Market Insights

1602-6 Jumeirah Bay X2 Tower, Plot No: JLT-PH2-X2A,
Jumeirah Lakes Towers, Dubai,
United Arab Emirates

Europe

Future Market Insights

3rd Floor, 207 Regent Street,
W1B 3HH London
United Kingdom

T: + 44 (0) 20 8123 9659
D: +44 (0) 20 3287 4268

Asia Pacific

Future Market Insights

IndiaLand Global Tech Park, Unit UG-1, Behind Grand HighStreet, Phase 1, Hinjawadi, MH, Pune – 411057, India

Turpentine Market Outlook for 2024 to 2034

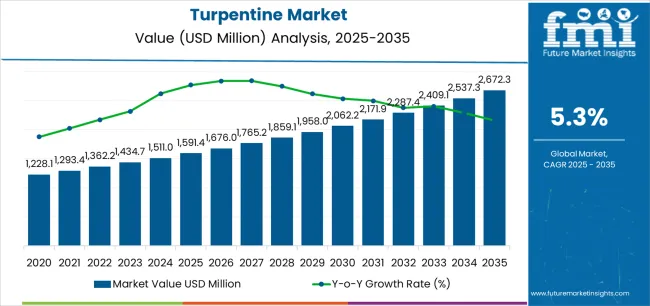
The turpentine market is estimated to be worth US$ 1,506.98 million in 2024. The surge in global construction activities propels the demand for turpentine-based paints and coatings, given its role as a solvent and thinning agent. The sales of turpentine are anticipated to expand at a CAGR of 5.60% through 2034.

The turpentine industry is anticipated to surpass US$ 2,598.64 million by 2034. Turpentine's natural origin aligns with the growing preference for eco-friendly products, contributing to its demand in environmentally conscious markets.

Sales Analysis of the Turpentine

  • Turpentine experiences a surge in demand as industries embrace bio-based solvents, emphasizing reduced environmental impact and enhanced sustainability.
  • Turpentine finds renewed interest in the art world, where artists appreciate its natural origin and unique solvent properties, boosting adoption in traditional painting techniques.
  • Companies are diversifying turpentine applications, exploring its use in pharmaceuticals, adhesives, and flavoring agents, opening new avenues for growth.
  • Beyond traditional applications, turpentine gains traction in the pharmaceutical sector for its potential medicinal properties, sparking research into novel therapeutic uses.
Attributes Details
Turpentine Market Value for 2024 US$ 1,506.98 million
Turpentine Market Size for 2034 US$ 2,598.64 million
Turpentine Market Forecast CAGR for 2024 to 2034 5.60%

Don't pay for what you don't need

Customize your report by selecting specific countries or regions and save 30%!

Historical Performance and Future Growth of the Turpentine Market

Historical CAGR 4.20%
Forecast CAGR 5.60%

The historical CAGR of 4.20% reflects steady but moderate growth in the turpentine market. Factors contributing to this growth include the traditional applications in industries like paint, varnish, and resin production. However, challenges such as environmental concerns and the emergence of alternative solvents curtailed rapid expansion.

The forecast CAGR of 5.60% suggests an optimistic trajectory for the turpentine industry. Anticipated factors driving this growth include the expanding bio-based solvent trend, exploration of turpentine's medicinal properties, and a resurgence in artistic applications. However, challenges like market saturation and the need for sustainable practices must be navigated for sustained success.

Key Trends Influencing the Turpentine Market Growth

  • Bio-Based Solvents Surge

A significant trend is the growing preference for bio-based solvents, positioning turpentine as a sustainable alternative. Industries, especially in paints and coatings, are increasingly shifting toward eco-friendly options. The demand for turpentine rises as it aligns with the global push for sustainable and environmentally friendly solvents, driving adoption across various applications.

  • Collaborations in Cosmetic Formulations

Turpentine is increasingly becoming part of cosmetic formulations, particularly in skincare products, as companies collaborate to harness its natural properties for skin benefits. Collaborations between turpentine suppliers and cosmetic brands lead to the development of innovative products, capitalizing on the potential of turpentine in the beauty and personal care industry.

  • Heritage Preservation in Woodworking

In woodworking, there's a resurgence of using turpentine for preserving and finishing wood, aligning with a preference for traditional craftsmanship and heritage techniques. The heritage-focused trend creates a niche market for turpentine in woodworking communities, where artisans value its historical significance and craftsmanship.

  • Turpentine in Sustainable Packaging

Turpentine is explored as a component in sustainable packaging materials, contributing to the development of eco-friendly packaging solutions for various products. The integration of turpentine in sustainable packaging aligns with circular economy principles, offering an innovative approach to reducing the environmental footprint of packaging materials.

  • Turpentine as a Flavor Enhancer

One of the latest trends in the turpentine industry involves experimenting with turpentine's aromatic properties as a natural flavor enhancer in the food and beverage industry, especially in craft beverages. Turpentine's distinctive aroma is explored for its potential to add unique flavor notes, creating a niche market for artisanal beverages and culinary applications.

Nikhil Kaitwade
Nikhil Kaitwade

Principal Consultant

Talk to Analyst

Find your sweet spots for generating winning opportunities in this market.

Comparative View of the Adjacent Turpentine Market

This section provides a comparative view of the turpentine industry, the gum turpentine oil market, and the India retail mineral turpentine oil market. The table compares these markets based on CAGR through 2034, opportunities, and key trends.

Turpentine Market:

Attributes Turpentine Market
CAGR (2024 to 2034) 5.60%
Opportunity Turpentine's potential as a sustainable and renewable solvent meets the rising demand for eco-friendly solutions in various industrial applications.
Key Trends Turpentine's role in the green chemistry movement fosters collaborations with industries looking to adopt environmentally conscious practices.

Gum Turpentine Oil Market:

Attributes Gum Turpentine Oil Market
CAGR (2024 to 2034) 6%
Opportunity Growing interest in natural and organic products by promoting gum turpentine oil as a key ingredient in eco-friendly and bio-based formulations.
Key Trends The resurgence of gum turpentine oil in artisanal and traditional crafts, where its historical significance becomes a unique selling point.

India Retail Mineral Turpentine Oil Market:

Attributes India Retail Mineral Turpentine Oil Market
CAGR (2024 to 2034) 9.5%
Opportunity The rising demand for mineral turpentine oil in India's retail sector by offering tailored packaging sizes and exploring eCommerce channels for convenient consumer access.
Key Trends The shift toward sustainable practices in India's retail sector prompted the incorporation of mineral turpentine oil in eco-friendly and locally sourced product ranges.

Category-wise Insights

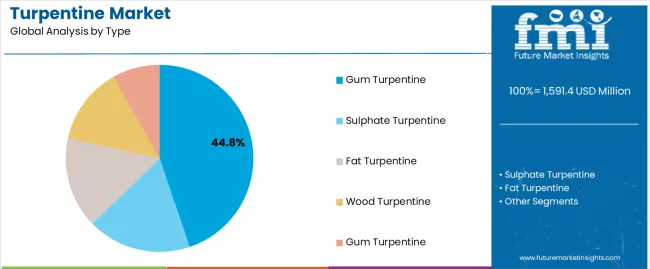
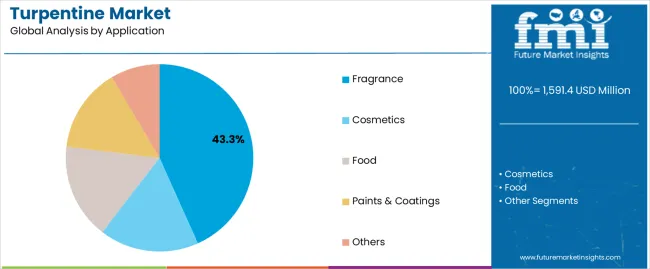
This section provides detailed insights into specific categories in the turpentine industry. While gum turpentine marks dominance with a commanding 44.80% share in 2024, the fragrance application segment is poised for a significant rise.

Gum Turpentine Segment Predicted to Hold Dominance in the Industry in 2024

Product Type Gum Turpentine
Market Share in 2024 44.80%
  • Renowned for its high purity and natural solvent properties, gum turpentine remains the preferred choice for demanding applications like art restoration and high-end finishes.
  • Its long-standing use and association with quality attract professionals and enthusiasts who value traditional methods and materials.
  • From wood finishes and adhesives to pharmaceuticals and cleaning products, gum turpentine's versatility contributes to its widespread use.
  • As a natural product derived from pine trees, gum turpentine's limited availability adds to its perceived value and premium positioning.

Fragrance Segment to Witness Spike in Sales Through 2034

By Application Fragrance
Market Share in 2024 43.30%
  • Increased demand for natural fragrances in personal care and household products creates opportunities for turpentine-based formulations.
  • Growing interest in aromatherapy fuels demand for high-quality, natural essential oils, including turpentine, with its unique scent profile.
  • New product development in scented candles, diffusers, and air fresheners utilizing turpentine-infused fragrances expands the market reach.
  • The use of sustainably sourced and processed turpentine in fragrances resonates with environmentally conscious consumers.

Get the data you need at a Fraction of the cost

Personalize your report by choosing insights you need
and save 40%!

Country-wise Insights

The section analyzes the turpentine market across key countries, including the United States, Germany, China, India, and Australia. The section provides insights into the key factors driving the demand, adoption, and sales of turpentine in these countries.

Countries CAGR
United States 4.5%
Germany 3.3%
China 7.4%
India 8.7%
Australia 6.6%

Turpentine Industry in the United States

The market for turpentine in the United States is anticipated to rise at a CAGR of 4.5% through 2034.

  • The growing popularity of DIY projects and home renovations fuels the demand for turpentine as a versatile cleaning and finishing agent.
  • The historical preservation movement creates a niche market for traditional turpentine used in antique restoration.
  • From oil paints to varnishes, turpentine remains an essential tool for artists and art restoration professionals, sustaining demand.
  • Stringent regulations regarding VOC emissions necessitate the use of high-quality, low-VOC turpentine, shaping the market growth.
  • Specialized applications in the printing and pharmaceutical industries contribute to the steady demand for turpentine in the United States.

Turpentine Industry in Germany

Sales of turpentine in Germany are projected to rise at a CAGR of 3.3% through 2034.

  • Germany's renowned manufacturing sector utilizes turpentine in various industrial applications, ensuring a stable demand base.
  • Emphasis on high-quality and environmentally friendly products drives the market toward premium, sustainable turpentine solutions.
  • German research and development efforts contribute to advancements in turpentine production and applications, shaping the future of the industry.
  • Growing focus on renewable resources creates opportunities for bio-based turpentine alternatives, appealing to environmentally conscious consumers.
  • As a key exporter of manufactured goods, Germany utilizes turpentine in various stages of production, contributing to the overall market size.

Turpentine Industry in China

China turpentine market is likely to witness expansion at a CAGR of 7.4% through 2034.

  • China's insatiable appetite for new infrastructure and urban development fuels the demand for turpentine as a paint thinner and solvent.
  • The thriving furniture industry, renowned for its exquisite craftsmanship, utilizes turpentine in wood finishes and adhesives, driving market growth.
  • From pharmaceuticals to plastics, China's booming chemical industry relies on turpentine's versatile applications, further bolstering the market.
  • Supportive government initiatives promoting domestic production and sustainable practices create a fertile ground for Chinese turpentine manufacturers.
  • Growing disposable income translates to increased demand for home improvement products, pushing turpentine consumption even higher.

Turpentine Industry in India

The turpentine market in India is projected to rise at a CAGR of 8.7% through 2034.

  • India's rapid industrialization fuels diverse applications for turpentine across various sectors, from manufacturing to paints.
  • The burgeoning paint and coatings market, fueled by construction and infrastructure projects, promises a bright future for turpentine demand.
  • The growing preference for natural ingredients in pharmaceuticals opens doors for high-grade Indian turpentine to cater to this promising market.
  • Government initiatives promoting renewable resources and eco-friendly practices create fertile ground for bio-based turpentine solutions.
  • As India emerges as a global exporter of various products, turpentine has the potential to ride this wave and expand its reach further.

Turpentine Industry in Australia

The demand for turpentine in Australia is expected to rise at a CAGR of 6.6% through 2034.

  • Australians' love for outdoor living translates to demand for turpentine in wood treatments and maintenance products.
  • The art sector in Australia fuels the demand for turpentine as a key component in artist supplies and restoration projects.
  • The use of turpentine in niche applications like surfboard wax and natural cleaning products adds to the market diversity.
  • Environmental concerns drive the demand for eco-friendly and sustainably sourced turpentine solutions in Australia.
  • As a net importer of turpentine, Australia presents opportunities for foreign manufacturers catering to its specific needs and preferences.

Competition Outlook of the Turpentine Industry

The turpentine industry is witnessing intensified competition as key players vie for market share and explore innovative strategies to gain a competitive edge. Established companies are focusing on enhancing their production capacities, ensuring a consistent supply chain, and maintaining high-quality standards to strengthen their market position.

The robust demand for turpentine across various applications, including paints, fragrances, and pharmaceuticals, is driving players to optimize production processes and explore sustainable sourcing practices. Companies are also investing in research and development to innovate new turpentine-based products, meeting the evolving demands of end-users.

The emphasis on sustainable practices and the increasing popularity of natural ingredients are shaping the competitive dynamics. Moreover, strategic collaborations and partnerships are emerging as significant trends, allowing companies to expand their product portfolios and geographical reach.

Recent Developments in the Turpentine Market

  • PT. Naval Overseas has recently signed a contract with Vinhconship Group, a Vietnamese shipping company, to transport its products to various destinations in Asia and Europe.
  • Wuzhou Pine Chemicals Ltd. announced to invest in a new production facility in Guangxi Province, which increases its annual output of turpentine by 20,000 tons.
  • Punjab Rosin and Chemicals Works has recently launched a new product called PRC Turpentine Oil, which is a high-quality solvent for paints, varnishes, and lacquers.
  • Forestar Chemical Co., Ltd. partnered with EURO-YSER, a Belgian company that produces and sells turpentine and its derivatives, such as terpenes, terpenoids, and d-limonene. The partnership aims to expand the market share and customer base of both companies in the global turpentine industry.

Key Companies in the Market

  • PT. Naval Overseas
  • Wuzhou Pine Chemicals Ltd.
  • Punjab Rosin and Chemicals Works
  • Wuzhou Sun Shine Forestry & Chemicals Co.
  • Forestar Chemical Co., Ltd.
  • Deqing Yinlong Industrial Co., Ltd.
  • Deqing Jiyuan Synthetic Resin Co., Ltd.
  • Resin Chemicals Co., Ltd
  • CV. Indonesia Pinus
  • Guilin Songquan Forest Chemical Co., Ltd.
  • EURO-YSER.
  • Vinhconship Group

Key Segments

By Product Type:

  • Fat Turpentine
  • Sulphate Turpentine
  • Wood Turpentine
  • Gum Turpentine

By Application:

  • Cosmetics
  • Fragrance
  • Food
  • Paints & Coatings
  • Others

By Region:

  • North America
  • Latin America
  • Europe
  • East Asia
  • South Asia
  • Oceania
  • The Middle East and Africa

Frequently Asked Questions

What is the Market Potential for Turpentine?

The turpentine market is projected to expand at a CAGR of 5.60% between 2024 and 2034.

Which Application Dominates the Turpentine Market?

The fragrance application segment dominates the turpentine industry.

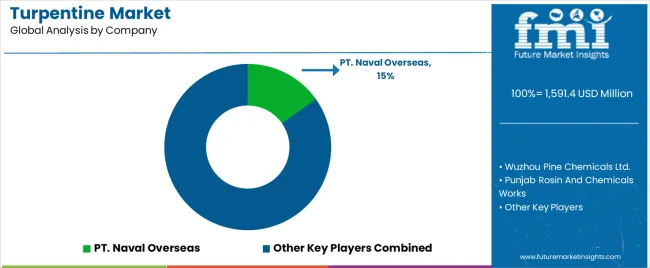
Who are the Top Three Turpentine Manufacturers?

The top 3 turpentine manufacturers are PT. Naval Overseas, Wuzhou Pine Chemicals Ltd., and Punjab Rosin and Chemicals Works.

What is the Turpentine Market Growth Outlook for 2034?

The turpentine market is anticipated to surpass US$ 2,598.64 million by 2034.

Which is the Key Factor Influencing the Demand for Turpentine?

The key factor influencing the demand for turpentine is its versatile applications across industries, including paints, fragrances, and pharmaceuticals.

Why is Gum Turpentine Anticipated to Offer Lucrative Opportunities to the Players?

Due to the versatile applications of gum turpentine in industries such as fragrances, paints, and pharmaceuticals.

Table of Content

1. Executive Summary

    1.1. Global Market Outlook

    1.2. Demand-side Trends

    1.3. Supply-side Trends

    1.4. Technology Roadmap Analysis

    1.5. Analysis and Recommendations

2. Market Overview

    2.1. Market Coverage / Taxonomy

    2.2. Market Definition / Scope / Limitations

3. Market Background

    3.1. Market Dynamics

        3.1.1. Drivers

        3.1.2. Restraints

        3.1.3. Opportunity

        3.1.4. Trends

    3.2. Scenario Forecast

        3.2.1. Demand in Optimistic Scenario

        3.2.2. Demand in Likely Scenario

        3.2.3. Demand in Conservative Scenario

    3.3. Opportunity Map Analysis

    3.4. Product Life Cycle Analysis

    3.5. Supply Chain Analysis

        3.5.1. Supply Side Participants and their Roles

            3.5.1.1. Producers

            3.5.1.2. Mid-Level Participants (Traders/ Agents/ Brokers)

            3.5.1.3. Wholesalers and Distributors

        3.5.2. Value Added and Value Created at Node in the Supply Chain

        3.5.3. List of Raw Material Suppliers

        3.5.4. List of Existing and Potential Buyer’s

    3.6. Investment Feasibility Matrix

    3.7. Value Chain Analysis

        3.7.1. Profit Margin Analysis

        3.7.2. Wholesalers and Distributors

        3.7.3. Retailers

    3.8. PESTLE and Porter’s Analysis

    3.9. Regulatory Landscape

        3.9.1. By Key Regions

        3.9.2. By Key Countries

    3.10. Regional Parent Market Outlook

    3.11. Production and Consumption Statistics

    3.12. Import and Export Statistics

4. Global Market Analysis 2019 to 2023 and Forecast, 2024 to 2034

    4.1. Historical Market Size Value (US$ Million) & Volume (Litre) Analysis, 2019 to 2023

    4.2. Current and Future Market Size Value (US$ Million) & Volume (Litre) Projections, 2024 to 2034

        4.2.1. Y-o-Y Growth Trend Analysis

        4.2.2. Absolute $ Opportunity Analysis

5. Global Market Analysis 2019 to 2023 and Forecast 2024 to 2034, By Type

    5.1. Introduction / Key Findings

    5.2. Historical Market Size Value (US$ Million) & Volume (Litre) Analysis By Type, 2019 to 2023

    5.3. Current and Future Market Size Value (US$ Million) & Volume (Litre) Analysis and Forecast By Type, 2024 to 2034

        5.3.1. Sulfate Turpentine

        5.3.2. Wood Turpentine

        5.3.3. Crude Turpentine

        5.3.4. Carbonization Turpentine

        5.3.5. Others

    5.4. Y-o-Y Growth Trend Analysis By Type, 2019 to 2023

    5.5. Absolute $ Opportunity Analysis By Type, 2024 to 2034

6. Global Market Analysis 2019 to 2023 and Forecast 2024 to 2034, By Application

    6.1. Introduction / Key Findings

    6.2. Historical Market Size Value (US$ Million) & Volume (Litre) Analysis By Application, 2019 to 2023

    6.3. Current and Future Market Size Value (US$ Million) & Volume (Litre) Analysis and Forecast By Application, 2024 to 2034

        6.3.1. Cosmetics

        6.3.2. Fragrance

        6.3.3. Food

        6.3.4. Paints & Coatings

        6.3.5. Others

    6.4. Y-o-Y Growth Trend Analysis By Application, 2019 to 2023

    6.5. Absolute $ Opportunity Analysis By Application, 2024 to 2034

7. Global Market Analysis 2019 to 2023 and Forecast 2024 to 2034, By Region

    7.1. Introduction

    7.2. Historical Market Size Value (US$ Million) & Volume (Litre) Analysis By Region, 2019 to 2023

    7.3. Current Market Size Value (US$ Million) & Volume (Litre) Analysis and Forecast By Region, 2024 to 2034

        7.3.1. North America

        7.3.2. Latin America

        7.3.3. Western Europe

        7.3.4. Eastern Europe

        7.3.5. South Asia and Pacific

        7.3.6. East Asia

        7.3.7. Middle East and Africa

    7.4. Market Attractiveness Analysis By Region

8. North America Market Analysis 2019 to 2023 and Forecast 2024 to 2034, By Country

    8.1. Historical Market Size Value (US$ Million) & Volume (Litre) Trend Analysis By Market Taxonomy, 2019 to 2023

    8.2. Market Size Value (US$ Million) & Volume (Litre) Forecast By Market Taxonomy, 2024 to 2034

        8.2.1. By Country

            8.2.1.1. USA

            8.2.1.2. Canada

        8.2.2. By Type

        8.2.3. By Application

    8.3. Market Attractiveness Analysis

        8.3.1. By Country

        8.3.2. By Type

        8.3.3. By Application

    8.4. Key Takeaways

9. Latin America Market Analysis 2019 to 2023 and Forecast 2024 to 2034, By Country

    9.1. Historical Market Size Value (US$ Million) & Volume (Litre) Trend Analysis By Market Taxonomy, 2019 to 2023

    9.2. Market Size Value (US$ Million) & Volume (Litre) Forecast By Market Taxonomy, 2024 to 2034

        9.2.1. By Country

            9.2.1.1. Brazil

            9.2.1.2. Mexico

            9.2.1.3. Rest of Latin America

        9.2.2. By Type

        9.2.3. By Application

    9.3. Market Attractiveness Analysis

        9.3.1. By Country

        9.3.2. By Type

        9.3.3. By Application

    9.4. Key Takeaways

10. Western Europe Market Analysis 2019 to 2023 and Forecast 2024 to 2034, By Country

    10.1. Historical Market Size Value (US$ Million) & Volume (Litre) Trend Analysis By Market Taxonomy, 2019 to 2023

    10.2. Market Size Value (US$ Million) & Volume (Litre) Forecast By Market Taxonomy, 2024 to 2034

        10.2.1. By Country

            10.2.1.1. Germany

            10.2.1.2. UK

            10.2.1.3. France

            10.2.1.4. Spain

            10.2.1.5. Italy

            10.2.1.6. Rest of Western Europe

        10.2.2. By Type

        10.2.3. By Application

    10.3. Market Attractiveness Analysis

        10.3.1. By Country

        10.3.2. By Type

        10.3.3. By Application

    10.4. Key Takeaways

11. Eastern Europe Market Analysis 2019 to 2023 and Forecast 2024 to 2034, By Country

    11.1. Historical Market Size Value (US$ Million) & Volume (Litre) Trend Analysis By Market Taxonomy, 2019 to 2023

    11.2. Market Size Value (US$ Million) & Volume (Litre) Forecast By Market Taxonomy, 2024 to 2034

        11.2.1. By Country

            11.2.1.1. Poland

            11.2.1.2. Russia

            11.2.1.3. Czech Republic

            11.2.1.4. Romania

            11.2.1.5. Rest of Eastern Europe

        11.2.2. By Type

        11.2.3. By Application

    11.3. Market Attractiveness Analysis

        11.3.1. By Country

        11.3.2. By Type

        11.3.3. By Application

    11.4. Key Takeaways

12. South Asia and Pacific Market Analysis 2019 to 2023 and Forecast 2024 to 2034, By Country

    12.1. Historical Market Size Value (US$ Million) & Volume (Litre) Trend Analysis By Market Taxonomy, 2019 to 2023

    12.2. Market Size Value (US$ Million) & Volume (Litre) Forecast By Market Taxonomy, 2024 to 2034

        12.2.1. By Country

            12.2.1.1. India

            12.2.1.2. Bangladesh

            12.2.1.3. Australia

            12.2.1.4. New Zealand

            12.2.1.5. Rest of South Asia and Pacific

        12.2.2. By Type

        12.2.3. By Application

    12.3. Market Attractiveness Analysis

        12.3.1. By Country

        12.3.2. By Type

        12.3.3. By Application

    12.4. Key Takeaways

13. East Asia Market Analysis 2019 to 2023 and Forecast 2024 to 2034, By Country

    13.1. Historical Market Size Value (US$ Million) & Volume (Litre) Trend Analysis By Market Taxonomy, 2019 to 2023

    13.2. Market Size Value (US$ Million) & Volume (Litre) Forecast By Market Taxonomy, 2024 to 2034

        13.2.1. By Country

            13.2.1.1. China

            13.2.1.2. Japan

            13.2.1.3. South Korea

        13.2.2. By Type

        13.2.3. By Application

    13.3. Market Attractiveness Analysis

        13.3.1. By Country

        13.3.2. By Type

        13.3.3. By Application

    13.4. Key Takeaways

14. Middle East and Africa Market Analysis 2019 to 2023 and Forecast 2024 to 2034, By Country

    14.1. Historical Market Size Value (US$ Million) & Volume (Litre) Trend Analysis By Market Taxonomy, 2019 to 2023

    14.2. Market Size Value (US$ Million) & Volume (Litre) Forecast By Market Taxonomy, 2024 to 2034

        14.2.1. By Country

            14.2.1.1. GCC Countries

            14.2.1.2. South Africa

            14.2.1.3. Israel

            14.2.1.4. Rest of MEA

        14.2.2. By Type

        14.2.3. By Application

    14.3. Market Attractiveness Analysis

        14.3.1. By Country

        14.3.2. By Type

        14.3.3. By Application

    14.4. Key Takeaways

15. Key Countries Market Analysis

    15.1. USA

        15.1.1. Pricing Analysis

        15.1.2. Market Share Analysis, 2023

            15.1.2.1. By Type

            15.1.2.2. By Application

    15.2. Canada

        15.2.1. Pricing Analysis

        15.2.2. Market Share Analysis, 2023

            15.2.2.1. By Type

            15.2.2.2. By Application

    15.3. Brazil

        15.3.1. Pricing Analysis

        15.3.2. Market Share Analysis, 2023

            15.3.2.1. By Type

            15.3.2.2. By Application

    15.4. Mexico

        15.4.1. Pricing Analysis

        15.4.2. Market Share Analysis, 2023

            15.4.2.1. By Type

            15.4.2.2. By Application

    15.5. Germany

        15.5.1. Pricing Analysis

        15.5.2. Market Share Analysis, 2023

            15.5.2.1. By Type

            15.5.2.2. By Application

    15.6. UK

        15.6.1. Pricing Analysis

        15.6.2. Market Share Analysis, 2023

            15.6.2.1. By Type

            15.6.2.2. By Application

    15.7. France

        15.7.1. Pricing Analysis

        15.7.2. Market Share Analysis, 2023

            15.7.2.1. By Type

            15.7.2.2. By Application

    15.8. Spain

        15.8.1. Pricing Analysis

        15.8.2. Market Share Analysis, 2023

            15.8.2.1. By Type

            15.8.2.2. By Application

    15.9. Italy

        15.9.1. Pricing Analysis

        15.9.2. Market Share Analysis, 2023

            15.9.2.1. By Type

            15.9.2.2. By Application

    15.10. Poland

        15.10.1. Pricing Analysis

        15.10.2. Market Share Analysis, 2023

            15.10.2.1. By Type

            15.10.2.2. By Application

    15.11. Russia

        15.11.1. Pricing Analysis

        15.11.2. Market Share Analysis, 2023

            15.11.2.1. By Type

            15.11.2.2. By Application

    15.12. Czech Republic

        15.12.1. Pricing Analysis

        15.12.2. Market Share Analysis, 2023

            15.12.2.1. By Type

            15.12.2.2. By Application

    15.13. Romania

        15.13.1. Pricing Analysis

        15.13.2. Market Share Analysis, 2023

            15.13.2.1. By Type

            15.13.2.2. By Application

    15.14. India

        15.14.1. Pricing Analysis

        15.14.2. Market Share Analysis, 2023

            15.14.2.1. By Type

            15.14.2.2. By Application

    15.15. Bangladesh

        15.15.1. Pricing Analysis

        15.15.2. Market Share Analysis, 2023

            15.15.2.1. By Type

            15.15.2.2. By Application

    15.16. Australia

        15.16.1. Pricing Analysis

        15.16.2. Market Share Analysis, 2023

            15.16.2.1. By Type

            15.16.2.2. By Application

    15.17. New Zealand

        15.17.1. Pricing Analysis

        15.17.2. Market Share Analysis, 2023

            15.17.2.1. By Type

            15.17.2.2. By Application

    15.18. China

        15.18.1. Pricing Analysis

        15.18.2. Market Share Analysis, 2023

            15.18.2.1. By Type

            15.18.2.2. By Application

    15.19. Japan

        15.19.1. Pricing Analysis

        15.19.2. Market Share Analysis, 2023

            15.19.2.1. By Type

            15.19.2.2. By Application

    15.20. South Korea

        15.20.1. Pricing Analysis

        15.20.2. Market Share Analysis, 2023

            15.20.2.1. By Type

            15.20.2.2. By Application

    15.21. GCC Countries

        15.21.1. Pricing Analysis

        15.21.2. Market Share Analysis, 2023

            15.21.2.1. By Type

            15.21.2.2. By Application

    15.22. South Africa

        15.22.1. Pricing Analysis

        15.22.2. Market Share Analysis, 2023

            15.22.2.1. By Type

            15.22.2.2. By Application

    15.23. Israel

        15.23.1. Pricing Analysis

        15.23.2. Market Share Analysis, 2023

            15.23.2.1. By Type

            15.23.2.2. By Application

16. Market Structure Analysis

    16.1. Competition Dashboard

    16.2. Competition Benchmarking

    16.3. Market Share Analysis of Top Players

        16.3.1. By Regional

        16.3.2. By Type

        16.3.3. By Application

17. Competition Analysis

    17.1. Competition Deep Dive

        17.1.1. Eastman Chemical

            17.1.1.1. Overview

            17.1.1.2. Product Portfolio

            17.1.1.3. Profitability by Market Segments

            17.1.1.4. Sales Footprint

            17.1.1.5. Strategy Overview

                17.1.1.5.1. Marketing Strategy

                17.1.1.5.2. Product Strategy

                17.1.1.5.3. Channel Strategy

        17.1.2. Harima Chemicals

            17.1.2.1. Overview

            17.1.2.2. Product Portfolio

            17.1.2.3. Profitability by Market Segments

            17.1.2.4. Sales Footprint

            17.1.2.5. Strategy Overview

                17.1.2.5.1. Marketing Strategy

                17.1.2.5.2. Product Strategy

                17.1.2.5.3. Channel Strategy

        17.1.3. Mentha & Allied Products

            17.1.3.1. Overview

            17.1.3.2. Product Portfolio

            17.1.3.3. Profitability by Market Segments

            17.1.3.4. Sales Footprint

            17.1.3.5. Strategy Overview

                17.1.3.5.1. Marketing Strategy

                17.1.3.5.2. Product Strategy

                17.1.3.5.3. Channel Strategy

        17.1.4. Arakawa Chemical Industries

            17.1.4.1. Overview

            17.1.4.2. Product Portfolio

            17.1.4.3. Profitability by Market Segments

            17.1.4.4. Sales Footprint

            17.1.4.5. Strategy Overview

                17.1.4.5.1. Marketing Strategy

                17.1.4.5.2. Product Strategy

                17.1.4.5.3. Channel Strategy

        17.1.5. Florachem

            17.1.5.1. Overview

            17.1.5.2. Product Portfolio

            17.1.5.3. Profitability by Market Segments

            17.1.5.4. Sales Footprint

            17.1.5.5. Strategy Overview

                17.1.5.5.1. Marketing Strategy

                17.1.5.5.2. Product Strategy

                17.1.5.5.3. Channel Strategy

        17.1.6. Georgia-Pacific Chemicals

            17.1.6.1. Overview

            17.1.6.2. Product Portfolio

            17.1.6.3. Profitability by Market Segments

            17.1.6.4. Sales Footprint

            17.1.6.5. Strategy Overview

                17.1.6.5.1. Marketing Strategy

                17.1.6.5.2. Product Strategy

                17.1.6.5.3. Channel Strategy

        17.1.7. DRT

            17.1.7.1. Overview

            17.1.7.2. Product Portfolio

            17.1.7.3. Profitability by Market Segments

            17.1.7.4. Sales Footprint

            17.1.7.5. Strategy Overview

                17.1.7.5.1. Marketing Strategy

                17.1.7.5.2. Product Strategy

                17.1.7.5.3. Channel Strategy

        17.1.8. Wuzhou Sun Shine Forestry and Chemicals

            17.1.8.1. Overview

            17.1.8.2. Product Portfolio

            17.1.8.3. Profitability by Market Segments

            17.1.8.4. Sales Footprint

            17.1.8.5. Strategy Overview

                17.1.8.5.1. Marketing Strategy

                17.1.8.5.2. Product Strategy

                17.1.8.5.3. Channel Strategy

        17.1.9. Guilin Songquan Forest Chemical

            17.1.9.1. Overview

            17.1.9.2. Product Portfolio

            17.1.9.3. Profitability by Market Segments

            17.1.9.4. Sales Footprint

            17.1.9.5. Strategy Overview

                17.1.9.5.1. Marketing Strategy

                17.1.9.5.2. Product Strategy

                17.1.9.5.3. Channel Strategy

        17.1.10. Nanning Heli

            17.1.10.1. Overview

            17.1.10.2. Product Portfolio

            17.1.10.3. Profitability by Market Segments

            17.1.10.4. Sales Footprint

            17.1.10.5. Strategy Overview

                17.1.10.5.1. Marketing Strategy

                17.1.10.5.2. Product Strategy

                17.1.10.5.3. Channel Strategy

        17.1.11. Hongfa Group

            17.1.11.1. Overview

            17.1.11.2. Product Portfolio

            17.1.11.3. Profitability by Market Segments

            17.1.11.4. Sales Footprint

            17.1.11.5. Strategy Overview

                17.1.11.5.1. Marketing Strategy

                17.1.11.5.2. Product Strategy

                17.1.11.5.3. Channel Strategy

18. Assumptions & Acronyms Used

19. Research Methodology

Don't pay for what you don't need

Customize your report by selecting specific countries or regions and save 30%!

List of Tables

Table 1: Global Market Value (US$ Million) Forecast by Region, 2019 to 2034

Table 2: Global Market Volume (Litre) Forecast by Region, 2019 to 2034

Table 3: Global Market Value (US$ Million) Forecast by Type, 2019 to 2034

Table 4: Global Market Volume (Litre) Forecast by Type, 2019 to 2034

Table 5: Global Market Value (US$ Million) Forecast by Application, 2019 to 2034

Table 6: Global Market Volume (Litre) Forecast by Application, 2019 to 2034

Table 7: North America Market Value (US$ Million) Forecast by Country, 2019 to 2034

Table 8: North America Market Volume (Litre) Forecast by Country, 2019 to 2034

Table 9: North America Market Value (US$ Million) Forecast by Type, 2019 to 2034

Table 10: North America Market Volume (Litre) Forecast by Type, 2019 to 2034

Table 11: North America Market Value (US$ Million) Forecast by Application, 2019 to 2034

Table 12: North America Market Volume (Litre) Forecast by Application, 2019 to 2034

Table 13: Latin America Market Value (US$ Million) Forecast by Country, 2019 to 2034

Table 14: Latin America Market Volume (Litre) Forecast by Country, 2019 to 2034

Table 15: Latin America Market Value (US$ Million) Forecast by Type, 2019 to 2034

Table 16: Latin America Market Volume (Litre) Forecast by Type, 2019 to 2034

Table 17: Latin America Market Value (US$ Million) Forecast by Application, 2019 to 2034

Table 18: Latin America Market Volume (Litre) Forecast by Application, 2019 to 2034

Table 19: Western Europe Market Value (US$ Million) Forecast by Country, 2019 to 2034

Table 20: Western Europe Market Volume (Litre) Forecast by Country, 2019 to 2034

Table 21: Western Europe Market Value (US$ Million) Forecast by Type, 2019 to 2034

Table 22: Western Europe Market Volume (Litre) Forecast by Type, 2019 to 2034

Table 23: Western Europe Market Value (US$ Million) Forecast by Application, 2019 to 2034

Table 24: Western Europe Market Volume (Litre) Forecast by Application, 2019 to 2034

Table 25: Eastern Europe Market Value (US$ Million) Forecast by Country, 2019 to 2034

Table 26: Eastern Europe Market Volume (Litre) Forecast by Country, 2019 to 2034

Table 27: Eastern Europe Market Value (US$ Million) Forecast by Type, 2019 to 2034

Table 28: Eastern Europe Market Volume (Litre) Forecast by Type, 2019 to 2034

Table 29: Eastern Europe Market Value (US$ Million) Forecast by Application, 2019 to 2034

Table 30: Eastern Europe Market Volume (Litre) Forecast by Application, 2019 to 2034

Table 31: South Asia and Pacific Market Value (US$ Million) Forecast by Country, 2019 to 2034

Table 32: South Asia and Pacific Market Volume (Litre) Forecast by Country, 2019 to 2034

Table 33: South Asia and Pacific Market Value (US$ Million) Forecast by Type, 2019 to 2034

Table 34: South Asia and Pacific Market Volume (Litre) Forecast by Type, 2019 to 2034

Table 35: South Asia and Pacific Market Value (US$ Million) Forecast by Application, 2019 to 2034

Table 36: South Asia and Pacific Market Volume (Litre) Forecast by Application, 2019 to 2034

Table 37: East Asia Market Value (US$ Million) Forecast by Country, 2019 to 2034

Table 38: East Asia Market Volume (Litre) Forecast by Country, 2019 to 2034

Table 39: East Asia Market Value (US$ Million) Forecast by Type, 2019 to 2034

Table 40: East Asia Market Volume (Litre) Forecast by Type, 2019 to 2034

Table 41: East Asia Market Value (US$ Million) Forecast by Application, 2019 to 2034

Table 42: East Asia Market Volume (Litre) Forecast by Application, 2019 to 2034

Table 43: Middle East and Africa Market Value (US$ Million) Forecast by Country, 2019 to 2034

Table 44: Middle East and Africa Market Volume (Litre) Forecast by Country, 2019 to 2034

Table 45: Middle East and Africa Market Value (US$ Million) Forecast by Type, 2019 to 2034

Table 46: Middle East and Africa Market Volume (Litre) Forecast by Type, 2019 to 2034

Table 47: Middle East and Africa Market Value (US$ Million) Forecast by Application, 2019 to 2034

Table 48: Middle East and Africa Market Volume (Litre) Forecast by Application, 2019 to 2034
Nikhil Kaitwade
Nikhil Kaitwade

Principal Consultant

Talk to Analyst

Find your sweet spots for generating winning opportunities in this market.

List of Charts

Figure 1: Global Market Value (US$ Million) by Type, 2024 to 2034

Figure 2: Global Market Value (US$ Million) by Application, 2024 to 2034

Figure 3: Global Market Value (US$ Million) by Region, 2024 to 2034

Figure 4: Global Market Value (US$ Million) Analysis by Region, 2019 to 2034

Figure 5: Global Market Volume (Litre) Analysis by Region, 2019 to 2034

Figure 6: Global Market Value Share (%) and BPS Analysis by Region, 2024 to 2034

Figure 7: Global Market Y-o-Y Growth (%) Projections by Region, 2024 to 2034

Figure 8: Global Market Value (US$ Million) Analysis by Type, 2019 to 2034

Figure 9: Global Market Volume (Litre) Analysis by Type, 2019 to 2034

Figure 10: Global Market Value Share (%) and BPS Analysis by Type, 2024 to 2034

Figure 11: Global Market Y-o-Y Growth (%) Projections by Type, 2024 to 2034

Figure 12: Global Market Value (US$ Million) Analysis by Application, 2019 to 2034

Figure 13: Global Market Volume (Litre) Analysis by Application, 2019 to 2034

Figure 14: Global Market Value Share (%) and BPS Analysis by Application, 2024 to 2034

Figure 15: Global Market Y-o-Y Growth (%) Projections by Application, 2024 to 2034

Figure 16: Global Market Attractiveness by Type, 2024 to 2034

Figure 17: Global Market Attractiveness by Application, 2024 to 2034

Figure 18: Global Market Attractiveness by Region, 2024 to 2034

Figure 19: North America Market Value (US$ Million) by Type, 2024 to 2034

Figure 20: North America Market Value (US$ Million) by Application, 2024 to 2034

Figure 21: North America Market Value (US$ Million) by Country, 2024 to 2034

Figure 22: North America Market Value (US$ Million) Analysis by Country, 2019 to 2034

Figure 23: North America Market Volume (Litre) Analysis by Country, 2019 to 2034

Figure 24: North America Market Value Share (%) and BPS Analysis by Country, 2024 to 2034

Figure 25: North America Market Y-o-Y Growth (%) Projections by Country, 2024 to 2034

Figure 26: North America Market Value (US$ Million) Analysis by Type, 2019 to 2034

Figure 27: North America Market Volume (Litre) Analysis by Type, 2019 to 2034

Figure 28: North America Market Value Share (%) and BPS Analysis by Type, 2024 to 2034

Figure 29: North America Market Y-o-Y Growth (%) Projections by Type, 2024 to 2034

Figure 30: North America Market Value (US$ Million) Analysis by Application, 2019 to 2034

Figure 31: North America Market Volume (Litre) Analysis by Application, 2019 to 2034

Figure 32: North America Market Value Share (%) and BPS Analysis by Application, 2024 to 2034

Figure 33: North America Market Y-o-Y Growth (%) Projections by Application, 2024 to 2034

Figure 34: North America Market Attractiveness by Type, 2024 to 2034

Figure 35: North America Market Attractiveness by Application, 2024 to 2034

Figure 36: North America Market Attractiveness by Country, 2024 to 2034

Figure 37: Latin America Market Value (US$ Million) by Type, 2024 to 2034

Figure 38: Latin America Market Value (US$ Million) by Application, 2024 to 2034

Figure 39: Latin America Market Value (US$ Million) by Country, 2024 to 2034

Figure 40: Latin America Market Value (US$ Million) Analysis by Country, 2019 to 2034

Figure 41: Latin America Market Volume (Litre) Analysis by Country, 2019 to 2034

Figure 42: Latin America Market Value Share (%) and BPS Analysis by Country, 2024 to 2034

Figure 43: Latin America Market Y-o-Y Growth (%) Projections by Country, 2024 to 2034

Figure 44: Latin America Market Value (US$ Million) Analysis by Type, 2019 to 2034

Figure 45: Latin America Market Volume (Litre) Analysis by Type, 2019 to 2034

Figure 46: Latin America Market Value Share (%) and BPS Analysis by Type, 2024 to 2034

Figure 47: Latin America Market Y-o-Y Growth (%) Projections by Type, 2024 to 2034

Figure 48: Latin America Market Value (US$ Million) Analysis by Application, 2019 to 2034

Figure 49: Latin America Market Volume (Litre) Analysis by Application, 2019 to 2034

Figure 50: Latin America Market Value Share (%) and BPS Analysis by Application, 2024 to 2034

Figure 51: Latin America Market Y-o-Y Growth (%) Projections by Application, 2024 to 2034

Figure 52: Latin America Market Attractiveness by Type, 2024 to 2034

Figure 53: Latin America Market Attractiveness by Application, 2024 to 2034

Figure 54: Latin America Market Attractiveness by Country, 2024 to 2034

Figure 55: Western Europe Market Value (US$ Million) by Type, 2024 to 2034

Figure 56: Western Europe Market Value (US$ Million) by Application, 2024 to 2034

Figure 57: Western Europe Market Value (US$ Million) by Country, 2024 to 2034

Figure 58: Western Europe Market Value (US$ Million) Analysis by Country, 2019 to 2034

Figure 59: Western Europe Market Volume (Litre) Analysis by Country, 2019 to 2034

Figure 60: Western Europe Market Value Share (%) and BPS Analysis by Country, 2024 to 2034

Figure 61: Western Europe Market Y-o-Y Growth (%) Projections by Country, 2024 to 2034

Figure 62: Western Europe Market Value (US$ Million) Analysis by Type, 2019 to 2034

Figure 63: Western Europe Market Volume (Litre) Analysis by Type, 2019 to 2034

Figure 64: Western Europe Market Value Share (%) and BPS Analysis by Type, 2024 to 2034

Figure 65: Western Europe Market Y-o-Y Growth (%) Projections by Type, 2024 to 2034

Figure 66: Western Europe Market Value (US$ Million) Analysis by Application, 2019 to 2034

Figure 67: Western Europe Market Volume (Litre) Analysis by Application, 2019 to 2034

Figure 68: Western Europe Market Value Share (%) and BPS Analysis by Application, 2024 to 2034

Figure 69: Western Europe Market Y-o-Y Growth (%) Projections by Application, 2024 to 2034

Figure 70: Western Europe Market Attractiveness by Type, 2024 to 2034

Figure 71: Western Europe Market Attractiveness by Application, 2024 to 2034

Figure 72: Western Europe Market Attractiveness by Country, 2024 to 2034

Figure 73: Eastern Europe Market Value (US$ Million) by Type, 2024 to 2034

Figure 74: Eastern Europe Market Value (US$ Million) by Application, 2024 to 2034

Figure 75: Eastern Europe Market Value (US$ Million) by Country, 2024 to 2034

Figure 76: Eastern Europe Market Value (US$ Million) Analysis by Country, 2019 to 2034

Figure 77: Eastern Europe Market Volume (Litre) Analysis by Country, 2019 to 2034

Figure 78: Eastern Europe Market Value Share (%) and BPS Analysis by Country, 2024 to 2034

Figure 79: Eastern Europe Market Y-o-Y Growth (%) Projections by Country, 2024 to 2034

Figure 80: Eastern Europe Market Value (US$ Million) Analysis by Type, 2019 to 2034

Figure 81: Eastern Europe Market Volume (Litre) Analysis by Type, 2019 to 2034

Figure 82: Eastern Europe Market Value Share (%) and BPS Analysis by Type, 2024 to 2034

Figure 83: Eastern Europe Market Y-o-Y Growth (%) Projections by Type, 2024 to 2034

Figure 84: Eastern Europe Market Value (US$ Million) Analysis by Application, 2019 to 2034

Figure 85: Eastern Europe Market Volume (Litre) Analysis by Application, 2019 to 2034

Figure 86: Eastern Europe Market Value Share (%) and BPS Analysis by Application, 2024 to 2034

Figure 87: Eastern Europe Market Y-o-Y Growth (%) Projections by Application, 2024 to 2034

Figure 88: Eastern Europe Market Attractiveness by Type, 2024 to 2034

Figure 89: Eastern Europe Market Attractiveness by Application, 2024 to 2034

Figure 90: Eastern Europe Market Attractiveness by Country, 2024 to 2034

Figure 91: South Asia and Pacific Market Value (US$ Million) by Type, 2024 to 2034

Figure 92: South Asia and Pacific Market Value (US$ Million) by Application, 2024 to 2034

Figure 93: South Asia and Pacific Market Value (US$ Million) by Country, 2024 to 2034

Figure 94: South Asia and Pacific Market Value (US$ Million) Analysis by Country, 2019 to 2034

Figure 95: South Asia and Pacific Market Volume (Litre) Analysis by Country, 2019 to 2034

Figure 96: South Asia and Pacific Market Value Share (%) and BPS Analysis by Country, 2024 to 2034

Figure 97: South Asia and Pacific Market Y-o-Y Growth (%) Projections by Country, 2024 to 2034

Figure 98: South Asia and Pacific Market Value (US$ Million) Analysis by Type, 2019 to 2034

Figure 99: South Asia and Pacific Market Volume (Litre) Analysis by Type, 2019 to 2034

Figure 100: South Asia and Pacific Market Value Share (%) and BPS Analysis by Type, 2024 to 2034

Figure 101: South Asia and Pacific Market Y-o-Y Growth (%) Projections by Type, 2024 to 2034

Figure 102: South Asia and Pacific Market Value (US$ Million) Analysis by Application, 2019 to 2034

Figure 103: South Asia and Pacific Market Volume (Litre) Analysis by Application, 2019 to 2034

Figure 104: South Asia and Pacific Market Value Share (%) and BPS Analysis by Application, 2024 to 2034

Figure 105: South Asia and Pacific Market Y-o-Y Growth (%) Projections by Application, 2024 to 2034

Figure 106: South Asia and Pacific Market Attractiveness by Type, 2024 to 2034

Figure 107: South Asia and Pacific Market Attractiveness by Application, 2024 to 2034

Figure 108: South Asia and Pacific Market Attractiveness by Country, 2024 to 2034

Figure 109: East Asia Market Value (US$ Million) by Type, 2024 to 2034

Figure 110: East Asia Market Value (US$ Million) by Application, 2024 to 2034

Figure 111: East Asia Market Value (US$ Million) by Country, 2024 to 2034

Figure 112: East Asia Market Value (US$ Million) Analysis by Country, 2019 to 2034

Figure 113: East Asia Market Volume (Litre) Analysis by Country, 2019 to 2034

Figure 114: East Asia Market Value Share (%) and BPS Analysis by Country, 2024 to 2034

Figure 115: East Asia Market Y-o-Y Growth (%) Projections by Country, 2024 to 2034

Figure 116: East Asia Market Value (US$ Million) Analysis by Type, 2019 to 2034

Figure 117: East Asia Market Volume (Litre) Analysis by Type, 2019 to 2034

Figure 118: East Asia Market Value Share (%) and BPS Analysis by Type, 2024 to 2034

Figure 119: East Asia Market Y-o-Y Growth (%) Projections by Type, 2024 to 2034

Figure 120: East Asia Market Value (US$ Million) Analysis by Application, 2019 to 2034

Figure 121: East Asia Market Volume (Litre) Analysis by Application, 2019 to 2034

Figure 122: East Asia Market Value Share (%) and BPS Analysis by Application, 2024 to 2034

Figure 123: East Asia Market Y-o-Y Growth (%) Projections by Application, 2024 to 2034

Figure 124: East Asia Market Attractiveness by Type, 2024 to 2034

Figure 125: East Asia Market Attractiveness by Application, 2024 to 2034

Figure 126: East Asia Market Attractiveness by Country, 2024 to 2034

Figure 127: Middle East and Africa Market Value (US$ Million) by Type, 2024 to 2034

Figure 128: Middle East and Africa Market Value (US$ Million) by Application, 2024 to 2034

Figure 129: Middle East and Africa Market Value (US$ Million) by Country, 2024 to 2034

Figure 130: Middle East and Africa Market Value (US$ Million) Analysis by Country, 2019 to 2034

Figure 131: Middle East and Africa Market Volume (Litre) Analysis by Country, 2019 to 2034

Figure 132: Middle East and Africa Market Value Share (%) and BPS Analysis by Country, 2024 to 2034

Figure 133: Middle East and Africa Market Y-o-Y Growth (%) Projections by Country, 2024 to 2034

Figure 134: Middle East and Africa Market Value (US$ Million) Analysis by Type, 2019 to 2034

Figure 135: Middle East and Africa Market Volume (Litre) Analysis by Type, 2019 to 2034

Figure 136: Middle East and Africa Market Value Share (%) and BPS Analysis by Type, 2024 to 2034

Figure 137: Middle East and Africa Market Y-o-Y Growth (%) Projections by Type, 2024 to 2034

Figure 138: Middle East and Africa Market Value (US$ Million) Analysis by Application, 2019 to 2034

Figure 139: Middle East and Africa Market Volume (Litre) Analysis by Application, 2019 to 2034

Figure 140: Middle East and Africa Market Value Share (%) and BPS Analysis by Application, 2024 to 2034

Figure 141: Middle East and Africa Market Y-o-Y Growth (%) Projections by Application, 2024 to 2034

Figure 142: Middle East and Africa Market Attractiveness by Type, 2024 to 2034

Figure 143: Middle East and Africa Market Attractiveness by Application, 2024 to 2034

Figure 144: Middle East and Africa Market Attractiveness by Country, 2024 to 2034

Recommendations

Chemicals & Materials

Gum Turpentine Oil Market

Published : March 2023

Chemicals & Materials

India Retail Mineral Turpentine Oil Market

Published : November 2022

Explore Chemicals & Materials Insights

View Reports