The Vaginal Antifungals Market is estimated to be valued at USD 1.2 billion in 2025 and is projected to reach USD 1.9 billion by 2035, registering a compound annual growth rate (CAGR) of 4.5% over the forecast period.
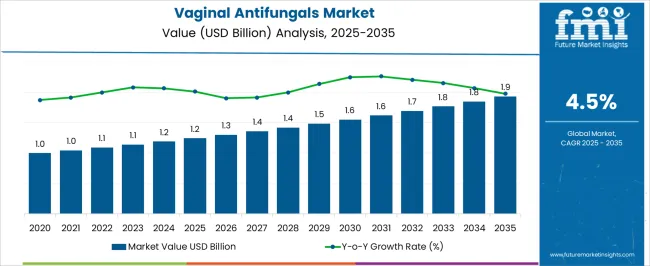
| Metric | Value |
|---|---|
| Vaginal Antifungals Market Estimated Value in (2025 E) | USD 1.2 billion |
| Vaginal Antifungals Market Forecast Value in (2035 F) | USD 1.9 billion |
| Forecast CAGR (2025 to 2035) | 4.5% |
The vaginal antifungals market is expanding steadily due to increasing prevalence of vaginal infections, growing awareness of women’s health, and rising demand for effective over the counter as well as prescription treatments. Advances in drug formulations have improved patient compliance through extended release and combination therapies, which are being widely adopted.
The shift toward self medication, coupled with the availability of affordable generics, has supported market penetration across both developed and emerging economies. Regulatory focus on women’s reproductive health and the expansion of pharmacy retail networks are further contributing to growth.
Continuous research into reducing resistance to antifungal agents and improving targeted delivery is expected to create new opportunities. The market outlook remains positive as healthcare providers and consumers emphasize early diagnosis, preventive care, and efficient treatment of recurring infections.
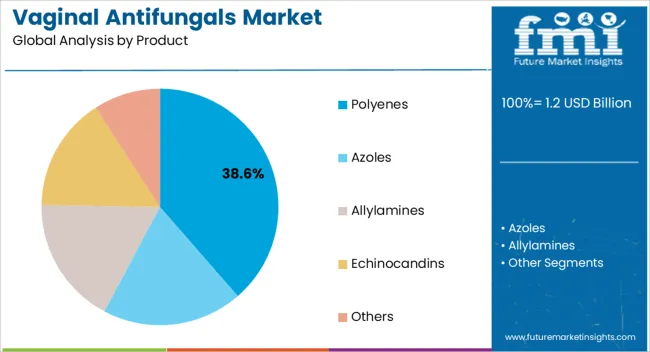
The polyenes segment is projected to contribute 38.60% of the total market revenue by 2025 within the product category, making it a leading product group. Its dominance is supported by proven clinical effectiveness against fungal infections, broad therapeutic applicability, and established physician confidence.
Polyenes are widely used due to their strong safety profile and ability to minimize recurrence rates when compared with some alternative classes.
Continued demand for cost effective and reliable treatment options has further reinforced the prominence of this product category, positioning it as a cornerstone in antifungal therapeutics.
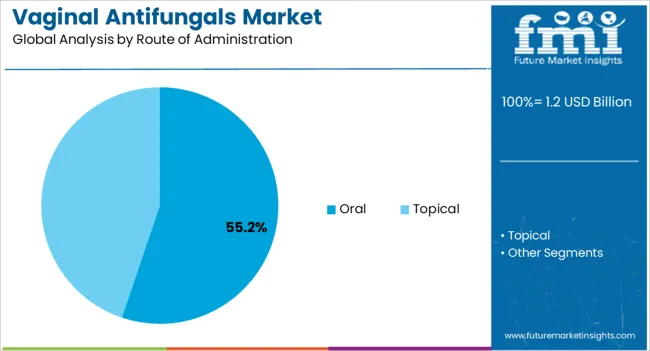
The oral route of administration is anticipated to account for 55.20% of the total market revenue by 2025, emerging as the most significant delivery method. This is driven by patient preference for ease of administration, systemic efficacy, and convenience compared to topical formulations.
Oral antifungals are favored for treating moderate to severe infections where localized therapies may be less effective. Increasing physician recommendations and availability of oral dosage forms in generic variations have further expanded adoption.
The sustained demand for practical and effective treatment methods has allowed the oral segment to maintain leadership in route of administration.
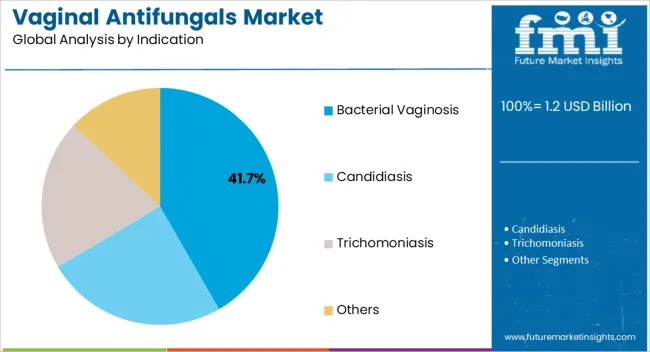
The bacterial vaginosis indication segment is expected to capture 41.70% of the total market revenue by 2025, placing it as the dominant therapeutic application. This share is attributed to the high global prevalence of bacterial vaginosis, recurrent infection rates, and significant unmet medical needs in both rural and urban populations.
Greater awareness of reproductive health issues and the expansion of preventive care programs have accelerated the use of antifungal therapies in this area.
Enhanced diagnostic efforts and proactive treatment guidelines are further supporting growth, reinforcing bacterial vaginosis as the leading indication within the vaginal antifungals market.
The global sales of the market are anticipated to rise at a CAGR of 4.5% between 2025 and 2035, owing to the rising prevalence of vaginal infectious disease.
The global vaginal antifungals market holds around 7.4% share of the overall global antifungals drug market with a value of around USD 1.2 Billion, in 2025.
Vulvovaginal candidiasis (VVC), which mainly affects immunocompetent childbearing age women, frequently affects the lower female genital tract. Candida albicans is the pathogenic yeast that is most commonly linked to this fungus infection, excluding other non-albicans species.
Significant number of women, according to various scientists, have candida in their vaginas without exhibiting any signs. If the vaginal environment changes to favour Candida development, an infection may result. Hormones, medications, and immune system changes can all trigger infection. Additionally, among women of reproductive age, infectious organisms most frequently cause vulvovaginitis, or inflammation of the vulva and vagina. Candida vulvovaginitis is the root cause of around one-third of these instances.
The VVC emergence can be influenced by a variety of lifestyle factors. Although some studies suggest that excessive use of antibiotics and uncontrolled diabetes in women results in the vaginal fungal infections. Thus, the rising prevalence of diabetic patients in women is propelling the market.
Although, the market is being constrained by the reality that despite how many topical have been developed by the manufacturers, they are ineffective because they do not penetrate the skin well enough. However, the creation of novel products to enhance delivery, absorption, retention, and bioabsorbility in vulvovaginal tissue provides a significant market opportunity for manufacturers and drug developers.
Owing to the above-mentioned factors, the global market is expected to grow at a prominent pace, and reach a valuation of around USD 1.9 Billion during the year 2035.
The market is anticipated to expand due to a rise in the vulvovaginal candidiasis in pregnant women and risk of fungal infection in diabetic patients.
Worldwide, pregnant women are affected by vulvovaginal candidiasis (VVC), a yeast infection of the vulva brought on by species of Candida. Due to a rise in the level of estrogen, which makes it easier for yeast to colonise the vagina pregnant women are more susceptible to developing VVC.
Similarly, antifungals are in high demand due to an increase in the danger of fungal infections in diabetic patients. Diabetes Mellitus has been linked to a number of health problems in women, including yeast infection. Diabetes, or unregulated blood glucose levels, can cause yeast overgrowth in warm and moist regions of the body, especially the vagina.
As a result, the increased risk of fungal infection in diabetes patients, as well as the desire for curative medication, are driving market expansion.
Due to medication side effects and a reduced detection rate as a result of asymptomatic fungal infections, the market is anticipated to slow down.
There is a need for the vaginal infections to be treated because the prevalence of fungi-related diseases is increasing globally. The absence of infection detection, however, is the main hindrance to market expansion. For instance, according to the Centers for Disease Control and Prevention, many fungi illnesses go undetected because of their vague symptoms. In addition, according to the article "Patient education: Bacterial vaginosis (Beyond the Basics)" in UpToDate 2025, around 50 to 75 percent of persons with BV have no symptoms. Hence, the lower detection rate is leading to a limited treatment rate for fungal infections, which is hampering the market.
Similar to this, the market is being gradually restrained by the negative effects of the medication used to treat vaginal fungal infections. For instance, vulvovaginal candidiasis is more common in pregnant women, making them essential for the treatment. Contrarily, animal studies by SCYNEXIS, Inc. suggest that administering the antifungal medication BREXAFEMME to pregnant women could damage the foetus. These serious drug side effects are preventing the industry from expanding. Additionally, diarrhoea, nausea, abdominal pain, and vomiting were the most frequent adverse reactions seen in clinical studies (incidence 2%). As a consequence, the market's development is constrained by the potent side effects of the drugs used to treat a fungus infection.
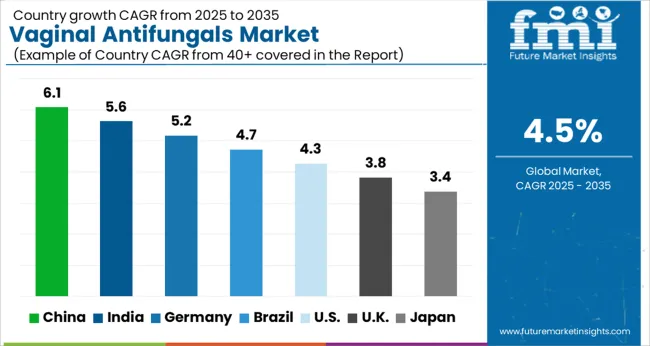
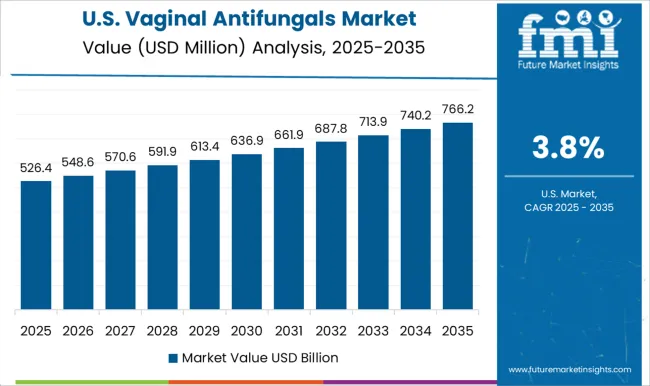
The USA dominates the global market with a total market share of around 27.0% in 2025, and the same rate of growth is anticipated to continue throughout the forecast period.
Rising prevalence of trichomoniasis in the country is supporting to the market growth for the vaginal antifungals.
Trichomoniasis can make it more probable for people to contract or spread HIV, and it increases the likelihood that women infected with the condition will deliver their babies prematurely and with low birth weights.
Therefore, with the increasing burden of fungal infection diseases, the demand for cure treatments is increasing, which is raising the market.
China has a market share of 12.8% in the global vaginal antifungals market in 2025 due to the upsurge in the high quality health care service in by the government.
As the cornerstone of integrated care, the Chinese government began to investigate the hierarchical diagnostic and treatment system. An institutional innovation in health care reform is the development of medical alliances, which enables hospitals and primary health care (PHC) facilities to collaborate closely to offer disease prevention, treatment, and rehabilitation services across the life course. By the end of 2020, China have created 12,000 medical alliances in order to mobilise high-quality healthcare services from public hospitals to PHC facilities.
Germany holds a market share of 7.6% in 2025 in the global vaginal antifungals market, owing to the government flutter to combat the infectious diseases.
Since 2020, Germany has been a steadfast supporter of Global Antibiotic Research and Development Partnership (GARDP) and has taken the lead in initiatives to combat antibiotic resistance. German government continues to be the largest contributor to GARDP with the new financing, increasing the entirety of its expenditures to EUR 1.2 million. Over the following five years (2025-2035), the German Federal Ministry of Education and Research pledged a further EUR 50 million in funds for the GARDP. The German financing will enable GARDP to develop novel antibiotic-resistant sickness therapies and ensure that everyone who requires them has access to them.
As a result, increased government funding for antibiotic resistance drugs is propelling the country's vaginal antifungals market.
India has a market share of 8.6% in the global vaginal antifungals market in 2025 due to the rising prevalence of vulvovaginal candidiasis.
Vulvovaginal candidiasis (VVC) is a clinical disease that is frequently seen in India. At least one episode of VVC occurs in at least three-fourths of all women's lifetimes. According to a study published in the Indian Journal of Obstetrics and Gynaecology Research, titled Vulvovaginal Candidiasis: Epidemiology, Treatment, and Prevention Strategies, the prevalence of VVC in India ranges from 10 to 35%.
So, topical treatments for short courses are useful in treating straightforward VVC. In 80%–90% of patients who complete therapy, azole treatment relieves symptoms and produces negative cultures according to CDC 2024. The success of oral and topical therapies for the VVC has led to an increase in the demand for antifungals.
Polygenes are expected to give high growth to the market and holding around 49.0% market share in 2025.
All common fungi that cause systemic infection, including species of Candida, Aspergillus, Mucor, and Cryptococcus, are responsive to amphotericin (belongs to the polyene class of antifungals). For infections caused by the aforementioned species, polyenes are very effective, which is leading to their high adoption. These medications are thought to be the most affordable, secure, and low-toxic antifungal agents available. Therefore, the demand is increasing because polyenes have fewer negative effects.
Topical administration is mostly preferred by the healthcare professional for the treatment purpose. It has a market share of 73.1% in the global market in 2025.
Due to their tailored therapy and limited adverse effects, topical fungal therapies are typically favoured. Due to their unique functional and structural characteristics, advanced topical transporters get beyond biopharmaceutical issues with traditional drug delivery systems, such as poor retention and low bioavailability. Additionally, continuous usage of antifungal medications has the potential to have negative side effects. In order to address this problem, patient cooperation is directed towards topical infection treatment. As a result, the market leader is the topical treatment category.
Bacterial vaginosis holds the market share of 44.9% during the year 2025.
A bacterial imbalance results in overgrowth of bacteria, which leads to bacterial vaginosis (BV), a common vaginal infection. The risk of bacterial vaginosis in pregnant women is increasing, which is also driving market expansion. Preterm birth, early miscarriage, postpartum endometritis, low birth weight, has been observed in women with bacterial vaginosis during pregnancy.
Gynaecology Clinics hold a market share of 41.4% during the year 2025. It is due to the high priority for the gynaecology clinics by the patients. The availability of specialised clinicians and high-tech treatment equipment attracts people to gynaecology clinics. Furthermore, the rising prevalence of vaginal infectious illnesses, combined with increased investment in infrastructure development, is increasing the usage of gynaecology clinics.
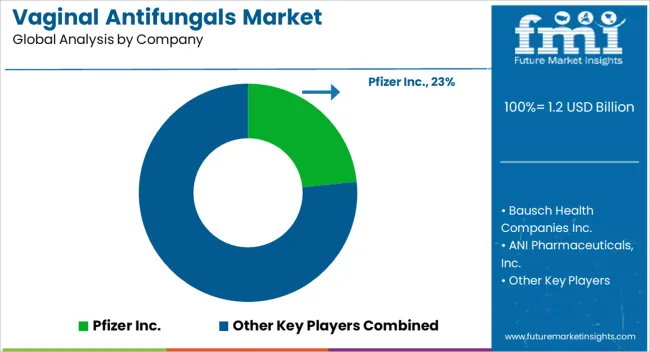
Leading companies in the global vaginal antifungals market are seeking for possibilities such as regional expansion to improve their market share. Furthermore, in order to boost their market presence, local rising companies are employing different methods such as mergers, cooperation, acquisition, agreement, and product launches and development in the vaginal antifungals market.
Similarly, recent developments related to companies manufacturing vaginal antifungals products have been tracked by the team at Future Market Insights. These are available in the full report.
| Attribute | Details |
|---|---|
| Forecast Period | 2025 to 2035 |
| Historical Data Available for | 2020 to 2025 |
| Market Analysis | USD Million for Value |
| Key Regions Covered | North America; Latin America; Europe; South Asia; East Asia; Oceania; and the Middle East & Africa |
| Key Countries Covered | The USA, Canada, Brazil, Mexico, Argentina, The United kingdom, Germany, Italy, Russia, Spain, France, Benelux, India, Thailand, Indonesia, Malaysia, Japan, China, South Korea, Australia, New Zealand, Türkiye, GCC Countries and South Africa |
| Key Market Segments Covered | Product, Route of Administration, Indication, Distribution Channel, and Region |
| Key Companies Profiled | Pfizer Inc.; Bausch Health Companies Inc; ANI Pharmaceuticals, Inc.; Hikma Pharmaceuticals Plc; Lupin Limited; Mycovia Pharmaceuticals, Inc.; Glenmark Pharmaceuticals Limited; GSK plc.; Aurobindo Pharma Limited; Dr. Reddy's Laboratories; SCYNEXIS, Inc.; Basilea Pharmaceutica Ltd.; Astellas Pharma Inc.; Grupo Ferrer Internacional, S.A.; Pacgen Life Science Corporation; NovaDigm Therapeutics, Inc.; Cidara Therapeutics, Inc.; Amplyx Pharmaceuticals Inc. |
| Report Coverage | Market Forecast, Competition Intelligence, DROT Analysis, Market Dynamics and Challenges, Strategic Growth Initiatives |
| Pricing | Available upon Request |
The global vaginal antifungals market is estimated to be valued at USD 1.2 billion in 2025.
The market size for the vaginal antifungals market is projected to reach USD 1.9 billion by 2035.
The vaginal antifungals market is expected to grow at a 4.5% CAGR between 2025 and 2035.
The key product types in vaginal antifungals market are polyenes, azoles, allylamines, echinocandins and others.
In terms of route of administration, oral segment to command 55.2% share in the vaginal antifungals market in 2025.


Our Research Products

The "Full Research Suite" delivers actionable market intel, deep dives on markets or technologies, so clients act faster, cut risk, and unlock growth.

The Leaderboard benchmarks and ranks top vendors, classifying them as Established Leaders, Leading Challengers, or Disruptors & Challengers.

Locates where complements amplify value and substitutes erode it, forecasting net impact by horizon

We deliver granular, decision-grade intel: market sizing, 5-year forecasts, pricing, adoption, usage, revenue, and operational KPIs—plus competitor tracking, regulation, and value chains—across 60 countries broadly.

Spot the shifts before they hit your P&L. We track inflection points, adoption curves, pricing moves, and ecosystem plays to show where demand is heading, why it is changing, and what to do next across high-growth markets and disruptive tech

Real-time reads of user behavior. We track shifting priorities, perceptions of today’s and next-gen services, and provider experience, then pace how fast tech moves from trial to adoption, blending buyer, consumer, and channel inputs with social signals (#WhySwitch, #UX).

Partner with our analyst team to build a custom report designed around your business priorities. From analysing market trends to assessing competitors or crafting bespoke datasets, we tailor insights to your needs.
Supplier Intelligence
Discovery & Profiling
Capacity & Footprint
Performance & Risk
Compliance & Governance
Commercial Readiness
Who Supplies Whom
Scorecards & Shortlists
Playbooks & Docs
Category Intelligence
Definition & Scope
Demand & Use Cases
Cost Drivers
Market Structure
Supply Chain Map
Trade & Policy
Operating Norms
Deliverables
Buyer Intelligence
Account Basics
Spend & Scope
Procurement Model
Vendor Requirements
Terms & Policies
Entry Strategy
Pain Points & Triggers
Outputs
Pricing Analysis
Benchmarks
Trends
Should-Cost
Indexation
Landed Cost
Commercial Terms
Deliverables
Brand Analysis
Positioning & Value Prop
Share & Presence
Customer Evidence
Go-to-Market
Digital & Reputation
Compliance & Trust
KPIs & Gaps
Outputs
Full Research Suite comprises of:
Market outlook & trends analysis
Interviews & case studies
Strategic recommendations
Vendor profiles & capabilities analysis
5-year forecasts
8 regions and 60+ country-level data splits
Market segment data splits
12 months of continuous data updates
DELIVERED AS:
PDF EXCEL ONLINE
Vaginal Spetula Market Size and Share Forecast Outlook 2025 to 2035
Vaginal Inserts Market Size and Share Forecast Outlook 2025 to 2035
Vaginal Specula Market Trends and Forecast 2025 to 2035
Vaginal and Vulval Inflammatory Diseases Treatment Market - Demand & Innovations 2025 to 2035
Vaginal Applicator Market Growth & Health Innovations 2024-2034
Vaginal Exam Specula Market
Vulvovaginal Candidiasis Treatment Market Size and Share Forecast Outlook 2025 to 2035
At-Home Vaginal pH Test Kit Market Size and Share Forecast Outlook 2025 to 2035

Thank you!
You will receive an email from our Business Development Manager. Please be sure to check your SPAM/JUNK folder too.
Chat With
MaRIA