Vulvovaginal Candidiasis Treatment Market
Market Insights on Vulvovaginal Candidiasis Treatment covering sales outlook, demand forecast & up-to-date key trends
Vulvovaginal Candidiasis Treatment Market By Drug Type, Route of Administration, Distribution Channel, Region, Segment, End-User and Forecasts, 2023 – 2033
Vulvovaginal candidiasis Treatment Market Snapshot (2023-2033)
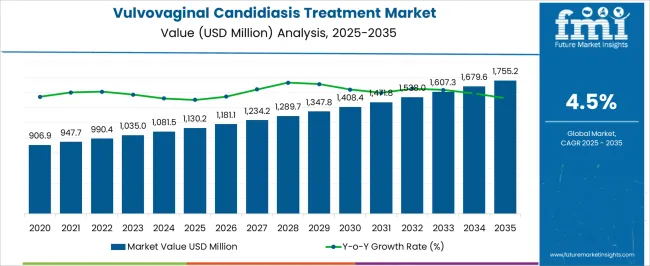
The global vulvovaginal candidiasis treatment market is currently valued at US$ 1035 million in 2023 and is anticipated to expand at a CAGR of 4.5%. Owing to the technological advances in healthcare sector the market is likely to propel to US$1607 Million by 2033.
“Rapid increase and unrestrained usage of antibiotics leading to high prevalence of yeast infection and increasing prevalence of VVC disorder are likely to drive the growth of the vulvovaginal candidiasis market in the forecast period.”
Report Attribute |
Details |
Expected Market Value (2023) |
US$1035 Million |
Projected Forecast Value (2033) |
US$1607 Million |
Global Growth Rate (2023-2033) |
4.5% CAGR |
Let us know your requirement to get
100% FREE customization
Vulvovaginal Candidiasis Treatment Revenue Analysis 2018-2022 vs. Future Outlook 2023-2033
According to market research and competitive intelligence provider FMI, the vulvovaginal candidiasis industry grew at a CAGR of 4.3% from 2018 to 2022.
Vaginal yeast infection is a common fungal infection and is called candidal vaginitis or candidal vulvovaginitis Symptoms of vaginal yeast infection include itching, burning sensation or pain during urination or sexual intercourse, swelling, rashes, and redness.
Candida albicans is the most prevalent cause of fungal infections in people. Candida species are the most common cause of fungal urinary tract infections (UTIs). Candida UTIs can occur in the lower portion of the urinary tract or in some cases can ascend up to the kidneys. The antifungal drug fluconazole can be used in many cases. VVC prevalence has increased due to growing diabetes cases and repeated antibiotic usage among individuals.
The market is expected to grow due to an increase in R&D initiatives for precise diagnosis. Various government and non-government bodies, including the World Health Organization and the European Institute of Women's Health (EIWH), have launched public awareness campaigns about women's health.
Demand for VVC treatment market is expected to expand at a CAGR of 4.5% from 2023 to 2033, with the global market predicted to reach a valuation of US$ 1607 Million by 2033.
What Market Trends Are Influencing the Vulvovaginal Candidiasis Treatment Market?
The growing prevalence of vulvovaginal candidiasis infection is further driving the demand for new therapeutics for treatment, augmenting the growth of the market
The increasing prevalence of vulvovaginal candidiasis infection is the primary factor driving the market growth. For instance, vulvovaginal candidiasis affects about 138 million women annually (range 103-172 million), with a global annual prevalence of 3871 per 100 000 women; 372 million women are affected by recurrent vulvovaginal candidiasis over their lifetime. In addition, recurrent VVC prevalence is rising, affecting more than 9% of women annually.
The high growth rate can be attributed to the rising disease burden of VVC and increasing testing rates. Positive changes, such as healthcare benefits by the government, increased awareness among consumers, and willingness to avail medical treatments are also expected to drive the growth of the vulvovaginal candidiasis treatment market.
Also, an increase in healthcare spending and the growth of healthcare infrastructure are also driving the global acute vulvovaginal candidiasis treatment market.
“Increased Incidence of Vaginal Infections and Rising R&D Activities & Public Awareness about Women's Health”
Vaginal yeast infection is a common fungal infection and is called candidal vaginitis or candidal vulvovaginitis (CVV)
An increase in the global burden of various ailments such as cardiovascular, neurological, and gastrointestinal diseases as well as cancer has boosted the consumption of broad-spectrum antibiotics, thereby propelling the number of yeast infection cases.
Rapid increase in the global disease burden, coupled with escalating demand for better treatment options and increasing number of hospital-acquired infections, is also propelling the demand for bacterial vulvovaginal candidiasis treatment.
Furthermore, expanding healthcare infrastructure in developing economies, availability of pharmaceutical drugs, and robust technological advancements in the biopharmaceutical industries are all contributing to significant opportunities for vulvovaginal candidiasis treatment over the forecasted period.
Find your sweet spots for generating winning opportunities in this market.
Talk to AnalystWhat are the Challenges Faced by the Vulvovaginal Candidiasis Treatment Industry?
Lack of Awareness of Vulvovaginal Candidiasis Treatment
Although the vulvovaginal candidiasis treatment market has numerous end-uses, there are some obstacles that likely pose a challenge to market growth during the forecasting.
The lack of awareness among the people in under develop countries may restrain the market growth. Also, the lack of experience in using advanced technology and high cost associated with the diagnosis and treatment procedure are expected to act as a restraint to the market.
Regional Analysis
How will North America Perform in the Global Vulvovaginal Candidiasis Treatment Industry Landscape?
“Developed Healthcare Facilities, High Incidence of Diseases, and Presence of Key Producers in North America Market”
The North America vulvovaginal candidiasis treatment market is expected to account for the highest market share of around 39.2% in the global landscape in 2023.
The region is expected to expand further at a steady growth rate maintaining its dominant position throughout the forecast period. This dominance can be attributed to the rise in patient awareness, and increased healthcare expenditure in the region.
A recent Harvard study showed that there are approximately 6 Million American women who are suffering from vulvodynia. This region's established healthcare infrastructures, as well as the high frequency of disease and the presence of important manufacturers, are major factors contributing towards vulvovaginal candidiasis treatment market share.
Product approvals and launches for treatment of vulvovaginal candidiasis treatment to boost the growth of the vulvovaginal candidiasis treatment market in North America.
For instance, In June 2021, Scynexis, Inc. announced the FDA approval for their novel drug BREXAFEMME indicated for VVC treatment. All these launches are anticipated to fuel the industry's growth in the region.
Why is Europe emerging as an Opportunistic Vulvovaginal Candidiasis Treatment Market?
“Well-established Healthcare Infra in the Europe Driving Vulvovaginal Candidiasis Treatment”
The Europe is one of the top region driving vulvovaginal candidiasis treatment demand. The country's prospects are being boosted by the presence of well-developed healthcare infrastructure and the availability of skilled medical staff.
Advanced therapeutic options, new approvals, launches, and proactive government measures further contribute to regional vulvovaginal candidiasis treatment market growth.
Throughout the projected period, the Europe’s market is expected to grow at a robust rate. The country is boosting its spending on biopharmaceutical research and development in order to develop cures for uncommon diseases, which bodes well for vulvovaginal candidiasis treatment system providers in the region. The market in Europe is expanding rapidly, due to an increase in the patient population, especially in the U.K. and Germany.
Which Factors Are Supporting Growth of the Vulvovaginal Candidiasis Treatment Market in Asia Pacific?
“Rising Awareness of Vaginal Disorders & Availability of Advanced Treatment Aiding Sales of Vulvovaginal Candidiasis Treatment Market”
During the projection period, the Asia Pacific vulvovaginal candidiasis treatment market is predicted to develop at the fastest rate. This is due to a significant number of unmet clinical requirements, improved knowledge of early diagnosis, and the availability of effective medications.
Developing economies such as China and Japan are projected to contribute to the expansion of the market in Asia Pacific due to better healthcare infrastructure, economic growth, increase in the number of insurance payers, expansion of the private healthcare sector, and increase in education and awareness.

A unified Market Research Subscription Platform, built for today's disparate research needs.
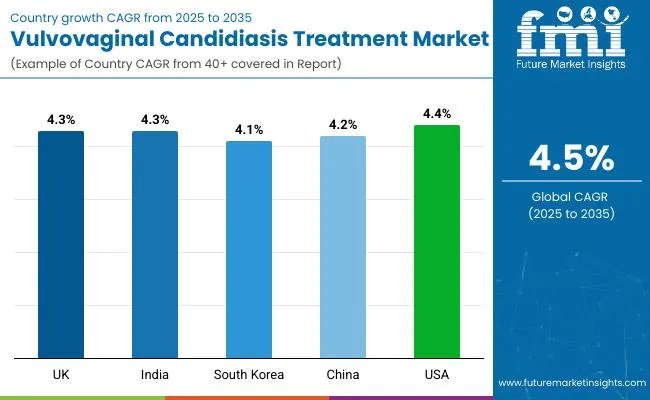
Country-wise Forecast CAGRs for the Vulvovaginal Candidiasis Treatment Market
U.K |
4.3% |
India |
4.3% |
South Korea |
4.1% |
China |
4.2 % |
U.S |
4.4 % |
Category-wise Insights
By route of administration, which segment generates high revenue in the vulvovaginal candidiasis treatment market?
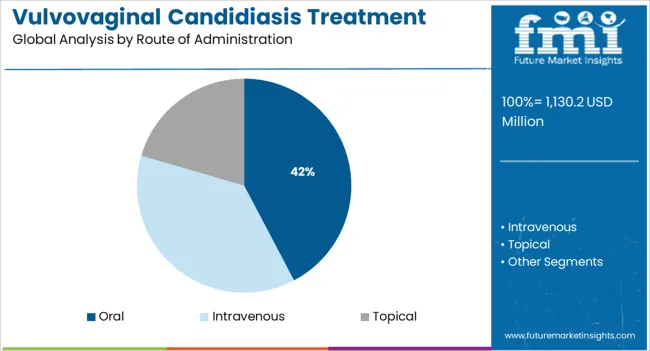
The oral segment generates high revenue in the vulvovaginal candidiasis treatment market
The oral segment dominated the industry in 2022 and accounted for the maximum share of more than 43.2 % of the total revenue. It is anticipated to maintain its share throughout the forecast period owing to the common & convenient route of administration for azoles, good bioavailability, and use for anti-fungal drugs.
Oral fluconazole is the most common prescription drug recommended as treatment and maintenance therapy. It is also effective as short-duration therapy in recurrent VVC cases. Recently, the FDA has approved two oral dosage regimes of VIVJOA (oteseconazole) to reduce incidences of recurrent VVC. The topical segment is expected to grow at a steady CAGR during the study period.
Also, the presence of other topical products such as over-the-counter and prescription formulations boost the demand in the market. According to IDSA guidelines, uncomplicated VVC should be treated with topical antifungal agents. Furthermore, oral azoles are ineffective in treating. Glabrata vulvovaginitis, thereby, is prescribed for topical intravaginal boric acid or topical flucytosine cream.
Based on Distribution Channel which is the most prominent segment in the Vulvovaginal Candidiasis Treatment market?
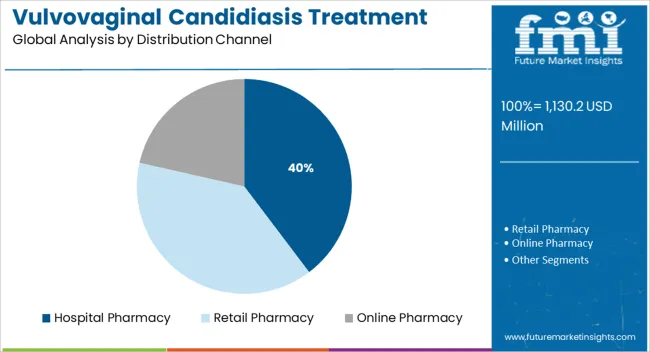
Hospital Pharmacy Segment remains Dominant among other types
In terms of distribution channel, the global vulvovaginal candidiasis treatment market can be categorized into hospital pharmacy, retail pharmacy, online pharmacy, and others.
The hospital pharmacy segment is projected to account for a major share of the global vulvovaginal candidiasis treatment market by 2033 as a large number of patients treated in hospitals
On the other hand, the online pharmacy distribution channel segment is also expected to grow at a significant CAGR during the forecast period. The preference for online purchasing is high due to the convenience and other benefits, such as home delivery.
Amid the pandemic, people experienced the comfort of delivery services and reduced travel time for prescription fillin retail stores. The COVID-19 pandemic boosted the online segment due to the government restrictions like nationwide lockdowns and stay-at-home orders to curb the spread of the virus.
Start-up Scenario
Viamet Pharmaceuticals, Cidara Therapeutics, are some of the start-ups in the vulvovaginal candidiasis treatment market
- Cidara therapeutics - Developer of novel anti-infectives for infectious diseases (bacterial and fungal). Its first product candidate is CD101 IV, an intravenous therapy in phase 1 trials for fungal infections. Besides, it has CD101 topical in the IND-enabling stage for the treatment of acute and recurrent vulvovaginal candidiasis (VVS). It has also developed a proprietary immunotherapy technology platform, Cloudbreak to develop drugs that direct immune cells to eliminate pathogens that cause infectious diseases. Its first Cloudbreak development candidate C001 is for the treatment of invasive aspergillosis.
Competitive Landscape
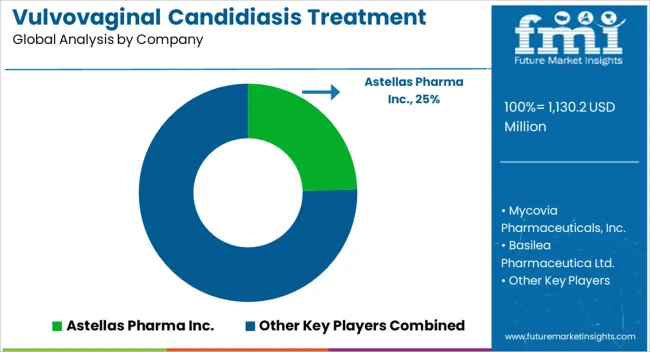
Astellas Pharma Inc., Mycovia Pharmaceuticals, Inc., Basilea Pharmaceutica Ltd., Scynexis, Inc., Grupo Ferrer Internacional S.A., Pfizer, Inc.,Cadila Pharmaceuticals,Bayer AG., Bristol-Myers Squibb Company are some of the key companies in the vulvovaginal candidiasis treatment market.
These players are continuously adopting various strategies such as new product launches, facility expansions, mergers, collaborations, partnerships, and acquisitions to increase their revenue share and gain a competitive edge in the market. for instance,
- In October 2022 - Astellas Pharma Inc. and Pantherna Therapeutics GmbH announced that the companies have entered into a new technology evaluation agreement for research to generate mRNA-based regenerative medicine programs using direct reprogramming (transdifferentiation)*.
- In August 2022 – Mycovia Pharmaceuticals, Inc. announced that it will present VIVJOA™ (oteseconazole) capsules in patients with recurrent vulvovaginal candidiasis (RVVC) at the 2022 Infectious Diseases Society for Obstetrics and Gynecology (IDSOG) Annual Meeting. VIVJOA is the first and only FDA-approved medication for RVVC indicated to reduce the incidence of RVVC in females with a history of RVVC who are NOT of reproductive potential
- In July 2022 – Mycovia Pharmaceuticals, Inc. announced U.S. availability of VIVJOA™ (oteseconazole) capsules, an azole antifungal indicated to reduce the incidence of recurrent vulvovaginal candidiasis (RVVC) in females with a history of RVVC who are NOT of reproductive potential.
- In September 2021 - Basilea Pharmaceutica Ltd. that its partner Asahi Kasei Pharma Corporation has filed a New Drug Application (NDA) for the marketing authorization of isavuconazole in Japan for the treatment of the fungal infections aspergillosis, mucormycosis and cryptococcosis.
Report Scope
Report Attribute |
Details |
Growth Rate |
CAGR of from 2023 to 2033 |
Expected Market Value (2023) |
US$1035 Million |
ProjectedForecast Value (2033) |
US$1607Million |
Base Year for Estimation |
2022 |
Historical Data |
2018-2022 |
Forecast Period |
2023-2033 |
Quantitative Units |
Revenue in USD Million and CAGR from 2023-2033 |
Report Coverage |
Revenue Forecast, Volume Forecast, Company Ranking, Competitive Landscape, Growth Factors, Trends and Pricing Analysis |
Segments Covered |
|
Regions Covered |
|
Key Countries Profiled |
|
Key Companies Profiled |
|
Customization |
Available Upon Request |
Key Segments Covered in the Vulvovaginal Candidiasis Treatment Market Industry Survey
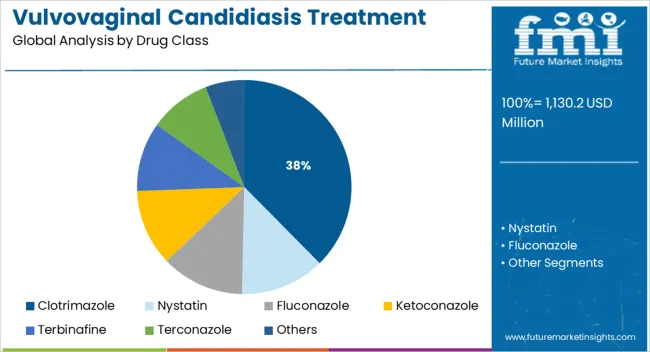
Vulvovaginal Candidiasis Treatment Market by Drug Class:
- Clotrimazole
- Nystatin
- Fluconazole
- Ketoconazole
- Terbinafine
- Terconazole
- Others
Vulvovaginal Candidiasis Treatment Market by Route of Administration:
- Oral Vulvovaginal Candidiasis Treatment
- Intravenous Vulvovaginal Candidiasis Treatment
- Topical Vulvovaginal Candidiasis Treatment
Vulvovaginal Candidiasis Treatment Market by Distribution Channel:
- Hospital Pharmacy for Vulvovaginal Candidiasis Treatment
- Retail Pharmacy for Vulvovaginal Candidiasis Treatment
- Online Pharmacy for Vulvovaginal Candidiasis Treatment
Vulvovaginal Candidiasis Treatment Market by Region:
- North America Vulvovaginal Candidiasis Treatment Market
- Latin America Vulvovaginal Candidiasis Treatment Market
- Europe Direct Vulvovaginal Candidiasis Treatment Market
- South Asia Vulvovaginal Candidiasis Treatment Market
- East Asia Vulvovaginal Candidiasis Treatment Market
- Oceania Vulvovaginal Candidiasis Treatment Market
- MEA Vulvovaginal Candidiasis Treatment Market
Frequently Asked Questions
The global vulvovaginal candidiasis treatment market is likely to reach a valuation of US$ 1035million by the end of 2023.
Astellas Pharma Inc., Mycovia Pharmaceuticals, Inc., Basilea Pharmaceutical Ltd., Scynexis, Inc., Grupo Ferrer Internacional S.A., Pfizer are some of the key players in the global vulvovaginal candidiasis treatment market
Sales of vulvovaginal candidiasis treatment market are likely to expand at 4.5% CAGR through 2033.
The U.S., Canada, Japan, China, and Germany are expected to drive most of the demand for vulvovaginal candidiasis treatment market.
By the end of 2033, the global market for vulvovaginal candidiasis treatment market is predicted to reach a valuation of US$1607 Million
Table of Content
1. Executive Summary
1.1. Global Market Outlook
1.2. Demand-side Trends
1.3. Supply-side Trends
1.4. Technology Roadmap Analysis
1.5. Analysis and Recommendations
2. Market Overview
2.1. Market Coverage / Taxonomy
2.2. Market Definition / Scope / Limitations
3. Market Background
3.1. Market Dynamics
3.1.1. Drivers
3.1.2. Restraints
3.1.3. Opportunity
3.1.4. Trends
3.2. Scenario Forecast
3.2.1. Demand in Optimistic Scenario
3.2.2. Demand in Likely Scenario
3.2.3. Demand in Conservative Scenario
3.3. Opportunity Map Analysis
3.4. Investment Feasibility Matrix
3.5. PESTLE and Porter’s Analysis
3.6. Regulatory Landscape
3.6.1. By Key Regions
3.6.2. By Key Countries
3.7. Regional Parent Market Outlook
4. Global Market Analysis 2017-2021 and Forecast, 2022-2032
4.1. Historical Market Size Value (US$ Mn) Analysis, 2017-2021
4.2. Current and Future Market Size Value (US$ Mn) Projections, 2022-2032
4.2.1. Y-o-Y Growth Trend Analysis
4.2.2. Absolute $ Opportunity Analysis
5. Global Market Analysis 2017-2021 and Forecast 2022-2032, By Drug Class
5.1. Introduction / Key Findings
5.2. Historical Market Size Value (US$ Mn) Analysis By Drug Class, 2017-2021
5.3. Current and Future Market Size Value (US$ Mn) Analysis and Forecast By Drug Class, 2022-2032
5.3.1. Clotrimazole
5.3.2. Nystatin
5.3.3. Fluconazole
5.3.4. Ketoconazole
5.3.5. Terbinafine
5.3.6. Terconazole
5.3.7. Others
5.4. Y-o-Y Growth Trend Analysis By Drug Class, 2017-2021
5.5. Absolute $ Opportunity Analysis By Drug Class, 2022-2032
6. Global Market Analysis 2017-2021 and Forecast 2022-2032, By Route of Administration
6.1. Introduction / Key Findings
6.2. Historical Market Size Value (US$ Mn) Analysis By Route of Administration, 2017-2021
6.3. Current and Future Market Size Value (US$ Mn) Analysis and Forecast By Route of Administration, 2022-2032
6.3.1. Oral
6.3.2. Intravenous
6.3.3. Topical
6.4. Y-o-Y Growth Trend Analysis By Route of Administration, 2017-2021
6.5. Absolute $ Opportunity Analysis By Route of Administration, 2022-2032
7. Global Market Analysis 2017-2021 and Forecast 2022-2032, By Distribution Channel
7.1. Introduction / Key Findings
7.2. Historical Market Size Value (US$ Mn) Analysis By Distribution Channel , 2017-2021
7.3. Current and Future Market Size Value (US$ Mn) Analysis and Forecast By Distribution Channel , 2022-2032
7.3.1. Hospital Pharmacy
7.3.2. Retail Pharmacy
7.3.3. Online Pharmacy
7.4. Y-o-Y Growth Trend Analysis By Distribution Channel , 2017-2021
7.5. Absolute $ Opportunity Analysis By Distribution Channel , 2022-2032
8. Global Market Analysis 2017-2021 and Forecast 2022-2032, By Region
8.1. Introduction
8.2. Historical Market Size Value (US$ Mn) Analysis By Region, 2017-2021
8.3. Current Market Size Value (US$ Mn) Analysis and Forecast By Region, 2022-2032
8.3.1. North America
8.3.2. Latin America
8.3.3. Europe
8.3.4. South Asia
8.3.5. East Asia
8.3.6. Oceania
8.3.7. MEA
8.4. Market Attractiveness Analysis By Region
9. North America Market Analysis 2017-2021 and Forecast 2022-2032, By Country
9.1. Historical Market Size Value (US$ Mn) Trend Analysis By Market Taxonomy, 2017-2021
9.2. Market Size Value (US$ Mn) Forecast By Market Taxonomy, 2022-2032
9.2.1. By Country
9.2.1.1. U.S.
9.2.1.2. Canada
9.2.2. By Drug Class
9.2.3. By Route of Administration
9.2.4. By Distribution Channel
9.3. Market Attractiveness Analysis
9.3.1. By Country
9.3.2. By Drug Class
9.3.3. By Route of Administration
9.3.4. By Distribution Channel
9.4. Key Takeaways
10. Latin America Market Analysis 2017-2021 and Forecast 2022-2032, By Country
10.1. Historical Market Size Value (US$ Mn) Trend Analysis By Market Taxonomy, 2017-2021
10.2. Market Size Value (US$ Mn) Forecast By Market Taxonomy, 2022-2032
10.2.1. By Country
10.2.1.1. Brazil
10.2.1.2. Mexico
10.2.1.3. Rest of Latin America
10.2.2. By Drug Class
10.2.3. By Route of Administration
10.2.4. By Distribution Channel
10.3. Market Attractiveness Analysis
10.3.1. By Country
10.3.2. By Drug Class
10.3.3. By Route of Administration
10.3.4. By Distribution Channel
10.4. Key Takeaways
11. Europe Market Analysis 2017-2021 and Forecast 2022-2032, By Country
11.1. Historical Market Size Value (US$ Mn) Trend Analysis By Market Taxonomy, 2017-2021
11.2. Market Size Value (US$ Mn) Forecast By Market Taxonomy, 2022-2032
11.2.1. By Country
11.2.1.1. Germany
11.2.1.2. U.K.
11.2.1.3. France
11.2.1.4. Spain
11.2.1.5. Italy
11.2.1.6. Rest of Europe
11.2.2. By Drug Class
11.2.3. By Route of Administration
11.2.4. By Distribution Channel
11.3. Market Attractiveness Analysis
11.3.1. By Country
11.3.2. By Drug Class
11.3.3. By Route of Administration
11.3.4. By Distribution Channel
11.4. Key Takeaways
12. South Asia Market Analysis 2017-2021 and Forecast 2022-2032, By Country
12.1. Historical Market Size Value (US$ Mn) Trend Analysis By Market Taxonomy, 2017-2021
12.2. Market Size Value (US$ Mn) Forecast By Market Taxonomy, 2022-2032
12.2.1. By Country
12.2.1.1. India
12.2.1.2. Malaysia
12.2.1.3. Singapore
12.2.1.4. Thailand
12.2.1.5. Rest of South Asia
12.2.2. By Drug Class
12.2.3. By Route of Administration
12.2.4. By Distribution Channel
12.3. Market Attractiveness Analysis
12.3.1. By Country
12.3.2. By Drug Class
12.3.3. By Route of Administration
12.3.4. By Distribution Channel
12.4. Key Takeaways
13. East Asia Market Analysis 2017-2021 and Forecast 2022-2032, By Country
13.1. Historical Market Size Value (US$ Mn) Trend Analysis By Market Taxonomy, 2017-2021
13.2. Market Size Value (US$ Mn) Forecast By Market Taxonomy, 2022-2032
13.2.1. By Country
13.2.1.1. China
13.2.1.2. Japan
13.2.1.3. South Korea
13.2.2. By Drug Class
13.2.3. By Route of Administration
13.2.4. By Distribution Channel
13.3. Market Attractiveness Analysis
13.3.1. By Country
13.3.2. By Drug Class
13.3.3. By Route of Administration
13.3.4. By Distribution Channel
13.4. Key Takeaways
14. Oceania Market Analysis 2017-2021 and Forecast 2022-2032, By Country
14.1. Historical Market Size Value (US$ Mn) Trend Analysis By Market Taxonomy, 2017-2021
14.2. Market Size Value (US$ Mn) Forecast By Market Taxonomy, 2022-2032
14.2.1. By Country
14.2.1.1. Australia
14.2.1.2. New Zealand
14.2.2. By Drug Class
14.2.3. By Route of Administration
14.2.4. By Distribution Channel
14.3. Market Attractiveness Analysis
14.3.1. By Country
14.3.2. By Drug Class
14.3.3. By Route of Administration
14.3.4. By Distribution Channel
14.4. Key Takeaways
15. MEA Market Analysis 2017-2021 and Forecast 2022-2032, By Country
15.1. Historical Market Size Value (US$ Mn) Trend Analysis By Market Taxonomy, 2017-2021
15.2. Market Size Value (US$ Mn) Forecast By Market Taxonomy, 2022-2032
15.2.1. By Country
15.2.1.1. GCC Countries
15.2.1.2. South Africa
15.2.1.3. Israel
15.2.1.4. Rest of MEA
15.2.2. By Drug Class
15.2.3. By Route of Administration
15.2.4. By Distribution Channel
15.3. Market Attractiveness Analysis
15.3.1. By Country
15.3.2. By Drug Class
15.3.3. By Route of Administration
15.3.4. By Distribution Channel
15.4. Key Takeaways
16. Key Countries Market Analysis
16.1. U.S.
16.1.1. Pricing Analysis
16.1.2. Market Share Analysis, 2021
16.1.2.1. By Drug Class
16.1.2.2. By Route of Administration
16.1.2.3. By Distribution Channel
16.2. Canada
16.2.1. Pricing Analysis
16.2.2. Market Share Analysis, 2021
16.2.2.1. By Drug Class
16.2.2.2. By Route of Administration
16.2.2.3. By Distribution Channel
16.3. Brazil
16.3.1. Pricing Analysis
16.3.2. Market Share Analysis, 2021
16.3.2.1. By Drug Class
16.3.2.2. By Route of Administration
16.3.2.3. By Distribution Channel
16.4. Mexico
16.4.1. Pricing Analysis
16.4.2. Market Share Analysis, 2021
16.4.2.1. By Drug Class
16.4.2.2. By Route of Administration
16.4.2.3. By Distribution Channel
16.5. Germany
16.5.1. Pricing Analysis
16.5.2. Market Share Analysis, 2021
16.5.2.1. By Drug Class
16.5.2.2. By Route of Administration
16.5.2.3. By Distribution Channel
16.6. U.K.
16.6.1. Pricing Analysis
16.6.2. Market Share Analysis, 2021
16.6.2.1. By Drug Class
16.6.2.2. By Route of Administration
16.6.2.3. By Distribution Channel
16.7. France
16.7.1. Pricing Analysis
16.7.2. Market Share Analysis, 2021
16.7.2.1. By Drug Class
16.7.2.2. By Route of Administration
16.7.2.3. By Distribution Channel
16.8. Spain
16.8.1. Pricing Analysis
16.8.2. Market Share Analysis, 2021
16.8.2.1. By Drug Class
16.8.2.2. By Route of Administration
16.8.2.3. By Distribution Channel
16.9. Italy
16.9.1. Pricing Analysis
16.9.2. Market Share Analysis, 2021
16.9.2.1. By Drug Class
16.9.2.2. By Route of Administration
16.9.2.3. By Distribution Channel
16.10. India
16.10.1. Pricing Analysis
16.10.2. Market Share Analysis, 2021
16.10.2.1. By Drug Class
16.10.2.2. By Route of Administration
16.10.2.3. By Distribution Channel
16.11. Malaysia
16.11.1. Pricing Analysis
16.11.2. Market Share Analysis, 2021
16.11.2.1. By Drug Class
16.11.2.2. By Route of Administration
16.11.2.3. By Distribution Channel
16.12. Singapore
16.12.1. Pricing Analysis
16.12.2. Market Share Analysis, 2021
16.12.2.1. By Drug Class
16.12.2.2. By Route of Administration
16.12.2.3. By Distribution Channel
16.13. Thailand
16.13.1. Pricing Analysis
16.13.2. Market Share Analysis, 2021
16.13.2.1. By Drug Class
16.13.2.2. By Route of Administration
16.13.2.3. By Distribution Channel
16.14. China
16.14.1. Pricing Analysis
16.14.2. Market Share Analysis, 2021
16.14.2.1. By Drug Class
16.14.2.2. By Route of Administration
16.14.2.3. By Distribution Channel
16.15. Japan
16.15.1. Pricing Analysis
16.15.2. Market Share Analysis, 2021
16.15.2.1. By Drug Class
16.15.2.2. By Route of Administration
16.15.2.3. By Distribution Channel
16.16. South Korea
16.16.1. Pricing Analysis
16.16.2. Market Share Analysis, 2021
16.16.2.1. By Drug Class
16.16.2.2. By Route of Administration
16.16.2.3. By Distribution Channel
16.17. Australia
16.17.1. Pricing Analysis
16.17.2. Market Share Analysis, 2021
16.17.2.1. By Drug Class
16.17.2.2. By Route of Administration
16.17.2.3. By Distribution Channel
16.18. New Zealand
16.18.1. Pricing Analysis
16.18.2. Market Share Analysis, 2021
16.18.2.1. By Drug Class
16.18.2.2. By Route of Administration
16.18.2.3. By Distribution Channel
16.19. GCC Countries
16.19.1. Pricing Analysis
16.19.2. Market Share Analysis, 2021
16.19.2.1. By Drug Class
16.19.2.2. By Route of Administration
16.19.2.3. By Distribution Channel
16.20. South Africa
16.20.1. Pricing Analysis
16.20.2. Market Share Analysis, 2021
16.20.2.1. By Drug Class
16.20.2.2. By Route of Administration
16.20.2.3. By Distribution Channel
16.21. Israel
16.21.1. Pricing Analysis
16.21.2. Market Share Analysis, 2021
16.21.2.1. By Drug Class
16.21.2.2. By Route of Administration
16.21.2.3. By Distribution Channel
17. Market Structure Analysis
17.1. Competition Dashboard
17.2. Competition Benchmarking
17.3. Market Share Analysis of Top Players
17.3.1. By Regional
17.3.2. By Drug Class
17.3.3. By Route of Administration
17.3.4. By Distribution Channel
18. Competition Analysis
18.1. Competition Deep Dive
18.1.1. Astellas Pharma Inc.
18.1.1.1. Overview
18.1.1.2. Product Portfolio
18.1.1.3. Profitability by Market Segments
18.1.1.4. Sales Footprint
18.1.1.5. Strategy Overview
18.1.1.5.1. Marketing Strategy
18.1.2. Mycovia Pharmaceuticals, Inc.
18.1.2.1. Overview
18.1.2.2. Product Portfolio
18.1.2.3. Profitability by Market Segments
18.1.2.4. Sales Footprint
18.1.2.5. Strategy Overview
18.1.2.5.1. Marketing Strategy
18.1.3. Basilea Pharmaceutica Ltd.
18.1.3.1. Overview
18.1.3.2. Product Portfolio
18.1.3.3. Profitability by Market Segments
18.1.3.4. Sales Footprint
18.1.3.5. Strategy Overview
18.1.3.5.1. Marketing Strategy
18.1.4. Scynexis, Inc.
18.1.4.1. Overview
18.1.4.2. Product Portfolio
18.1.4.3. Profitability by Market Segments
18.1.4.4. Sales Footprint
18.1.4.5. Strategy Overview
18.1.4.5.1. Marketing Strategy
18.1.5. Grupo Ferrer Internacional S.A.
18.1.5.1. Overview
18.1.5.2. Product Portfolio
18.1.5.3. Profitability by Market Segments
18.1.5.4. Sales Footprint
18.1.5.5. Strategy Overview
18.1.5.5.1. Marketing Strategy
18.1.6. Pfizer, Inc.
18.1.6.1. Overview
18.1.6.2. Product Portfolio
18.1.6.3. Profitability by Market Segments
18.1.6.4. Sales Footprint
18.1.6.5. Strategy Overview
18.1.6.5.1. Marketing Strategy
18.1.7. Cadila Pharmaceuticals
18.1.7.1. Overview
18.1.7.2. Product Portfolio
18.1.7.3. Profitability by Market Segments
18.1.7.4. Sales Footprint
18.1.7.5. Strategy Overview
18.1.7.5.1. Marketing Strategy
18.1.8. Bayer AG.
18.1.8.1. Overview
18.1.8.2. Product Portfolio
18.1.8.3. Profitability by Market Segments
18.1.8.4. Sales Footprint
18.1.8.5. Strategy Overview
18.1.8.5.1. Marketing Strategy
18.1.9. Bristol-Myers Squibb Company
18.1.9.1. Overview
18.1.9.2. Product Portfolio
18.1.9.3. Profitability by Market Segments
18.1.9.4. Sales Footprint
18.1.9.5. Strategy Overview
18.1.9.5.1. Marketing Strategy
18.1.10. Pacgen Life Science Corporation
18.1.10.1. Overview
18.1.10.2. Product Portfolio
18.1.10.3. Profitability by Market Segments
18.1.10.4. Sales Footprint
18.1.10.5. Strategy Overview
18.1.10.5.1. Marketing Strategy
19. Assumptions & Acronyms Used
20. Research Methodology
Let us know your requirement to get
100% FREE customization
List of Tables
Table 1: Global Market Value (US$ Mn) Forecast by Region, 2017-2032
Table 2: Global Market Value (US$ Mn) Forecast by Drug Class, 2017-2032
Table 3: Global Market Value (US$ Mn) Forecast by Route of Administration, 2017-2032
Table 4: Global Market Value (US$ Mn) Forecast by Distribution Channel , 2017-2032
Table 5: North America Market Value (US$ Mn) Forecast by Country, 2017-2032
Table 6: North America Market Value (US$ Mn) Forecast by Drug Class, 2017-2032
Table 7: North America Market Value (US$ Mn) Forecast by Route of Administration, 2017-2032
Table 8: North America Market Value (US$ Mn) Forecast by Distribution Channel , 2017-2032
Table 9: Latin America Market Value (US$ Mn) Forecast by Country, 2017-2032
Table 10: Latin America Market Value (US$ Mn) Forecast by Drug Class, 2017-2032
Table 11: Latin America Market Value (US$ Mn) Forecast by Route of Administration, 2017-2032
Table 12: Latin America Market Value (US$ Mn) Forecast by Distribution Channel , 2017-2032
Table 13: Europe Market Value (US$ Mn) Forecast by Country, 2017-2032
Table 14: Europe Market Value (US$ Mn) Forecast by Drug Class, 2017-2032
Table 15: Europe Market Value (US$ Mn) Forecast by Route of Administration, 2017-2032
Table 16: Europe Market Value (US$ Mn) Forecast by Distribution Channel , 2017-2032
Table 17: South Asia Market Value (US$ Mn) Forecast by Country, 2017-2032
Table 18: South Asia Market Value (US$ Mn) Forecast by Drug Class, 2017-2032
Table 19: South Asia Market Value (US$ Mn) Forecast by Route of Administration, 2017-2032
Table 20: South Asia Market Value (US$ Mn) Forecast by Distribution Channel , 2017-2032
Table 21: East Asia Market Value (US$ Mn) Forecast by Country, 2017-2032
Table 22: East Asia Market Value (US$ Mn) Forecast by Drug Class, 2017-2032
Table 23: East Asia Market Value (US$ Mn) Forecast by Route of Administration, 2017-2032
Table 24: East Asia Market Value (US$ Mn) Forecast by Distribution Channel , 2017-2032
Table 25: Oceania Market Value (US$ Mn) Forecast by Country, 2017-2032
Table 26: Oceania Market Value (US$ Mn) Forecast by Drug Class, 2017-2032
Table 27: Oceania Market Value (US$ Mn) Forecast by Route of Administration, 2017-2032
Table 28: Oceania Market Value (US$ Mn) Forecast by Distribution Channel , 2017-2032
Table 29: MEA Market Value (US$ Mn) Forecast by Country, 2017-2032
Table 30: MEA Market Value (US$ Mn) Forecast by Drug Class, 2017-2032
Table 31: MEA Market Value (US$ Mn) Forecast by Route of Administration, 2017-2032
Table 32: MEA Market Value (US$ Mn) Forecast by Distribution Channel , 2017-2032
Find your sweet spots for generating winning opportunities in this market.
Talk to AnalystList of Charts
Figure 1: Global Market Value (US$ Mn) by Drug Class, 2022-2032
Figure 2: Global Market Value (US$ Mn) by Route of Administration, 2022-2032
Figure 3: Global Market Value (US$ Mn) by Distribution Channel , 2022-2032
Figure 4: Global Market Value (US$ Mn) by Region, 2022-2032
Figure 5: Global Market Value (US$ Mn) Analysis by Region, 2017-2032
Figure 6: Global Market Value Share (%) and BPS Analysis by Region, 2022-2032
Figure 7: Global Market Y-o-Y Growth (%) Projections by Region, 2022-2032
Figure 8: Global Market Value (US$ Mn) Analysis by Drug Class, 2017-2032
Figure 9: Global Market Value Share (%) and BPS Analysis by Drug Class, 2022-2032
Figure 10: Global Market Y-o-Y Growth (%) Projections by Drug Class, 2022-2032
Figure 11: Global Market Value (US$ Mn) Analysis by Route of Administration, 2017-2032
Figure 12: Global Market Value Share (%) and BPS Analysis by Route of Administration, 2022-2032
Figure 13: Global Market Y-o-Y Growth (%) Projections by Route of Administration, 2022-2032
Figure 14: Global Market Value (US$ Mn) Analysis by Distribution Channel , 2017-2032
Figure 15: Global Market Value Share (%) and BPS Analysis by Distribution Channel , 2022-2032
Figure 16: Global Market Y-o-Y Growth (%) Projections by Distribution Channel , 2022-2032
Figure 17: Global Market Attractiveness by Drug Class, 2022-2032
Figure 18: Global Market Attractiveness by Route of Administration, 2022-2032
Figure 19: Global Market Attractiveness by Distribution Channel , 2022-2032
Figure 20: Global Market Attractiveness by Region, 2022-2032
Figure 21: North America Market Value (US$ Mn) by Drug Class, 2022-2032
Figure 22: North America Market Value (US$ Mn) by Route of Administration, 2022-2032
Figure 23: North America Market Value (US$ Mn) by Distribution Channel , 2022-2032
Figure 24: North America Market Value (US$ Mn) by Country, 2022-2032
Figure 25: North America Market Value (US$ Mn) Analysis by Country, 2017-2032
Figure 26: North America Market Value Share (%) and BPS Analysis by Country, 2022-2032
Figure 27: North America Market Y-o-Y Growth (%) Projections by Country, 2022-2032
Figure 28: North America Market Value (US$ Mn) Analysis by Drug Class, 2017-2032
Figure 29: North America Market Value Share (%) and BPS Analysis by Drug Class, 2022-2032
Figure 30: North America Market Y-o-Y Growth (%) Projections by Drug Class, 2022-2032
Figure 31: North America Market Value (US$ Mn) Analysis by Route of Administration, 2017-2032
Figure 32: North America Market Value Share (%) and BPS Analysis by Route of Administration, 2022-2032
Figure 33: North America Market Y-o-Y Growth (%) Projections by Route of Administration, 2022-2032
Figure 34: North America Market Value (US$ Mn) Analysis by Distribution Channel , 2017-2032
Figure 35: North America Market Value Share (%) and BPS Analysis by Distribution Channel , 2022-2032
Figure 36: North America Market Y-o-Y Growth (%) Projections by Distribution Channel , 2022-2032
Figure 37: North America Market Attractiveness by Drug Class, 2022-2032
Figure 38: North America Market Attractiveness by Route of Administration, 2022-2032
Figure 39: North America Market Attractiveness by Distribution Channel , 2022-2032
Figure 40: North America Market Attractiveness by Country, 2022-2032
Figure 41: Latin America Market Value (US$ Mn) by Drug Class, 2022-2032
Figure 42: Latin America Market Value (US$ Mn) by Route of Administration, 2022-2032
Figure 43: Latin America Market Value (US$ Mn) by Distribution Channel , 2022-2032
Figure 44: Latin America Market Value (US$ Mn) by Country, 2022-2032
Figure 45: Latin America Market Value (US$ Mn) Analysis by Country, 2017-2032
Figure 46: Latin America Market Value Share (%) and BPS Analysis by Country, 2022-2032
Figure 47: Latin America Market Y-o-Y Growth (%) Projections by Country, 2022-2032
Figure 48: Latin America Market Value (US$ Mn) Analysis by Drug Class, 2017-2032
Figure 49: Latin America Market Value Share (%) and BPS Analysis by Drug Class, 2022-2032
Figure 50: Latin America Market Y-o-Y Growth (%) Projections by Drug Class, 2022-2032
Figure 51: Latin America Market Value (US$ Mn) Analysis by Route of Administration, 2017-2032
Figure 52: Latin America Market Value Share (%) and BPS Analysis by Route of Administration, 2022-2032
Figure 53: Latin America Market Y-o-Y Growth (%) Projections by Route of Administration, 2022-2032
Figure 54: Latin America Market Value (US$ Mn) Analysis by Distribution Channel , 2017-2032
Figure 55: Latin America Market Value Share (%) and BPS Analysis by Distribution Channel , 2022-2032
Figure 56: Latin America Market Y-o-Y Growth (%) Projections by Distribution Channel , 2022-2032
Figure 57: Latin America Market Attractiveness by Drug Class, 2022-2032
Figure 58: Latin America Market Attractiveness by Route of Administration, 2022-2032
Figure 59: Latin America Market Attractiveness by Distribution Channel , 2022-2032
Figure 60: Latin America Market Attractiveness by Country, 2022-2032
Figure 61: Europe Market Value (US$ Mn) by Drug Class, 2022-2032
Figure 62: Europe Market Value (US$ Mn) by Route of Administration, 2022-2032
Figure 63: Europe Market Value (US$ Mn) by Distribution Channel , 2022-2032
Figure 64: Europe Market Value (US$ Mn) by Country, 2022-2032
Figure 65: Europe Market Value (US$ Mn) Analysis by Country, 2017-2032
Figure 66: Europe Market Value Share (%) and BPS Analysis by Country, 2022-2032
Figure 67: Europe Market Y-o-Y Growth (%) Projections by Country, 2022-2032
Figure 68: Europe Market Value (US$ Mn) Analysis by Drug Class, 2017-2032
Figure 69: Europe Market Value Share (%) and BPS Analysis by Drug Class, 2022-2032
Figure 70: Europe Market Y-o-Y Growth (%) Projections by Drug Class, 2022-2032
Figure 71: Europe Market Value (US$ Mn) Analysis by Route of Administration, 2017-2032
Figure 72: Europe Market Value Share (%) and BPS Analysis by Route of Administration, 2022-2032
Figure 73: Europe Market Y-o-Y Growth (%) Projections by Route of Administration, 2022-2032
Figure 74: Europe Market Value (US$ Mn) Analysis by Distribution Channel , 2017-2032
Figure 75: Europe Market Value Share (%) and BPS Analysis by Distribution Channel , 2022-2032
Figure 76: Europe Market Y-o-Y Growth (%) Projections by Distribution Channel , 2022-2032
Figure 77: Europe Market Attractiveness by Drug Class, 2022-2032
Figure 78: Europe Market Attractiveness by Route of Administration, 2022-2032
Figure 79: Europe Market Attractiveness by Distribution Channel , 2022-2032
Figure 80: Europe Market Attractiveness by Country, 2022-2032
Figure 81: South Asia Market Value (US$ Mn) by Drug Class, 2022-2032
Figure 82: South Asia Market Value (US$ Mn) by Route of Administration, 2022-2032
Figure 83: South Asia Market Value (US$ Mn) by Distribution Channel , 2022-2032
Figure 84: South Asia Market Value (US$ Mn) by Country, 2022-2032
Figure 85: South Asia Market Value (US$ Mn) Analysis by Country, 2017-2032
Figure 86: South Asia Market Value Share (%) and BPS Analysis by Country, 2022-2032
Figure 87: South Asia Market Y-o-Y Growth (%) Projections by Country, 2022-2032
Figure 88: South Asia Market Value (US$ Mn) Analysis by Drug Class, 2017-2032
Figure 89: South Asia Market Value Share (%) and BPS Analysis by Drug Class, 2022-2032
Figure 90: South Asia Market Y-o-Y Growth (%) Projections by Drug Class, 2022-2032
Figure 91: South Asia Market Value (US$ Mn) Analysis by Route of Administration, 2017-2032
Figure 92: South Asia Market Value Share (%) and BPS Analysis by Route of Administration, 2022-2032
Figure 93: South Asia Market Y-o-Y Growth (%) Projections by Route of Administration, 2022-2032
Figure 94: South Asia Market Value (US$ Mn) Analysis by Distribution Channel , 2017-2032
Figure 95: South Asia Market Value Share (%) and BPS Analysis by Distribution Channel , 2022-2032
Figure 96: South Asia Market Y-o-Y Growth (%) Projections by Distribution Channel , 2022-2032
Figure 97: South Asia Market Attractiveness by Drug Class, 2022-2032
Figure 98: South Asia Market Attractiveness by Route of Administration, 2022-2032
Figure 99: South Asia Market Attractiveness by Distribution Channel , 2022-2032
Figure 100: South Asia Market Attractiveness by Country, 2022-2032
Figure 101: East Asia Market Value (US$ Mn) by Drug Class, 2022-2032
Figure 102: East Asia Market Value (US$ Mn) by Route of Administration, 2022-2032
Figure 103: East Asia Market Value (US$ Mn) by Distribution Channel , 2022-2032
Figure 104: East Asia Market Value (US$ Mn) by Country, 2022-2032
Figure 105: East Asia Market Value (US$ Mn) Analysis by Country, 2017-2032
Figure 106: East Asia Market Value Share (%) and BPS Analysis by Country, 2022-2032
Figure 107: East Asia Market Y-o-Y Growth (%) Projections by Country, 2022-2032
Figure 108: East Asia Market Value (US$ Mn) Analysis by Drug Class, 2017-2032
Figure 109: East Asia Market Value Share (%) and BPS Analysis by Drug Class, 2022-2032
Figure 110: East Asia Market Y-o-Y Growth (%) Projections by Drug Class, 2022-2032
Figure 111: East Asia Market Value (US$ Mn) Analysis by Route of Administration, 2017-2032
Figure 112: East Asia Market Value Share (%) and BPS Analysis by Route of Administration, 2022-2032
Figure 113: East Asia Market Y-o-Y Growth (%) Projections by Route of Administration, 2022-2032
Figure 114: East Asia Market Value (US$ Mn) Analysis by Distribution Channel , 2017-2032
Figure 115: East Asia Market Value Share (%) and BPS Analysis by Distribution Channel , 2022-2032
Figure 116: East Asia Market Y-o-Y Growth (%) Projections by Distribution Channel , 2022-2032
Figure 117: East Asia Market Attractiveness by Drug Class, 2022-2032
Figure 118: East Asia Market Attractiveness by Route of Administration, 2022-2032
Figure 119: East Asia Market Attractiveness by Distribution Channel , 2022-2032
Figure 120: East Asia Market Attractiveness by Country, 2022-2032
Figure 121: Oceania Market Value (US$ Mn) by Drug Class, 2022-2032
Figure 122: Oceania Market Value (US$ Mn) by Route of Administration, 2022-2032
Figure 123: Oceania Market Value (US$ Mn) by Distribution Channel , 2022-2032
Figure 124: Oceania Market Value (US$ Mn) by Country, 2022-2032
Figure 125: Oceania Market Value (US$ Mn) Analysis by Country, 2017-2032
Figure 126: Oceania Market Value Share (%) and BPS Analysis by Country, 2022-2032
Figure 127: Oceania Market Y-o-Y Growth (%) Projections by Country, 2022-2032
Figure 128: Oceania Market Value (US$ Mn) Analysis by Drug Class, 2017-2032
Figure 129: Oceania Market Value Share (%) and BPS Analysis by Drug Class, 2022-2032
Figure 130: Oceania Market Y-o-Y Growth (%) Projections by Drug Class, 2022-2032
Figure 131: Oceania Market Value (US$ Mn) Analysis by Route of Administration, 2017-2032
Figure 132: Oceania Market Value Share (%) and BPS Analysis by Route of Administration, 2022-2032
Figure 133: Oceania Market Y-o-Y Growth (%) Projections by Route of Administration, 2022-2032
Figure 134: Oceania Market Value (US$ Mn) Analysis by Distribution Channel , 2017-2032
Figure 135: Oceania Market Value Share (%) and BPS Analysis by Distribution Channel , 2022-2032
Figure 136: Oceania Market Y-o-Y Growth (%) Projections by Distribution Channel , 2022-2032
Figure 137: Oceania Market Attractiveness by Drug Class, 2022-2032
Figure 138: Oceania Market Attractiveness by Route of Administration, 2022-2032
Figure 139: Oceania Market Attractiveness by Distribution Channel , 2022-2032
Figure 140: Oceania Market Attractiveness by Country, 2022-2032
Figure 141: MEA Market Value (US$ Mn) by Drug Class, 2022-2032
Figure 142: MEA Market Value (US$ Mn) by Route of Administration, 2022-2032
Figure 143: MEA Market Value (US$ Mn) by Distribution Channel , 2022-2032
Figure 144: MEA Market Value (US$ Mn) by Country, 2022-2032
Figure 145: MEA Market Value (US$ Mn) Analysis by Country, 2017-2032
Figure 146: MEA Market Value Share (%) and BPS Analysis by Country, 2022-2032
Figure 147: MEA Market Y-o-Y Growth (%) Projections by Country, 2022-2032
Figure 148: MEA Market Value (US$ Mn) Analysis by Drug Class, 2017-2032
Figure 149: MEA Market Value Share (%) and BPS Analysis by Drug Class, 2022-2032
Figure 150: MEA Market Y-o-Y Growth (%) Projections by Drug Class, 2022-2032
Figure 151: MEA Market Value (US$ Mn) Analysis by Route of Administration, 2017-2032
Figure 152: MEA Market Value Share (%) and BPS Analysis by Route of Administration, 2022-2032
Figure 153: MEA Market Y-o-Y Growth (%) Projections by Route of Administration, 2022-2032
Figure 154: MEA Market Value (US$ Mn) Analysis by Distribution Channel , 2017-2032
Figure 155: MEA Market Value Share (%) and BPS Analysis by Distribution Channel , 2022-2032
Figure 156: MEA Market Y-o-Y Growth (%) Projections by Distribution Channel , 2022-2032
Figure 157: MEA Market Attractiveness by Drug Class, 2022-2032
Figure 158: MEA Market Attractiveness by Route of Administration, 2022-2032
Figure 159: MEA Market Attractiveness by Distribution Channel , 2022-2032
Figure 160: MEA Market Attractiveness by Country, 2022-2032
Need specific information?
Request CustomizationExplore Healthcare Insights
View Reports