Vaginal Specula Market Size and Share Forecast Outlook 2025 to 2035

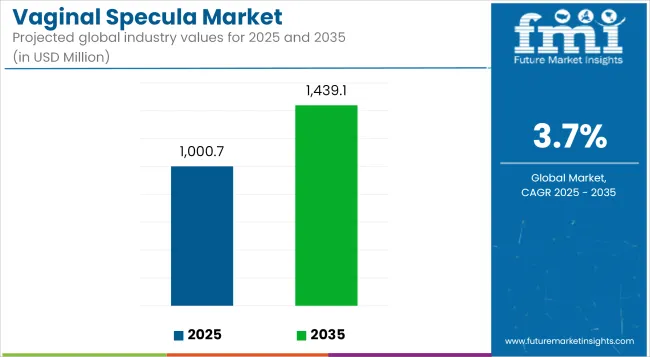
The Vaginal Specula Market is estimated to reach USD 1,000.7 million by 2025. From 2025 to 2035, the market is expected to grow at a CAGR of 3.7%, surpassing USD 1,439.1 million in sales by 2035.
Quick Stats for Vaginal Specula Market

  • Industry Value (2025): USD 1,000.7 million
  • Forecast Value (2035): USD 1,439.1 million
  • Forecast CAGR: 3.7%
  • Leading Segment in 2025: Disposable Specula (61.4% share)
  • Key Growth Region: Asia-Pacific, North America, Europe
  • Top Key Players: CooperSurgical, Inc., Welch Allyn (Hillrom/Baxter), OBP Medical Corporation, MedGyn Products, Inc., Integra LifeSciences Holdings Corp., Sklar Surgical Instruments

Vaginal Specula Market Industry Value Analysis

Metric Value
Industry Size (2025E) USD 1,000.7 million
Industry Value (2035F) USD 1,439.1 million
CAGR (2025 to 2035) 3.7%

The vaginal specula market is undergoing notable expansion, supported by a growing emphasis on women’s health screening programs, preventive gynecological care, and rising procedural volumes across both developed and emerging regions. Increased awareness about early detection of cervical and vaginal conditions has contributed to steady procedural demand in hospitals, ambulatory centers, and physician offices.

Regulatory frameworks have evolved to prioritize patient safety and infection control, which has incentivized the adoption of single-use, sterile instruments. Advancements in polymer engineering have enhanced the performance and ergonomics of disposable specula, reinforcing clinical preference and procurement policies that align with infection prevention protocols.

Healthcare provider investments in colposcopy infrastructure and gynecological examination capabilities have further accelerated the need for reliable and cost-effective specula solutions. Demographic trends indicating higher screening compliance among women in midlife and older age brackets are expected to sustain market momentum. Continued product innovation focusing on patient comfort, ease of use, and material sustainability is anticipated to shape purchasing decisions and drive differentiation in a competitive landscape.

Analyzing Vaginal Specula Market by Top Investment Segments

Disposable Specula Leading the Type Segment

In 2025, disposable specula are anticipated to hold a 33.8% revenue share in the vaginal specula market. This leadership has been driven by their role in mitigating cross-contamination risks and simplifying sterilization workflows. Regulatory guidelines have increasingly favored single-use instruments to support infection prevention initiatives in gynecological practices.

Hospitals and clinics have expressed preference for disposable models due to consistent quality, standardized performance, and reduced reprocessing costs. Advances in medical-grade polymer materials have contributed to improved strength and transparency, reinforcing clinician confidence during examinations.

Procurement policies emphasizing safety and operational efficiency have further accelerated adoption. Collectively, these dynamics have positioned disposable specula as the preferred type for a growing range of routine and diagnostic procedures.

Hospitals and Clinics as the Dominant End User

Hospitals and clinics are projected to account for 58.9% of the market share in 2025. This segment’s prominence has been attributed to their central role in cervical cancer screening programs, pelvic exams, and preventive gynecological services. Institutional purchasing strategies have increasingly prioritized bulk procurement of single-use specula to align with infection control policies and minimize turnaround time between procedures.

Clinical guidelines advocating for standardized examination protocols have supported higher procedural volumes in these settings. Additionally, investments in gynecology-focused outpatient infrastructure and dedicated women’s health clinics have bolstered demand. The combination of workflow efficiency, reimbursement alignment, and regulatory compliance has secured hospitals and clinics as the leading end users in the vaginal specula market.
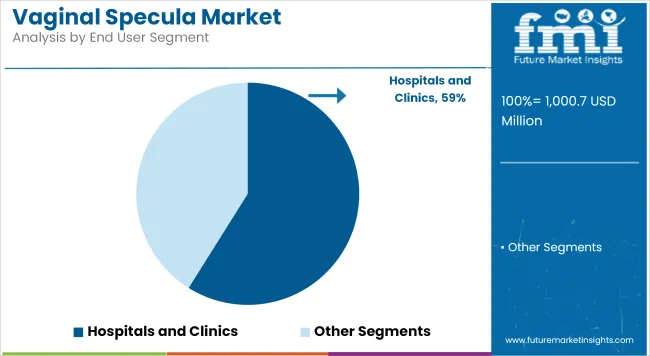
Vaginal Specula Market Analysis By End User Segment

Challenges and Opportunities

Challenge

Patient Discomfort and Reusability Concerns

The different market challenges in the vaginal specula relate to patient discomfort, clinician preference, and sterility concerns. Although reusable metal specula are less expensive in the long run, they cause cold sensations and anxiety, which eventually result in noncompliance of patients during pelvic exams.

The disposable plastic variants, on the contrary, face criticism with respect to environmental effects and add to medical waste. Non-standard size availability and wrong insertion technique are other factors that affect diagnostic quality, thus limiting user satisfaction.

There are many health systems in low-resource settings that may not have access to high-quality sterilisable materials or single-use products that can be sustainable, making it hard for this market to penetrate public health and routine gynecological care.

Opportunity

Demand for Patient-Centric, Single-Use, and Eco-Friendly Designs

The vaginal specula market will gradually develop, despite all these drawbacks, because the increasing awareness of women's health, the growing incidence of cervical cancer screening, and the demand for patient’s friendly, hygienic examination instruments are making room for the market.

One-time fabricated specimen from warm-feel plastic, with smoother edges and ergonomic handles, would go a long way toward gaining acceptance in outpatient and mobile health settings. Emerging innovations in biodegradable materials and temperature-neutral coatings are enhancing experiences while fulfilling sustainability goals.

The continuous expansion of gynecological services through telemedicine-supported clinics, urgent care centers, and global women health initiatives globalizes the already burgeoning demand for the best-designed, cost-effective, and environmentally responsible specula.
Country-Wise Outlook

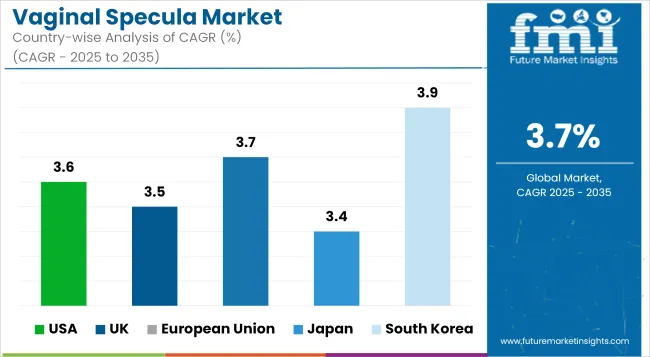
Vaginal Specula Market Cagr Analysis By Country

United States

Meaningful growth continues to propel the vaginal specula market in the United States with high volumes of pelvic exams, cervical cancer screenings, and obstetricgynecologic visits. The USA clinics and hospitals have been moving toward the use of single-use sterile plastic specula to minimize infection hazards, as well as very stringent regulatory hygiene specifications.

There is increasing demand for patient-centered innovations such as self-heating and ergonomically designed specula that ensure comfort and reduce anxiety during the examination.

Country CAGR (2025 to 2035)
USA 3.6%

United Kingdom

Market states that the United Kingdom is footed by NHS-led cervical screening programs and guidance since these have been extending to regularly promote pelvic assessments. Lightweight and disposable vaginal specula are being adopted by British providers across GP surgeries, community clinics, and hospital outpatient departments.

Sustainability and patient comfort are becoming the focus of procurement criteria, resulting in an increased use of recyclable and BPA-free materials.

Country CAGR (2025 to 2035)
UK 3.5%

European Union

Although a mature market for vaginal specula, the EU can be described as stable, especially in territories like Germany, France, and the Netherlands. Since these countries have public health programs focusing on HPV screening and gynecologic health, there is steady consistent demand for specula in public and private sectors alike.

Manufacturers, therefore, provide CE-marked disposable specula with integrated lighting and greater size availability, with special attention paid to the efficiency of procedure and the experience of patients.

Region CAGR (2025 to 2035)
European Union 3.7%

Japan

Japanese vaginal specula are experiencing moderate growth, which is well supported by government programs for cervical cancer prevention and the increasing population of aging females interested in routine gynecologic care. Japanese facilities prefer compact and low-noise specula that increase patient comfort and examination accuracy.

Interest is also increasing in single-use, sterile types to enhance outpatient flow and infection control.

Country CAGR (2025 to 2035)
Japan 3.4%

South Korea

As women's health issues become more visible, with a growing number of private clinics operating in the country and with government-supported screening programs, the vaginal specula market in South Korea continues to undergo steady growth. Local manufacturers of South Korea are supplying both plastic and metal vaginal specula, compatible with colposcopes and video-assisted gynecology systems.

The product design and innovation in the domestic market are taking shape on design ergonomics, sterility, and awareness for the patient.

Country CAGR (2025 to 2035)
South Korea 3.9%

Competitive Outlook

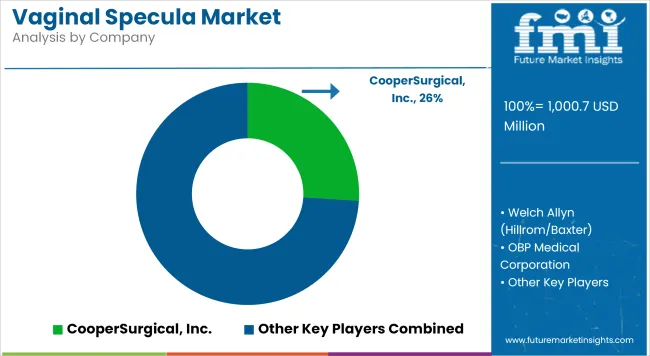
Vaginal Specula Market Analysis By Company

The vaginal specula market is moderately competitive, shaped by demand for patient comfort, infection control, and workflow efficiency in gynecological exams and procedures. Leading companies are focusing on innovations such as single-use disposable specula, integrated illumination, and ergonomic designs to improve visualization and reduce cross-contamination risks.

Strategic partnerships with hospitals, ambulatory surgery centers, and women’s health clinics, along with expanded distribution networks, are central to strengthening market presence. Additionally, growing emphasis on cost-effective disposable solutions and compliance with infection prevention protocols is accelerating the shift away from reusable stainless-steel devices in many regions.

  • In January 2025, OBP Medical Corporation launched the ONETRAC LX vaginal speculum, featuring built-in dual LED lighting and single-use design to streamline procedures and eliminate reprocessing.
  • In December 2024, Welch Allyn (Hillrom/Baxter) introduced a redesigned KleenSpec® disposable speculum with improved blade strength and smoother edges to enhance patient comfort.
  • In February 2025, CooperSurgical expanded its Milex® portfolio with a new adjustable vaginal speculum offering better visualization for office-based gynecological procedures.

Companies

  • CooperSurgical, Inc.
  • Welch Allyn (Hillrom/Baxter)
  • OBP Medical Corporation
  • MedGyn Products, Inc.
  • Integra LifeSciences Holdings Corp.
  • Sklar Surgical Instruments
  • Amsino International Inc.
  • SurgiLogix LLC
  • Pelican Feminine Healthcare Ltd.
  • Delasco LLC

Key Segments

By Product Type:

  • Vaginal Speculum with Smoke Evacuator

By Type:

  • Disposable
  • Reusable

By Procedure:

  • Electrosurgical Colposcopy
  • Endometrial Biopsy
  • General Examination
  • Others

By End User:

  • Hospitals and Clinics
  • Ambulatory Surgical Centers
  • Diagnostic Centers
  • Semi-Automatic

By Region:

  • North America
  • Latin America
  • Europe
  • Asia Pacific
  • The Middle East and Africa

Table of Content

  1. Executive Summary
  2. Industry Introduction, including Taxonomy and Market Definition
  3. Market Trends and Success Factors, including Macro-economic Factors, Market Dynamics, and Recent Industry Developments
  4. Global Market Demand Analysis 2020 to 2024 and Forecast 2025 to 2035, including Historical Analysis and Future Projections
  5. Global Market Analysis 2020 to 2024 and Forecast 2025 to 2035
    • Product Type
    • Type
    • Procedure
    • End User
  6. Global Market Analysis 2020 to 2024 and Forecast 2025 to 2035, By Product Type
    • Vaginal Speculum with Smoke Evacuator
  7. Global Market Analysis 2020 to 2024 and Forecast 2025 to 2035, By Type
    • Disposable
    • Reusable
  8. Global Market Analysis 2020 to 2024 and Forecast 2025 to 2035, By Procedure
    • Electrosurgical Colposcopy
    • Endometrial Biopsy
    • General Examination
    • Others
  9. Global Market Analysis 2020 to 2024 and Forecast 2025 to 2035, By End User
    • Hospitals and Clinics
    • Ambulatory Surgical Centers
    • Diagnostic Centers
    • Semi-Automatic
  10. Global Market Analysis 2020 to 2024 and Forecast 2025 to 2035, By Region
    • North America
    • Latin America
    • Western Europe
    • Eastern Europe
    • East Asia
    • South Asia Pacific
    • Middle East and Africa
  11. North America Sales Analysis 2020 to 2024 and Forecast 2025 to 2035, by Key Segments and Countries
  12. Latin America Sales Analysis 2020 to 2024 and Forecast 2025 to 2035, by Key Segments and Countries
  13. Western Europe Sales Analysis 2020 to 2024 and Forecast 2025 to 2035, by Key Segments and Countries
  14. Eastern Europe Sales Analysis 2020 to 2024 and Forecast 2025 to 2035, by Key Segments and Countries
  15. East Asia Sales Analysis 2020 to 2024 and Forecast 2025 to 2035, by Key Segments and Countries
  16. South Asia Pacific Sales Analysis 2020 to 2024 and Forecast 2025 to 2035, by Key Segments and Countries
  17. Middle East and Africa Sales Analysis 2020 to 2024 and Forecast 2025 to 2035, by Key Segments and Countries
  18. Sales Forecast 2025 to 2035 by Product Type, Type, Procedure, and End User for 30 Countries
  19. Competition Outlook, including Market Structure Analysis, Company Share Analysis by Key Players, and Competition Dashboard
  20. Company Profile
    • CooperSurgical, Inc.
    • Welch Allyn (Hillrom/Baxter)
    • OBP Medical Corporation
    • MedGyn Products, Inc.
    • Integra LifeSciences Holdings Corp.
    • Sklar Surgical Instruments
    • Amsino International Inc.
    • SurgiLogix LLC
    • Pelican Feminine Healthcare Ltd.
    • Delasco LLC

List of Tables

  • Table 1: Global Market Value (USD Million) Forecast by Region, 2020 to 2035
  • Table 2: Global Market Volume (Units) Forecast by Region, 2020 to 2035
  • Table 3: Global Market Value (USD Million) Forecast by Product Type, 2020 to 2035
  • Table 4: Global Market Volume (Units) Forecast by Product Type, 2020 to 2035
  • Table 5: Global Market Value (USD Million) Forecast by Type, 2020 to 2035
  • Table 6: Global Market Volume (Units) Forecast by Type, 2020 to 2035
  • Table 7: Global Market Value (USD Million) Forecast by Procedure, 2020 to 2035
  • Table 8: Global Market Volume (Units) Forecast by Procedure, 2020 to 2035
  • Table 9: Global Market Value (USD Million) Forecast by End-User, 2020 to 2035
  • Table 10: Global Market Volume (Units) Forecast by End-User, 2020 to 2035
  • Table 11: North America Market Value (USD Million) Forecast by Country, 2020 to 2035
  • Table 12: North America Market Volume (Units) Forecast by Country, 2020 to 2035
  • Table 13: North America Market Value (USD Million) Forecast by Product Type, 2020 to 2035
  • Table 14: North America Market Volume (Units) Forecast by Product Type, 2020 to 2035
  • Table 15: North America Market Value (USD Million) Forecast by Type, 2020 to 2035
  • Table 16: North America Market Volume (Units) Forecast by Type, 2020 to 2035
  • Table 17: North America Market Value (USD Million) Forecast by Procedure, 2020 to 2035
  • Table 18: North America Market Volume (Units) Forecast by Procedure, 2020 to 2035
  • Table 19: North America Market Value (USD Million) Forecast by End-User, 2020 to 2035
  • Table 20: North America Market Volume (Units) Forecast by End-User, 2020 to 2035
  • Table 21: Latin America Market Value (USD Million) Forecast by Country, 2020 to 2035
  • Table 22: Latin America Market Volume (Units) Forecast by Country, 2020 to 2035
  • Table 23: Latin America Market Value (USD Million) Forecast by Product Type, 2020 to 2035
  • Table 24: Latin America Market Volume (Units) Forecast by Product Type, 2020 to 2035
  • Table 25: Latin America Market Value (USD Million) Forecast by Type, 2020 to 2035
  • Table 26: Latin America Market Volume (Units) Forecast by Type, 2020 to 2035
  • Table 27: Latin America Market Value (USD Million) Forecast by Procedure, 2020 to 2035
  • Table 28: Latin America Market Volume (Units) Forecast by Procedure, 2020 to 2035
  • Table 29: Latin America Market Value (USD Million) Forecast by End-User, 2020 to 2035
  • Table 30: Latin America Market Volume (Units) Forecast by End-User, 2020 to 2035
  • Table 31: Western Europe Market Value (USD Million) Forecast by Country, 2020 to 2035
  • Table 32: Western Europe Market Volume (Units) Forecast by Country, 2020 to 2035
  • Table 33: Western Europe Market Value (USD Million) Forecast by Product Type, 2020 to 2035
  • Table 34: Western Europe Market Volume (Units) Forecast by Product Type, 2020 to 2035
  • Table 35: Western Europe Market Value (USD Million) Forecast by Type, 2020 to 2035
  • Table 36: Western Europe Market Volume (Units) Forecast by Type, 2020 to 2035
  • Table 37: Western Europe Market Value (USD Million) Forecast by Procedure, 2020 to 2035
  • Table 38: Western Europe Market Volume (Units) Forecast by Procedure, 2020 to 2035
  • Table 39: Western Europe Market Value (USD Million) Forecast by End-User, 2020 to 2035
  • Table 40: Western Europe Market Volume (Units) Forecast by End-User, 2020 to 2035
  • Table 41: Eastern Europe Market Value (USD Million) Forecast by Country, 2020 to 2035
  • Table 42: Eastern Europe Market Volume (Units) Forecast by Country, 2020 to 2035
  • Table 43: Eastern Europe Market Value (USD Million) Forecast by Product Type, 2020 to 2035
  • Table 44: Eastern Europe Market Volume (Units) Forecast by Product Type, 2020 to 2035
  • Table 45: Eastern Europe Market Value (USD Million) Forecast by Type, 2020 to 2035
  • Table 46: Eastern Europe Market Volume (Units) Forecast by Type, 2020 to 2035
  • Table 47: Eastern Europe Market Value (USD Million) Forecast by Procedure, 2020 to 2035
  • Table 48: Eastern Europe Market Volume (Units) Forecast by Procedure, 2020 to 2035
  • Table 49: Eastern Europe Market Value (USD Million) Forecast by End-User, 2020 to 2035
  • Table 50: Eastern Europe Market Volume (Units) Forecast by End-User, 2020 to 2035
  • Table 51: South Asia and Pacific Market Value (USD Million) Forecast by Country, 2020 to 2035
  • Table 52: South Asia and Pacific Market Volume (Units) Forecast by Country, 2020 to 2035
  • Table 53: South Asia and Pacific Market Value (USD Million) Forecast by Product Type, 2020 to 2035
  • Table 54: South Asia and Pacific Market Volume (Units) Forecast by Product Type, 2020 to 2035
  • Table 55: South Asia and Pacific Market Value (USD Million) Forecast by Type, 2020 to 2035
  • Table 56: South Asia and Pacific Market Volume (Units) Forecast by Type, 2020 to 2035
  • Table 57: South Asia and Pacific Market Value (USD Million) Forecast by Procedure, 2020 to 2035
  • Table 58: South Asia and Pacific Market Volume (Units) Forecast by Procedure, 2020 to 2035
  • Table 59: South Asia and Pacific Market Value (USD Million) Forecast by End-User, 2020 to 2035
  • Table 60: South Asia and Pacific Market Volume (Units) Forecast by End-User, 2020 to 2035
  • Table 61: East Asia Market Value (USD Million) Forecast by Country, 2020 to 2035
  • Table 62: East Asia Market Volume (Units) Forecast by Country, 2020 to 2035
  • Table 63: East Asia Market Value (USD Million) Forecast by Product Type, 2020 to 2035
  • Table 64: East Asia Market Volume (Units) Forecast by Product Type, 2020 to 2035
  • Table 65: East Asia Market Value (USD Million) Forecast by Type, 2020 to 2035
  • Table 66: East Asia Market Volume (Units) Forecast by Type, 2020 to 2035
  • Table 67: East Asia Market Value (USD Million) Forecast by Procedure, 2020 to 2035
  • Table 68: East Asia Market Volume (Units) Forecast by Procedure, 2020 to 2035
  • Table 69: East Asia Market Value (USD Million) Forecast by End-User, 2020 to 2035
  • Table 70: East Asia Market Volume (Units) Forecast by End-User, 2020 to 2035
  • Table 71: Middle East and Africa Market Value (USD Million) Forecast by Country, 2020 to 2035
  • Table 72: Middle East and Africa Market Volume (Units) Forecast by Country, 2020 to 2035
  • Table 73: Middle East and Africa Market Value (USD Million) Forecast by Product Type, 2020 to 2035
  • Table 74: Middle East and Africa Market Volume (Units) Forecast by Product Type, 2020 to 2035
  • Table 75: Middle East and Africa Market Value (USD Million) Forecast by Type, 2020 to 2035
  • Table 76: Middle East and Africa Market Volume (Units) Forecast by Type, 2020 to 2035
  • Table 77: Middle East and Africa Market Value (USD Million) Forecast by Procedure, 2020 to 2035
  • Table 78: Middle East and Africa Market Volume (Units) Forecast by Procedure, 2020 to 2035
  • Table 79: Middle East and Africa Market Value (USD Million) Forecast by End-User, 2020 to 2035
  • Table 80: Middle East and Africa Market Volume (Units) Forecast by End-User, 2020 to 2035

List of Figures

  • Figure 1: Global Market Value (USD Million) by Product Type, 2025 to 2035
  • Figure 2: Global Market Value (USD Million) by Type, 2025 to 2035
  • Figure 3: Global Market Value (USD Million) by Procedure, 2025 to 2035
  • Figure 4: Global Market Value (USD Million) by End-User, 2025 to 2035
  • Figure 5: Global Market Value (USD Million) by Region, 2025 to 2035
  • Figure 6: Global Market Value (USD Million) Analysis by Region, 2020 to 2035
  • Figure 7: Global Market Volume (Units) Analysis by Region, 2020 to 2035
  • Figure 8: Global Market Value Share (%) and BPS Analysis by Region, 2025 to 2035
  • Figure 9: Global Market Y-o-Y Growth (%) Projections by Region, 2025 to 2035
  • Figure 10: Global Market Value (USD Million) Analysis by Product Type, 2020 to 2035
  • Figure 11: Global Market Volume (Units) Analysis by Product Type, 2020 to 2035
  • Figure 12: Global Market Value Share (%) and BPS Analysis by Product Type, 2025 to 2035
  • Figure 13: Global Market Y-o-Y Growth (%) Projections by Product Type, 2025 to 2035
  • Figure 14: Global Market Value (USD Million) Analysis by Type, 2020 to 2035
  • Figure 15: Global Market Volume (Units) Analysis by Type, 2020 to 2035
  • Figure 16: Global Market Value Share (%) and BPS Analysis by Type, 2025 to 2035
  • Figure 17: Global Market Y-o-Y Growth (%) Projections by Type, 2025 to 2035
  • Figure 18: Global Market Value (USD Million) Analysis by Procedure, 2020 to 2035
  • Figure 19: Global Market Volume (Units) Analysis by Procedure, 2020 to 2035
  • Figure 20: Global Market Value Share (%) and BPS Analysis by Procedure, 2025 to 2035
  • Figure 21: Global Market Y-o-Y Growth (%) Projections by Procedure, 2025 to 2035
  • Figure 22: Global Market Value (USD Million) Analysis by End-User, 2020 to 2035
  • Figure 23: Global Market Volume (Units) Analysis by End-User, 2020 to 2035
  • Figure 24: Global Market Value Share (%) and BPS Analysis by End-User, 2025 to 2035
  • Figure 25: Global Market Y-o-Y Growth (%) Projections by End-User, 2025 to 2035
  • Figure 26: Global Market Attractiveness by Product Type, 2025 to 2035
  • Figure 27: Global Market Attractiveness by Type, 2025 to 2035
  • Figure 28: Global Market Attractiveness by Procedure, 2025 to 2035
  • Figure 29: Global Market Attractiveness by End-User, 2025 to 2035
  • Figure 30: Global Market Attractiveness by Region, 2025 to 2035
  • Figure 31: North America Market Value (USD Million) by Product Type, 2025 to 2035
  • Figure 32: North America Market Value (USD Million) by Type, 2025 to 2035
  • Figure 33: North America Market Value (USD Million) by Procedure, 2025 to 2035
  • Figure 34: North America Market Value (USD Million) by End-User, 2025 to 2035
  • Figure 35: North America Market Value (USD Million) by Country, 2025 to 2035
  • Figure 36: North America Market Value (USD Million) Analysis by Country, 2020 to 2035
  • Figure 37: North America Market Volume (Units) Analysis by Country, 2020 to 2035
  • Figure 38: North America Market Value Share (%) and BPS Analysis by Country, 2025 to 2035
  • Figure 39: North America Market Y-o-Y Growth (%) Projections by Country, 2025 to 2035
  • Figure 40: North America Market Value (USD Million) Analysis by Product Type, 2020 to 2035
  • Figure 41: North America Market Volume (Units) Analysis by Product Type, 2020 to 2035
  • Figure 42: North America Market Value Share (%) and BPS Analysis by Product Type, 2025 to 2035
  • Figure 43: North America Market Y-o-Y Growth (%) Projections by Product Type, 2025 to 2035
  • Figure 44: North America Market Value (USD Million) Analysis by Type, 2020 to 2035
  • Figure 45: North America Market Volume (Units) Analysis by Type, 2020 to 2035
  • Figure 46: North America Market Value Share (%) and BPS Analysis by Type, 2025 to 2035
  • Figure 47: North America Market Y-o-Y Growth (%) Projections by Type, 2025 to 2035
  • Figure 48: North America Market Value (USD Million) Analysis by Procedure, 2020 to 2035
  • Figure 49: North America Market Volume (Units) Analysis by Procedure, 2020 to 2035
  • Figure 50: North America Market Value Share (%) and BPS Analysis by Procedure, 2025 to 2035
  • Figure 51: North America Market Y-o-Y Growth (%) Projections by Procedure, 2025 to 2035
  • Figure 52: North America Market Value (USD Million) Analysis by End-User, 2020 to 2035
  • Figure 53: North America Market Volume (Units) Analysis by End-User, 2020 to 2035
  • Figure 54: North America Market Value Share (%) and BPS Analysis by End-User, 2025 to 2035
  • Figure 55: North America Market Y-o-Y Growth (%) Projections by End-User, 2025 to 2035
  • Figure 56: North America Market Attractiveness by Product Type, 2025 to 2035
  • Figure 57: North America Market Attractiveness by Type, 2025 to 2035
  • Figure 58: North America Market Attractiveness by Procedure, 2025 to 2035
  • Figure 59: North America Market Attractiveness by End-User, 2025 to 2035
  • Figure 60: North America Market Attractiveness by Country, 2025 to 2035
  • Figure 61: Latin America Market Value (USD Million) by Product Type, 2025 to 2035
  • Figure 62: Latin America Market Value (USD Million) by Type, 2025 to 2035
  • Figure 63: Latin America Market Value (USD Million) by Procedure, 2025 to 2035
  • Figure 64: Latin America Market Value (USD Million) by End-User, 2025 to 2035
  • Figure 65: Latin America Market Value (USD Million) by Country, 2025 to 2035
  • Figure 66: Latin America Market Value (USD Million) Analysis by Country, 2020 to 2035
  • Figure 67: Latin America Market Volume (Units) Analysis by Country, 2020 to 2035
  • Figure 68: Latin America Market Value Share (%) and BPS Analysis by Country, 2025 to 2035
  • Figure 69: Latin America Market Y-o-Y Growth (%) Projections by Country, 2025 to 2035
  • Figure 70: Latin America Market Value (USD Million) Analysis by Product Type, 2020 to 2035
  • Figure 71: Latin America Market Volume (Units) Analysis by Product Type, 2020 to 2035
  • Figure 72: Latin America Market Value Share (%) and BPS Analysis by Product Type, 2025 to 2035
  • Figure 73: Latin America Market Y-o-Y Growth (%) Projections by Product Type, 2025 to 2035
  • Figure 74: Latin America Market Value (USD Million) Analysis by Type, 2020 to 2035
  • Figure 75: Latin America Market Volume (Units) Analysis by Type, 2020 to 2035
  • Figure 76: Latin America Market Value Share (%) and BPS Analysis by Type, 2025 to 2035
  • Figure 77: Latin America Market Y-o-Y Growth (%) Projections by Type, 2025 to 2035
  • Figure 78: Latin America Market Value (USD Million) Analysis by Procedure, 2020 to 2035
  • Figure 79: Latin America Market Volume (Units) Analysis by Procedure, 2020 to 2035
  • Figure 80: Latin America Market Value Share (%) and BPS Analysis by Procedure, 2025 to 2035
  • Figure 81: Latin America Market Y-o-Y Growth (%) Projections by Procedure, 2025 to 2035
  • Figure 82: Latin America Market Value (USD Million) Analysis by End-User, 2020 to 2035
  • Figure 83: Latin America Market Volume (Units) Analysis by End-User, 2020 to 2035
  • Figure 84: Latin America Market Value Share (%) and BPS Analysis by End-User, 2025 to 2035
  • Figure 85: Latin America Market Y-o-Y Growth (%) Projections by End-User, 2025 to 2035
  • Figure 86: Latin America Market Attractiveness by Product Type, 2025 to 2035
  • Figure 87: Latin America Market Attractiveness by Type, 2025 to 2035
  • Figure 88: Latin America Market Attractiveness by Procedure, 2025 to 2035
  • Figure 89: Latin America Market Attractiveness by End-User, 2025 to 2035
  • Figure 90: Latin America Market Attractiveness by Country, 2025 to 2035
  • Figure 91: Western Europe Market Value (USD Million) by Product Type, 2025 to 2035
  • Figure 92: Western Europe Market Value (USD Million) by Type, 2025 to 2035
  • Figure 93: Western Europe Market Value (USD Million) by Procedure, 2025 to 2035
  • Figure 94: Western Europe Market Value (USD Million) by End-User, 2025 to 2035
  • Figure 95: Western Europe Market Value (USD Million) by Country, 2025 to 2035
  • Figure 96: Western Europe Market Value (USD Million) Analysis by Country, 2020 to 2035
  • Figure 97: Western Europe Market Volume (Units) Analysis by Country, 2020 to 2035
  • Figure 98: Western Europe Market Value Share (%) and BPS Analysis by Country, 2025 to 2035
  • Figure 99: Western Europe Market Y-o-Y Growth (%) Projections by Country, 2025 to 2035
  • Figure 100: Western Europe Market Value (USD Million) Analysis by Product Type, 2020 to 2035
  • Figure 101: Western Europe Market Volume (Units) Analysis by Product Type, 2020 to 2035
  • Figure 102: Western Europe Market Value Share (%) and BPS Analysis by Product Type, 2025 to 2035
  • Figure 103: Western Europe Market Y-o-Y Growth (%) Projections by Product Type, 2025 to 2035
  • Figure 104: Western Europe Market Value (USD Million) Analysis by Type, 2020 to 2035
  • Figure 105: Western Europe Market Volume (Units) Analysis by Type, 2020 to 2035
  • Figure 106: Western Europe Market Value Share (%) and BPS Analysis by Type, 2025 to 2035
  • Figure 107: Western Europe Market Y-o-Y Growth (%) Projections by Type, 2025 to 2035
  • Figure 108: Western Europe Market Value (USD Million) Analysis by Procedure, 2020 to 2035
  • Figure 109: Western Europe Market Volume (Units) Analysis by Procedure, 2020 to 2035
  • Figure 110: Western Europe Market Value Share (%) and BPS Analysis by Procedure, 2025 to 2035
  • Figure 111: Western Europe Market Y-o-Y Growth (%) Projections by Procedure, 2025 to 2035
  • Figure 112: Western Europe Market Value (USD Million) Analysis by End-User, 2020 to 2035
  • Figure 113: Western Europe Market Volume (Units) Analysis by End-User, 2020 to 2035
  • Figure 114: Western Europe Market Value Share (%) and BPS Analysis by End-User, 2025 to 2035
  • Figure 115: Western Europe Market Y-o-Y Growth (%) Projections by End-User, 2025 to 2035
  • Figure 116: Western Europe Market Attractiveness by Product Type, 2025 to 2035
  • Figure 117: Western Europe Market Attractiveness by Type, 2025 to 2035
  • Figure 118: Western Europe Market Attractiveness by Procedure, 2025 to 2035
  • Figure 119: Western Europe Market Attractiveness by End-User, 2025 to 2035
  • Figure 120: Western Europe Market Attractiveness by Country, 2025 to 2035
  • Figure 121: Eastern Europe Market Value (USD Million) by Product Type, 2025 to 2035
  • Figure 122: Eastern Europe Market Value (USD Million) by Type, 2025 to 2035
  • Figure 123: Eastern Europe Market Value (USD Million) by Procedure, 2025 to 2035
  • Figure 124: Eastern Europe Market Value (USD Million) by End-User, 2025 to 2035
  • Figure 125: Eastern Europe Market Value (USD Million) by Country, 2025 to 2035
  • Figure 126: Eastern Europe Market Value (USD Million) Analysis by Country, 2020 to 2035
  • Figure 127: Eastern Europe Market Volume (Units) Analysis by Country, 2020 to 2035
  • Figure 128: Eastern Europe Market Value Share (%) and BPS Analysis by Country, 2025 to 2035
  • Figure 129: Eastern Europe Market Y-o-Y Growth (%) Projections by Country, 2025 to 2035
  • Figure 130: Eastern Europe Market Value (USD Million) Analysis by Product Type, 2020 to 2035
  • Figure 131: Eastern Europe Market Volume (Units) Analysis by Product Type, 2020 to 2035
  • Figure 132: Eastern Europe Market Value Share (%) and BPS Analysis by Product Type, 2025 to 2035
  • Figure 133: Eastern Europe Market Y-o-Y Growth (%) Projections by Product Type, 2025 to 2035
  • Figure 134: Eastern Europe Market Value (USD Million) Analysis by Type, 2020 to 2035
  • Figure 135: Eastern Europe Market Volume (Units) Analysis by Type, 2020 to 2035
  • Figure 136: Eastern Europe Market Value Share (%) and BPS Analysis by Type, 2025 to 2035
  • Figure 137: Eastern Europe Market Y-o-Y Growth (%) Projections by Type, 2025 to 2035
  • Figure 138: Eastern Europe Market Value (USD Million) Analysis by Procedure, 2020 to 2035
  • Figure 139: Eastern Europe Market Volume (Units) Analysis by Procedure, 2020 to 2035
  • Figure 140: Eastern Europe Market Value Share (%) and BPS Analysis by Procedure, 2025 to 2035
  • Figure 141: Eastern Europe Market Y-o-Y Growth (%) Projections by Procedure, 2025 to 2035
  • Figure 142: Eastern Europe Market Value (USD Million) Analysis by End-User, 2020 to 2035
  • Figure 143: Eastern Europe Market Volume (Units) Analysis by End-User, 2020 to 2035
  • Figure 144: Eastern Europe Market Value Share (%) and BPS Analysis by End-User, 2025 to 2035
  • Figure 145: Eastern Europe Market Y-o-Y Growth (%) Projections by End-User, 2025 to 2035
  • Figure 146: Eastern Europe Market Attractiveness by Product Type, 2025 to 2035
  • Figure 147: Eastern Europe Market Attractiveness by Type, 2025 to 2035
  • Figure 148: Eastern Europe Market Attractiveness by Procedure, 2025 to 2035
  • Figure 149: Eastern Europe Market Attractiveness by End-User, 2025 to 2035
  • Figure 150: Eastern Europe Market Attractiveness by Country, 2025 to 2035
  • Figure 151: South Asia and Pacific Market Value (USD Million) by Product Type, 2025 to 2035
  • Figure 152: South Asia and Pacific Market Value (USD Million) by Type, 2025 to 2035
  • Figure 153: South Asia and Pacific Market Value (USD Million) by Procedure, 2025 to 2035
  • Figure 154: South Asia and Pacific Market Value (USD Million) by End-User, 2025 to 2035
  • Figure 155: South Asia and Pacific Market Value (USD Million) by Country, 2025 to 2035
  • Figure 156: South Asia and Pacific Market Value (USD Million) Analysis by Country, 2020 to 2035
  • Figure 157: South Asia and Pacific Market Volume (Units) Analysis by Country, 2020 to 2035
  • Figure 158: South Asia and Pacific Market Value Share (%) and BPS Analysis by Country, 2025 to 2035
  • Figure 159: South Asia and Pacific Market Y-o-Y Growth (%) Projections by Country, 2025 to 2035
  • Figure 160: South Asia and Pacific Market Value (USD Million) Analysis by Product Type, 2020 to 2035
  • Figure 161: South Asia and Pacific Market Volume (Units) Analysis by Product Type, 2020 to 2035
  • Figure 162: South Asia and Pacific Market Value Share (%) and BPS Analysis by Product Type, 2025 to 2035
  • Figure 163: South Asia and Pacific Market Y-o-Y Growth (%) Projections by Product Type, 2025 to 2035
  • Figure 164: South Asia and Pacific Market Value (USD Million) Analysis by Type, 2020 to 2035
  • Figure 165: South Asia and Pacific Market Volume (Units) Analysis by Type, 2020 to 2035
  • Figure 166: South Asia and Pacific Market Value Share (%) and BPS Analysis by Type, 2025 to 2035
  • Figure 167: South Asia and Pacific Market Y-o-Y Growth (%) Projections by Type, 2025 to 2035
  • Figure 168: South Asia and Pacific Market Value (USD Million) Analysis by Procedure, 2020 to 2035
  • Figure 169: South Asia and Pacific Market Volume (Units) Analysis by Procedure, 2020 to 2035
  • Figure 170: South Asia and Pacific Market Value Share (%) and BPS Analysis by Procedure, 2025 to 2035
  • Figure 171: South Asia and Pacific Market Y-o-Y Growth (%) Projections by Procedure, 2025 to 2035
  • Figure 172: South Asia and Pacific Market Value (USD Million) Analysis by End-User, 2020 to 2035
  • Figure 173: South Asia and Pacific Market Volume (Units) Analysis by End-User, 2020 to 2035
  • Figure 174: South Asia and Pacific Market Value Share (%) and BPS Analysis by End-User, 2025 to 2035
  • Figure 175: South Asia and Pacific Market Y-o-Y Growth (%) Projections by End-User, 2025 to 2035
  • Figure 176: South Asia and Pacific Market Attractiveness by Product Type, 2025 to 2035
  • Figure 177: South Asia and Pacific Market Attractiveness by Type, 2025 to 2035
  • Figure 178: South Asia and Pacific Market Attractiveness by Procedure, 2025 to 2035
  • Figure 179: South Asia and Pacific Market Attractiveness by End-User, 2025 to 2035
  • Figure 180: South Asia and Pacific Market Attractiveness by Country, 2025 to 2035
  • Figure 181: East Asia Market Value (USD Million) by Product Type, 2025 to 2035
  • Figure 182: East Asia Market Value (USD Million) by Type, 2025 to 2035
  • Figure 183: East Asia Market Value (USD Million) by Procedure, 2025 to 2035
  • Figure 184: East Asia Market Value (USD Million) by End-User, 2025 to 2035
  • Figure 185: East Asia Market Value (USD Million) by Country, 2025 to 2035
  • Figure 186: East Asia Market Value (USD Million) Analysis by Country, 2020 to 2035
  • Figure 187: East Asia Market Volume (Units) Analysis by Country, 2020 to 2035
  • Figure 188: East Asia Market Value Share (%) and BPS Analysis by Country, 2025 to 2035
  • Figure 189: East Asia Market Y-o-Y Growth (%) Projections by Country, 2025 to 2035
  • Figure 190: East Asia Market Value (USD Million) Analysis by Product Type, 2020 to 2035
  • Figure 191: East Asia Market Volume (Units) Analysis by Product Type, 2020 to 2035
  • Figure 192: East Asia Market Value Share (%) and BPS Analysis by Product Type, 2025 to 2035
  • Figure 193: East Asia Market Y-o-Y Growth (%) Projections by Product Type, 2025 to 2035
  • Figure 194: East Asia Market Value (USD Million) Analysis by Type, 2020 to 2035
  • Figure 195: East Asia Market Volume (Units) Analysis by Type, 2020 to 2035
  • Figure 196: East Asia Market Value Share (%) and BPS Analysis by Type, 2025 to 2035
  • Figure 197: East Asia Market Y-o-Y Growth (%) Projections by Type, 2025 to 2035
  • Figure 198: East Asia Market Value (USD Million) Analysis by Procedure, 2020 to 2035
  • Figure 199: East Asia Market Volume (Units) Analysis by Procedure, 2020 to 2035
  • Figure 200: East Asia Market Value Share (%) and BPS Analysis by Procedure, 2025 to 2035
  • Figure 201: East Asia Market Y-o-Y Growth (%) Projections by Procedure, 2025 to 2035
  • Figure 202: East Asia Market Value (USD Million) Analysis by End-User, 2020 to 2035
  • Figure 203: East Asia Market Volume (Units) Analysis by End-User, 2020 to 2035
  • Figure 204: East Asia Market Value Share (%) and BPS Analysis by End-User, 2025 to 2035
  • Figure 205: East Asia Market Y-o-Y Growth (%) Projections by End-User, 2025 to 2035
  • Figure 206: East Asia Market Attractiveness by Product Type, 2025 to 2035
  • Figure 207: East Asia Market Attractiveness by Type, 2025 to 2035
  • Figure 208: East Asia Market Attractiveness by Procedure, 2025 to 2035
  • Figure 209: East Asia Market Attractiveness by End-User, 2025 to 2035
  • Figure 210: East Asia Market Attractiveness by Country, 2025 to 2035
  • Figure 211: Middle East and Africa Market Value (USD Million) by Product Type, 2025 to 2035
  • Figure 212: Middle East and Africa Market Value (USD Million) by Type, 2025 to 2035
  • Figure 213: Middle East and Africa Market Value (USD Million) by Procedure, 2025 to 2035
  • Figure 214: Middle East and Africa Market Value (USD Million) by End-User, 2025 to 2035
  • Figure 215: Middle East and Africa Market Value (USD Million) by Country, 2025 to 2035
  • Figure 216: Middle East and Africa Market Value (USD Million) Analysis by Country, 2020 to 2035
  • Figure 217: Middle East and Africa Market Volume (Units) Analysis by Country, 2020 to 2035
  • Figure 218: Middle East and Africa Market Value Share (%) and BPS Analysis by Country, 2025 to 2035
  • Figure 219: Middle East and Africa Market Y-o-Y Growth (%) Projections by Country, 2025 to 2035
  • Figure 220: Middle East and Africa Market Value (USD Million) Analysis by Product Type, 2020 to 2035
  • Figure 221: Middle East and Africa Market Volume (Units) Analysis by Product Type, 2020 to 2035
  • Figure 222: Middle East and Africa Market Value Share (%) and BPS Analysis by Product Type, 2025 to 2035
  • Figure 223: Middle East and Africa Market Y-o-Y Growth (%) Projections by Product Type, 2025 to 2035
  • Figure 224: Middle East and Africa Market Value (USD Million) Analysis by Type, 2020 to 2035
  • Figure 225: Middle East and Africa Market Volume (Units) Analysis by Type, 2020 to 2035
  • Figure 226: Middle East and Africa Market Value Share (%) and BPS Analysis by Type, 2025 to 2035
  • Figure 227: Middle East and Africa Market Y-o-Y Growth (%) Projections by Type, 2025 to 2035
  • Figure 228: Middle East and Africa Market Value (USD Million) Analysis by Procedure, 2020 to 2035
  • Figure 229: Middle East and Africa Market Volume (Units) Analysis by Procedure, 2020 to 2035
  • Figure 230: Middle East and Africa Market Value Share (%) and BPS Analysis by Procedure, 2025 to 2035
  • Figure 231: Middle East and Africa Market Y-o-Y Growth (%) Projections by Procedure, 2025 to 2035
  • Figure 232: Middle East and Africa Market Value (USD Million) Analysis by End-User, 2020 to 2035
  • Figure 233: Middle East and Africa Market Volume (Units) Analysis by End-User, 2020 to 2035
  • Figure 234: Middle East and Africa Market Value Share (%) and BPS Analysis by End-User, 2025 to 2035
  • Figure 235: Middle East and Africa Market Y-o-Y Growth (%) Projections by End-User, 2025 to 2035
  • Figure 236: Middle East and Africa Market Attractiveness by Product Type, 2025 to 2035
  • Figure 237: Middle East and Africa Market Attractiveness by Type, 2025 to 2035
  • Figure 238: Middle East and Africa Market Attractiveness by Procedure, 2025 to 2035
  • Figure 239: Middle East and Africa Market Attractiveness by End-User, 2025 to 2035
  • Figure 240: Middle East and Africa Market Attractiveness by Country, 2025 to 2035

Frequently Asked Questions

What was the overall size of the vaginal specula market in 2025?

The overall market size for the vaginal specula market was USD 1,000.7 million in 2025.

How big is the vaginal specula market expected to be in 2035?

The vaginal specula market is expected to reach USD 1,439.1 million in 2035.

What will drive the demand for the vaginal specula market during the forecast period?

The increasing awareness of women's health screening, rising number of gynecological examinations, and growing use of disposable specula in hospital-based use fuel the vaginal specula market during the forecast period.

List the top 5 countries contributing to the vaginal specula market?

The top 5 countries driving the development of the vaginal specula market are the USA, UK, European Union, Japan, and South Korea.

Which segment in type is expected to lead in the vaginal specula market?

Disposable specula and hospital-based use lead market growth to command a significant share over the assessment period.

Explore Similar Insights

Future Market Insights

Vaginal Specula Market