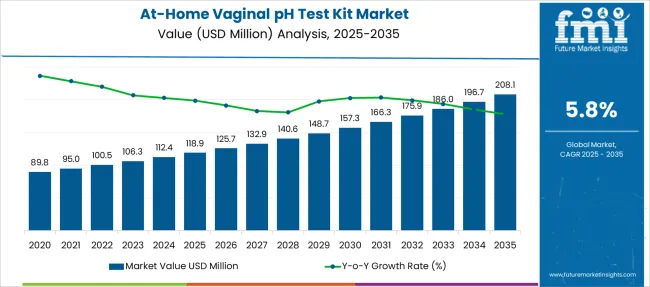
The At-Home Vaginal pH Test Kit Market is estimated to be valued at USD 118.9 million in 2025 and is projected to reach USD 208.1 million by 2035, registering a compound annual growth rate (CAGR) of 5.8% over the forecast period.
| Metric | Value |
|---|---|
| At-Home Vaginal pH Test Kit Market Estimated Value in (2025 E) | USD 118.9 million |
| At-Home Vaginal pH Test Kit Market Forecast Value in (2035 F) | USD 208.1 million |
| Forecast CAGR (2025 to 2035) | 5.8% |
The at-home vaginal pH test kit market is expanding rapidly due to growing awareness about women’s reproductive health and the convenience offered by self-testing products. Health organizations and consumer health reports have stressed the importance of early detection of vaginal infections to prevent complications and improve treatment outcomes.
Increasing health consciousness and the stigma around visiting clinics for intimate health issues have encouraged women to opt for discreet home testing solutions. Advancements in easy-to-use, accurate pH testing technology have increased user confidence and product adoption.
Additionally, expanding access to healthcare products through multiple distribution channels has improved availability. Future growth is expected to be driven by technological improvements, rising prevalence of vaginal infections, and increasing acceptance of self-care diagnostics. Segmental growth is projected to be led by Trichomoniasis as a key indication and Hospital Pharmacies as a major distribution channel due to their role in providing trusted health products.
The market is segmented by Indication and Distribution Channel and region. By Indication, the market is divided into Trichomoniasis, Bacterial Vaginosis, Yeast Infection, and Others. In terms of Distribution Channel, the market is classified into Hospital Pharmacies, Retail Pharmacies, Online Pharmacies, and Fertilization Centers. Regionally, the market is classified into North America, Latin America, Western Europe, Eastern Europe, Balkan & Baltic Countries, Russia & Belarus, Central Asia, East Asia, South Asia & Pacific, and the Middle East & Africa.
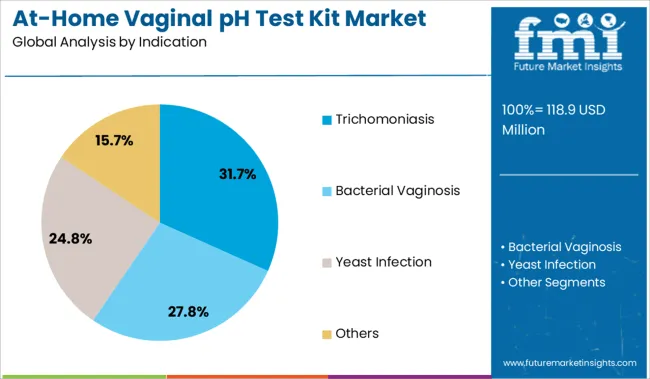
The Trichomoniasis segment is projected to account for 31.7% of the at-home vaginal pH test kit market revenue in 2025, maintaining its position as the leading indication segment. Growth in this segment has been driven by the relatively high prevalence of trichomoniasis, a common sexually transmitted infection that often causes vaginal pH imbalance.
Increased awareness campaigns have educated women about the symptoms and risks associated with this infection, leading to higher demand for early detection tools. Home testing kits offer privacy and convenience, enabling women to monitor their vaginal health regularly without immediate clinical visits.
The segment benefits from easy-to-understand test results and rapid feedback, facilitating timely medical consultation. As public health efforts continue to focus on reducing sexually transmitted infections, demand for trichomoniasis detection through at-home pH testing is expected to grow steadily.
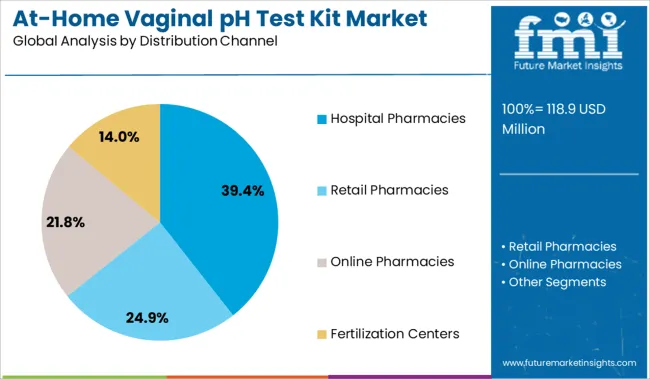
The Hospital Pharmacies segment is projected to hold 39.4% of the at-home vaginal pH test kit market revenue in 2025, sustaining its role as a key distribution channel. Hospital pharmacies are preferred due to their credibility and direct connection to healthcare providers, which builds consumer trust in at-home diagnostic products.
This channel also allows for professional guidance and access to related healthcare services, making it a convenient option for women seeking self-care solutions. Additionally, hospital pharmacies often serve as points of education where users can learn about product use and interpretation of results.
The established presence of hospital pharmacies in urban and semi-urban areas supports widespread product availability. With increasing healthcare provider endorsements and growing consumer preference for reliable sources, hospital pharmacies are expected to remain vital in distributing at-home vaginal pH test kits.
The At-Home Vaginal pH Test detects vaginal infections early. The pH of the vaginal fluid should be between 3.8 and 4.5. If a vaginal pH of 5.0 or higher is detected using at-home vaginal pH test kits, it indicates the presence of either trichomoniasis or bacterial vaginosis.
A pH less than 3.5, on the other hand, indicates the presence of yeast infection. Furthermore, at-home vaginal pH test kits are a cost-effective option for detecting vaginitis at home without visiting a doctor. Furthermore, the at-home vaginal pH test kit is useful for maintaining the pH balance of the vaginal area, early diagnosis of the disorder related to vaginal flora, prevention of vaginal infection, greater safety during pregnancy, and monitoring the effectiveness of any treatment. These factors and benefits are expected to drive the market for at-home vaginal pH test kits forward.
If the woman has recently had intercourse or is on her period, the results of at-home vaginal pH test kits may be inaccurate. Even after using an at-home vaginal pH test, most patients should still see a doctor or a gynecologist to get the most accurate diagnosis. These factors are expected to have a negative impact on the growth of the market for at-home vaginal pH test kits.
Asia Pacific is expected to be the largest market for At-Home Vaginal pH Test Kit during the forecast period owing to increasing awareness about vaginal infections as well as hygiene among the women in this region. The growing practice of self-testing is expected to augment the At-Home Vaginal pH Test Kit market. The region is forecast to surge in the upcoming years.
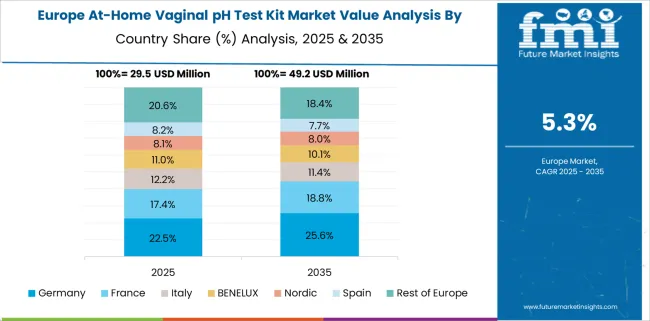
According to Future Market Insights, Europe is expected to provide immense growth opportunities for the At-Home Vaginal pH Test Kit, with Germany expected to steer the bulk of all regional growth. Extensive applications in the pharmaceutical industry are keeping sales of At-Home Vaginal pH Test Kit afloat across Germany.
Countries such as Poland, Belgium, the United Kingdom, and the Czech Republic are all also generating high demand for At-Home Vaginal pH Test Kit, as these regions are witnessing an increasing awareness of vaginal hygiene.
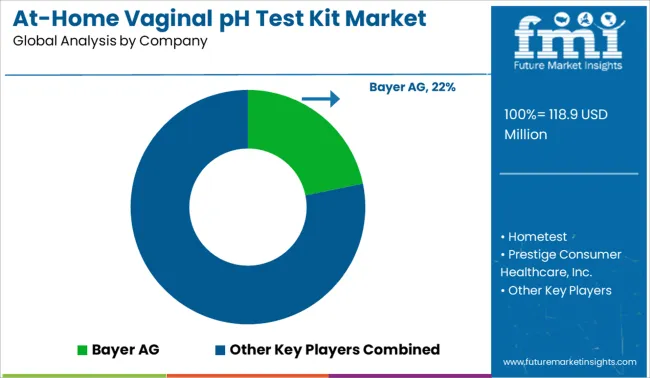
Home test, Bayer AG, Prestige Consumer Healthcare, Inc., GRÜNSPECHT Naturprodukte GmbH, Vagisil, and Dream Future Innovation are some of the market participants identified across the value chain in the Global At-Home Vaginal pH Test kit market.
| Report Attribute | Details |
|---|---|
| Growth Rate | CAGR of 5.8% from 2025 to 2035 |
| Base Year for Estimation | 2024 |
| Historical Data | 2020 to 2024 |
| Forecast Period | 2025 to 2035 |
| Quantitative Units | Revenue in USD Million, Volume in Kilotons, and CAGR from 2025 to 2035 |
| Report Coverage | Revenue Forecast, Volume Forecast, Company Ranking, Competitive Landscape, Growth Factors, Trends, and Pricing Analysis |
| Segments Covered | Distribution Channel, Region |
| Regions Covered | North America; Latin America; Western Europe; Eastern Europe; Asia Pacific Excluding China & Japan; China; Japan; Middle East and Africa |
| Key Countries Profiled | USA, Canada, Brazil, Mexico, Germany, United Kingdom, France, Spain, Italy, Nordics, BENELUX, Australia & New Zealand, India, ASIAN, GCC Countries, South Africa |
| Key Companies Profiled | Home test; Bayer AG; Prestige Consumer Healthcare, Inc.; GRÜNSPECHT Naturprodukte GmbH; Vagisil; Dream Future Innovation |
| Customization | Available Upon Request |
The global at-home vaginal pH test kit market is estimated to be valued at USD 118.9 million in 2025.
The market size for the at-home vaginal pH test kit market is projected to reach USD 208.1 million by 2035.
The at-home vaginal pH test kit market is expected to grow at a 5.8% CAGR between 2025 and 2035.
The key product types in at-home vaginal pH test kit market are trichomoniasis, bacterial vaginosis, yeast infection and others.
In terms of distribution channel, hospital pharmacies segment to command 39.4% share in the at-home vaginal pH test kit market in 2025.


Our Research Products

The "Full Research Suite" delivers actionable market intel, deep dives on markets or technologies, so clients act faster, cut risk, and unlock growth.

The Leaderboard benchmarks and ranks top vendors, classifying them as Established Leaders, Leading Challengers, or Disruptors & Challengers.

Locates where complements amplify value and substitutes erode it, forecasting net impact by horizon

We deliver granular, decision-grade intel: market sizing, 5-year forecasts, pricing, adoption, usage, revenue, and operational KPIs—plus competitor tracking, regulation, and value chains—across 60 countries broadly.

Spot the shifts before they hit your P&L. We track inflection points, adoption curves, pricing moves, and ecosystem plays to show where demand is heading, why it is changing, and what to do next across high-growth markets and disruptive tech

Real-time reads of user behavior. We track shifting priorities, perceptions of today’s and next-gen services, and provider experience, then pace how fast tech moves from trial to adoption, blending buyer, consumer, and channel inputs with social signals (#WhySwitch, #UX).

Partner with our analyst team to build a custom report designed around your business priorities. From analysing market trends to assessing competitors or crafting bespoke datasets, we tailor insights to your needs.
Supplier Intelligence
Discovery & Profiling
Capacity & Footprint
Performance & Risk
Compliance & Governance
Commercial Readiness
Who Supplies Whom
Scorecards & Shortlists
Playbooks & Docs
Category Intelligence
Definition & Scope
Demand & Use Cases
Cost Drivers
Market Structure
Supply Chain Map
Trade & Policy
Operating Norms
Deliverables
Buyer Intelligence
Account Basics
Spend & Scope
Procurement Model
Vendor Requirements
Terms & Policies
Entry Strategy
Pain Points & Triggers
Outputs
Pricing Analysis
Benchmarks
Trends
Should-Cost
Indexation
Landed Cost
Commercial Terms
Deliverables
Brand Analysis
Positioning & Value Prop
Share & Presence
Customer Evidence
Go-to-Market
Digital & Reputation
Compliance & Trust
KPIs & Gaps
Outputs
Full Research Suite comprises of:
Market outlook & trends analysis
Interviews & case studies
Strategic recommendations
Vendor profiles & capabilities analysis
5-year forecasts
8 regions and 60+ country-level data splits
Market segment data splits
12 months of continuous data updates
DELIVERED AS:
PDF EXCEL ONLINE
At-Home Testing Market Analysis - Growth, Demand & Forecast 2025 to 2035
At-home Ulcer Testing Market Size and Share Forecast Outlook 2025 to 2035
At-Home Cancer Testing Market - Growth & Forecast 2025 to 2035
At-home Molecular Testing Market Size and Share Forecast Outlook 2025 to 2035
At-Home Pregnancy Testing Market Size and Share Forecast Outlook 2025 to 2035
At-Home Micronutrient Testing Industry Share, Size, and Forecast 2025 to 2035
At-Home Food Sensitivity Test Market Size and Share Forecast Outlook 2025 to 2035
Global Advanced At-home Biomarker Testing Market Analysis – Size, Share & Forecast 2024-2034
Vaginal Spetula Market Size and Share Forecast Outlook 2025 to 2035
Vaginal Inserts Market Size and Share Forecast Outlook 2025 to 2035
Vaginal Antifungals Market Size and Share Forecast Outlook 2025 to 2035
Vaginal Specula Market Trends and Forecast 2025 to 2035
Vaginal and Vulval Inflammatory Diseases Treatment Market - Demand & Innovations 2025 to 2035
Vaginal Applicator Market Growth & Health Innovations 2024-2034
Vaginal Exam Specula Market
Vulvovaginal Candidiasis Treatment Market Size and Share Forecast Outlook 2025 to 2035
Kitchen/ Toilet Roll Converting Machines Market Size and Share Forecast Outlook 2025 to 2035
Kitting Robots Market Size and Share Forecast Outlook 2025 to 2035
Kitchen Tools and Accessories Market Size and Share Forecast Outlook 2025 to 2035
Kitchen Trailers Market Analysis - Size, Share, and Forecast Outlook 2025 to 2035

Thank you!
You will receive an email from our Business Development Manager. Please be sure to check your SPAM/JUNK folder too.
Chat With
MaRIA