At-home Food Sensitivity Test Market Snapshot

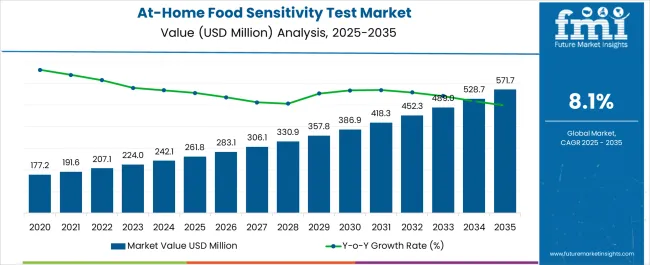
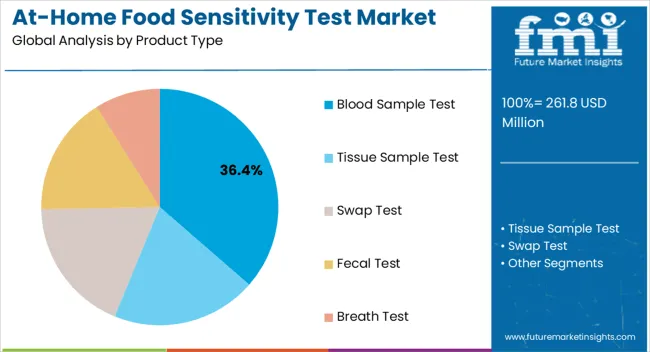
The global at-home food sensitivity test market was valued at US$ 222.4 million in 2023 and is expected to reach US$ 547 million by 2034. The blood sample test segment, with a market share of more than 33%, has topped the global market within the product category and is expected to record a CAGR of close to 8.5% over the forecast period.

At-home Food Sensitivity Test Market Trends

  • With technological advancements and consumer demand for convenient testing options, at-home food sensitivity tests have gained popularity.
  • At-home food sensitivity tests are much more economical than traditional laboratory testing, encouraging their expansion.
  • Increasing awareness about food sensitivities, growing consumer demand for personalized nutrition, and technological advancements.

Market Outlook:

Data Points Market Insights
Market Value 2023 US$ 222.4 million
Market Value 2024 US$ 241.4 million
Market Value 2034 US$ 547.0 million
CAGR 2024 to 2034 8.5%
Market Share of Top 5 Countries 51.2%
Key Market Players Vitagene, myLAB Box, FoodMarble Digestive Health Ltd., Laboratory Corporation of America Holdings, cerascreen LLC., Everlywell, Inc., YorkTest, TesMyAllergy (Global Science Technology Limited), 5Strands Affordable Testing, UCARI, Pinnertest Food Intolerance Test

Don't pay for what you don't need

Customize your report by selecting specific countries or regions and save 30%!

Sales Analysis of At-home Food Sensitivity Tests from 2019 to 2023 Vs Market Outlook for 2024 to 2034

The market value for at-home food sensitivity tests was around 3.4% of the overall US$ 6.5 million of the global self-testing market in 2023. The sale of at-home food sensitivity tests expanded at a CAGR of 8.0% from 2019 to 2023, in the past.

Food sensitivity can cause discomfort and pain due to symptoms such as fatigue, bloating, nausea, gastrointestinal stress, headaches, migraine, and stomach pain. To avoid this, at-home food sensitivity tests can be done to check the sensitivity of a particular food. Food sensitivity tests were primarily conducted in clinical settings by healthcare professionals.

The increased cases of food sensitivity are driving the demand for at-home food allergy tests. The market for food sensitivity tests is expanding as a result of an increase in the incidence of foodborne illnesses, changes in the regulatory environment, and increased consumer awareness regarding food intolerance.

Allergies require a precise diagnosis and effective care. There has been a striking surge in demand for at-home food sensitivity tests due to increased awareness of food allergy and sensitivity testing due to the increased cases of food sensitivity globally. Thus, the global market is expected to register a CAGR rate value of 8.5% during the forecast period.

Key Opportunities for the Manufacturers of At-home Food Sensitivity Tests

  • Companies operating in the at-home food sensitivity test market have the opportunity to expand their product offerings. This can include developing new testing methods, improved accuracy, and additional features to enhance user experience. Offering diverse test options and accurate food allergy tests can cater to different consumer needs and preferences.
  • At-home food sensitivity tests provide individuals with insights into their unique dietary sensitivities. This information can be used to personalize nutrition and wellness plans, leading to better management of symptoms and overall well-being. Companies can capitalize on this opportunity by integrating their testing services with personalized nutrition recommendations, dietary plans, or mobile applications.
  • At-home food sensitivity tests provide convenience and accessibility for consumers. They eliminate the need for doctor's appointments and laboratory visits, allowing individuals to test themselves in the comfort of their own homes. Manufacturers can focus on improving their testing kits' ease of use, accuracy, and reliability to attract more consumers. Other than this, increasing investment in research on food allergy and sensitivity is an additional factor that will stimulate market growth.
Sabyasachi Ghosh
Sabyasachi Ghosh

Principal Consultant

Talk to Analyst

Find your sweet spots for generating winning opportunities in this market.

Factors Restraining Demand for At-home Food Sensitivity Tests

  • These home tests might only sometimes show accurate results. Elevated immunoglobulin levels do not necessarily indicate an allergy and can, therefore, show false positive results. Home tests often cover a wide range of allergens and may test for dozens of different kinds. This factor is one of the main impeding factors in the growth of the at-home food sensitivity test market.
  • Because at-home food sensitivity tests are not covered by insurance, a person is required to pay out of pocket for the at-home food sensitivity testing, affecting the sales of these kits. These factors even cumulatively propose a negative effect on the developmental growth of the at-home food sensitivity test covered by insurance.

Country-wise Insights

Countries CAGR (2024 to 2034)
Germany 6.2%
India 7.3%

India is a Highly Lucrative Market for At-home Food Sensitivity Tests

India held a 57.2% share in the South Asia market in 2022 and is projected to display growth at a lucrative CAGR rate of 7.3% during the forecast period.

India initially had a low incidence of food allergy, but with changing lifestyles, the Indian population has become more prone to food sensitivity and allergy. As a result, Indians have started using at-home food sensitivity tests to check possible food allergies, as these tests are more affordable than laboratory tests and can test for food sensitivity for several common foods.

The United States has a Large Market for At-home Food Sensitivity Tests

The United States dominated the North American region with a total market share of about 80.9% in 2022 and is expected to continue to experience the same growth throughout the forecast period.

Because of the growing cases of food allergies in the United States, the country shares the leading market share for at-home food sensitivity tests. According to the Asthma and Allergy Foundation of America, in 2019, around 32 million people in the United States had a food allergy, of which 26 million were adults and the rest were children.

Over the past 20 years, there has been a rise in food allergies among the United States children, with black children experiencing the worst increase. Adults are most frequently allergic to shellfish, including peanuts and tree nuts. A growing food allergy is to sesame. All these factors contribute to the significant market share of this country in the regional market.

Germany At-home Food Sensitivity Test Market Outlook Remains Positive

Germany is set to exhibit a growth rate of 6.2% in the European at-home food sensitivity test market during the forecast period.

Increasing healthcare expenditure in Germany has helped this country's at-home food testing market boost. According to the World Bank data, the total healthcare expenditure of Germany in 2019 was 11.7% of the GDP. There can be seen greater awareness of the condition and healthcare spending in managing the condition, stimulating the market growth for the at-home food sensitivity market.

Get the data you need at a Fraction of the cost

Personalize your report by choosing insights you need
and save 40%!

Category-wise Insights

At-home Food Sensitivity Tests with Blood Sample is Driving Market Growth

Blood sample test is expected to present high growth at a rate of 7.9% by the end of the forecast period, with a market share of about 33.4% in 2023.

Attributes Details
Top Product Type Blood Sample Test
Market Share in 2023 33.4%

This method is preferred over other methods as these provide comparatively more accurate results than the other methods. This is because blood contains a small amount of the food allergen, which can be measured by the amount of specific antibodies in the blood, providing relatively accurate results.

Currently, Invasive At-home Food Sensitivity Tests are Mostly in Focus Globally

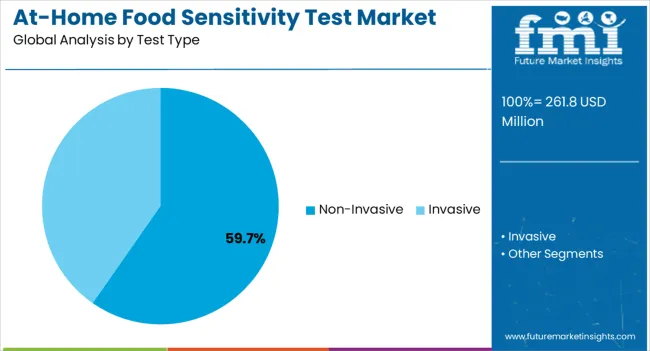
The invasive test type method held a significant revenue share of 63.4% in 2023 in the test type segment of the at-home food sensitivity test market, with a projected CAGR of 9.3% during the forecast period.

Attributes Details
Top Test Type Invasive
Market Share in 2023 63.4%

This is due to the preference for blood sample tests, an invasive test for determining food sensitivity.

Gastrointestinal Disease Indication Holds a Maximum Share in the Global At-home Food Sensitivity Test Market

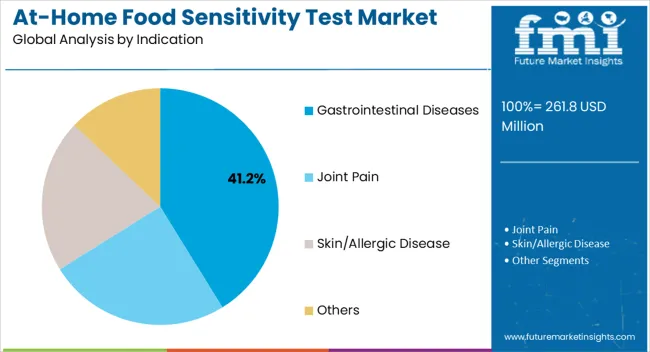
Gastrointestinal diseases held a significant revenue share of 41% in 2023 in the indication segment of the at-home food sensitivity test market, with a projected CAGR of 9.6% during the forecast period.

Attributes Details
Top Indication Type Gastrointestinal
Market Share in 2023 41%

This is attributed to a high rate of gastrointestinal issues associated with certain types of foods due to enzyme deficiency responsible for the breakdown of certain food elements. These symptoms generally kick in within hours and may cause diarrhea, gas and bloating, nausea, and stomach pain in an individual.

Sales of At-home Food Sensitivity Tests are More Through Hospital Pharmacies

Hospital pharmacies held a prominent market share of 38.2% in 2023.

Attributes Details
Top Distribution Channel Hospital Pharmacies
Market Share in 2023 38.2%

Hospital pharmacies hold the maximum share as people visit the hospitals after they start showing food sensitivity symptoms. They tend to visit the hospital pharmacies to buy the test kits after the hospital visit to get them tested for possible food allergens, propelling sales of the overall at-home food sensitivity tests.
Competitive Landscape

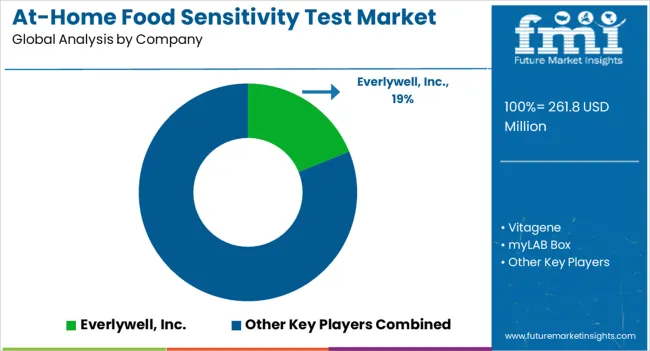
Due to the presence of significant companies, the global market for allergy testing kits is fragmented. The key firms frequently employ essential tactics like mergers and acquisitions, partnerships, strategic alliances, collaborations, and new product offerings.

Instances of key developmental strategies by the industry players in the at-home food sensitivity test market are given below:

  • In 2020, MyLab announced its partnership with Shaw's Syngene International, a top worldwide contract research organization, to provide a consistent supply of locally produced raw materials.
  • Labcorp in May 2022, announced its acquisition of diagnostic clinical laboratory services from AtlantiCare, to strengthen laboratory services and contribute to patient care.

Similarly, our analyst team has tracked recent developments related to companies manufacturing at-home food sensitivity test products, which are available in the full report.

Key Market Segments Covered in At-home Food Sensitivity Tests Industry Research

By Product Type:

  • Blood sample test
  • Tissue sample test
  • Swap test
  • Fecal test
  • Breath test

By Test Type:

  • Invasive
  • Non-invasive

By Indication:

  • Gastrointestinal diseases
  • Joint pain
  • Skin/allergic disease
  • Others

By Distribution channel:

  • Hospital Pharmacies
  • Retail Pharmacies
  • E-commerce

By Region:

  • North America
  • Latin America
  • Europe
  • South Asia
  • East Asia
  • Oceania
  • The Middle East and Africa (MEA)

Frequently Asked Questions

How Much Was the At-home Food Sensitivity Test Market Worth in 2023?

The at-home food sensitivity test market was US$ 222.4 million in 2023.

What is the Sales Forecast for the Market Through 2034?

The market is expected to reach US$ 547.0 million by the end of 2034.

What are the Trends Shaping the At-home Food Sensitivity Tests Industry?

Increasing consumer awareness, personalized nutrition, and wellness.

Which are the Top Countries Driving Food Sensitivity Tests at Home?

The United States, Germany, and India are the key countries in the market.

Who are the Key Players in the Market Sphere?

Vitagene, myLAB Box, and FoodMarble are some key players.

Table of Content
1. Executive Summary
    1.1. Global Market Outlook
    1.2. Demand Side Trends
    1.3. Supply Side Trends
    1.4. Market Round Offs
    1.5. FMI Analysis and Recommendations
2. Market Overview
    2.1. Market Coverage / Taxonomy
    2.2. Market Definition / Scope / Limitations
3. Market Trends & Dynamics 
    3.1. Per capita spending on s
    3.2. Key Trends Impacting the Market
    3.3. Product Innovation / Development Trends
        3.3.1. Latest Trends and Demands
        3.3.2. Latest Innovations and New Launches
    3.4. Future Prospects of s Industry
    3.5. Market Dynamics
        3.5.1. Drivers
        3.5.2. Restraints
        3.5.3. Opportunity Analysis
4. Value-Added Insights
    4.1. Product Adoption / Usage Analysis
    4.2. Disease Epidemiology, By Region
    4.3. Product USPs/Features Analysis
    4.4. New Product Launches
    4.5. Regulatory Landscape
    4.6. PESTEL Analysis
    4.7. Porter’s Five Force Analysis
    4.8. Value Chain Analysis
5. Market Background
    5.1. Macro-Economic Factors
        5.1.1. Global GDP Growth Outlook
        5.1.2. Global Healthcare Expenditure
    5.2. Forecast Factors - Relevance & Impact
        5.2.1. Key Player’s Historic Growth
        5.2.2. Market Consolidation Activities
        5.2.3. Rising Prevalence of Food Sensitivities
        5.2.4. Technological Advancements
        5.2.5. Diagnosis Rate
        5.2.6. Regulatory Environment
        5.2.7. Adoption Rate
6. Global Market Demand (in Value or Size in US$ Mn) Analysis 2017 to 2022 and Forecast, 2023 to 2033
    6.1. Historical Market Value (US$ Mn) Analysis, 2017 to 2022
    6.2. Current and Future Market Value (US$ Mn) Projections, 2023 to 2033
        6.2.1. Y-o-Y Growth Trend Analysis
        6.2.2. Absolute $ Opportunity Analysis
    6.3. Revenue Opportunity Scenario- Likely/Conservative/Optimistic
7. Global Market Analysis 2017 to 2022 and Forecast 2023–2033, by Product 
    7.1. Introduction / Key Findings
    7.2. Historical Market Size (US$ Mn) By Product, 2017 to 2022
    7.3. Current and Future Market Size (US$ Mn) Analysis and Forecast By Product, 2023 to 2033
        7.3.1. Blood sample test
        7.3.2. Tissue sample test
        7.3.3. Swap test
        7.3.4. Fecal test
        7.3.5. Breath test
    7.4. Market Attractiveness Analysis By Product
8. Global Market Analysis 2017 to 2022 and Forecast 2023–2033, By Test Type
    8.1. Introduction / Key Findings
    8.2. Historical Market Size (US$ Mn) Analysis By Test Type, 2017 to 2022
    8.3. Current and Future Market Size (US$ Mn) Analysis and Forecast By Test Type, 2023 to 2033
        8.3.1. Invasive
        8.3.2. Non-invasive
    8.4. Market Attractiveness Analysis By Test Type
9. Global Market Analysis 2017 to 2022 and Forecast 2023–2033, by Indication
    9.1. Introduction / Key Findings
    9.2. Historical Market Size (US$ Mn) Analysis By Indication, 2017 to 2022
    9.3. Current and Future Market Size (US$ Mn) Analysis and Forecast By Indication, 2023 to 2033
        9.3.1. Gastrointestinal diseases
        9.3.2. Joint pain
        9.3.3. Skin/allergic disease
        9.3.4. Others
    9.4. Market Attractiveness Analysis By Indication
10. Global Market Analysis 2017 to 2022 and Forecast 2023–2033, by Distribution Channel
    10.1. Introduction / Key Findings
    10.2. Historical Market Size (US$ Mn) Analysis, By Distribution Channel, 2017 to 2022
    10.3. Current and Future Market Size (US$ Mn) Analysis and Forecast By Distribution Channel, 2023 to 2033
        10.3.1. Hospital Pharmacies
        10.3.2. Retail Pharmacies
        10.3.3. E-commerce
    10.4. Market Attractiveness Analysis By Distribution Channel
11. Global Market Analysis 2017 to 2022 and Forecast 2023–2033, by Region
    11.1. Introduction
    11.2. Historical Market Size (US$ Mn) Analysis, By Region, 2017 to 2022
    11.3. Current and Future Market Size (US$ Mn) Analysis and Forecast By Region, 2023 to 2033
        11.3.1. North America
        11.3.2. Latin America
        11.3.3. Europe
        11.3.4. South Asia
        11.3.5. East Asia
        11.3.6. Oceania
        11.3.7. Middle East & Africa
    11.4. Market Attractiveness Analysis By Region
12. North America Market Analysis 2017 to 2022 and Forecast 2023–2033
    12.1. Introduction
    12.2. Historical Market Size (US$ Mn) Trend Analysis By Market Taxonomy, 2017 to 2022
    12.3. Current and Future Market Size (US$ Mn) Analysis and Forecast By Market Taxonomy, 2023 to 2033
        12.3.1. By Country
            12.3.1.1. USA
            12.3.1.2. Canada
        12.3.2. By Product
        12.3.3. By Test Type
        12.3.4. By Indication
        12.3.5. By Distribution Channel
    12.4. Market Attractiveness Analysis
        12.4.1. By Country
        12.4.2. By Product
        12.4.3. By Test Type
        12.4.4. By Indication
        12.4.5. By Distribution Channel
    12.5. Market Trends
    12.6. Market Drivers & Restraints – Intensity Mapping
    12.7. Country Level Analysis & Forecast
        12.7.1. USA Market Analysis
            12.7.1.1. Introduction
            12.7.1.2. Market Analysis and Forecast by Market Taxonomy
                12.7.1.2.1. By Product
                12.7.1.2.2. By Test Type
                12.7.1.2.3. By Indication
                12.7.1.2.4. By Distribution Channel
        12.7.2. Canada Market Analysis
            12.7.2.1. Introduction
            12.7.2.2. Market Analysis and Forecast by Market Taxonomy
                12.7.2.2.1. By Product
                12.7.2.2.2. By Test Type
                12.7.2.2.3. By Indication
                12.7.2.2.4. By Distribution Channel
13. Latin America Market Analysis 2017 to 2022 and Forecast 2023–2033
    13.1. Introduction
    13.2. Historical Market Size (US$ Mn) Trend Analysis By Market Taxonomy, 2017 to 2022
    13.3. Current and Future Market Size (US$ Mn) Analysis and Forecast By Market Taxonomy, 2023 to 2033
        13.3.1. By Country
            13.3.1.1. Brazil
            13.3.1.2. Mexico
            13.3.1.3. Argentina
            13.3.1.4. Rest of Latin America
        13.3.2. By Product
        13.3.3. By Test Type
        13.3.4. By Indication
        13.3.5. By Distribution Channel
    13.4. Market Attractiveness Analysis
        13.4.1. By Country
        13.4.2. By Product
        13.4.3. By Test Type
        13.4.4. By Indication
        13.4.5. By Distribution Channel
    13.5. Market Trends
    13.6. Market Drivers & Restraints – Intensity Mapping
    13.7. Country Level Analysis & Forecast
        13.7.1. Brazil Market Analysis
            13.7.1.1. Introduction
            13.7.1.2. Market Analysis and Forecast by Market Taxonomy
                13.7.1.2.1. By Product
                13.7.1.2.2. By Test Type
                13.7.1.2.3. By Indication
                13.7.1.2.4. By Distribution Channel
        13.7.2. Mexico Market Analysis
            13.7.2.1. Introduction
            13.7.2.2. Market Analysis and Forecast by Market Taxonomy
                13.7.2.2.1. By Product
                13.7.2.2.2. By Test Type
                13.7.2.2.3. By Indication
                13.7.2.2.4. By Distribution Channel
        13.7.3. Argentina Market Analysis
            13.7.3.1. Introduction
            13.7.3.2. Market Analysis and Forecast by Market Taxonomy
                13.7.3.2.1. By Product
                13.7.3.2.2. By Test Type
                13.7.3.2.3. By Indication
                13.7.3.2.4. By Distribution Channel
14. Europe Market Analysis 2017 to 2022 and Forecast 2023–2033
    14.1. Introduction
    14.2. Historical Market Size (US$ Mn) Trend Analysis By Market Taxonomy, 2017 to 2022
    14.3. Current and Future Market Size (US$ Mn) Analysis and Forecast By Market Taxonomy, 2023 to 2033
        14.3.1. By Country
            14.3.1.1. UK
            14.3.1.2. Germany
            14.3.1.3. Italy
            14.3.1.4. France
            14.3.1.5. Spain
            14.3.1.6. BENELUX
            14.3.1.7. Rest of Europe
        14.3.2. By Product
        14.3.3. By Test Type
        14.3.4. By Indication
        14.3.5. By Distribution Channel
    14.4. Market Attractiveness Analysis
        14.4.1. By Country
        14.4.2. By Product
        14.4.3. By Test Type
        14.4.4. By Indication
        14.4.5. By Distribution Channel
    14.5. Market Trends
    14.6. Market Drivers & Restraints – Intensity Mapping
    14.7. Country Level Analysis & Forecast
        14.7.1. UK Market Analysis
            14.7.1.1. Introduction
            14.7.1.2. Market Analysis and Forecast by Market Taxonomy
                14.7.1.2.1. By Product
                14.7.1.2.2. By Test Type
                14.7.1.2.3. By Indication
                14.7.1.2.4. By Distribution Channel
        14.7.2. Germany Market Analysis
            14.7.2.1. Introduction
            14.7.2.2. Market Analysis and Forecast by Market Taxonomy
                14.7.2.2.1. By Product
                14.7.2.2.2. By Test Type
                14.7.2.2.3. By Indication
                14.7.2.2.4. By Distribution Channel
        14.7.3. Italy Market Analysis
            14.7.3.1. Introduction
            14.7.3.2. Market Analysis and Forecast by Market Taxonomy
                14.7.3.2.1. By Product
                14.7.3.2.2. By Test Type
                14.7.3.2.3. By Indication
                14.7.3.2.4. By Distribution Channel
        14.7.4. France Market Analysis
            14.7.4.1. Introduction
            14.7.4.2. Market Analysis and Forecast by Market Taxonomy
                14.7.4.2.1. By Product
                14.7.4.2.2. By Test Type
                14.7.4.2.3. By Indication
                14.7.4.2.4. By Distribution Channel
        14.7.5. Spain Market Analysis
            14.7.5.1. Introduction
            14.7.5.2. Market Analysis and Forecast by Market Taxonomy
                14.7.5.2.1. By Product
                14.7.5.2.2. By Test Type
                14.7.5.2.3. By Indication
                14.7.5.2.4. By Distribution Channel
        14.7.6. BENELUX Market Analysis
            14.7.6.1. Introduction
            14.7.6.2. Market Analysis and Forecast by Market Taxonomy
                14.7.6.2.1. By Product
                14.7.6.2.2. By Test Type
                14.7.6.2.3. By Indication
                14.7.6.2.4. By Distribution Channel
15. East Asia Market Analysis 2017 to 2022 and Forecast 2023–2033
    15.1. Introduction
    15.2. Historical Market Size (US$ Mn) Trend Analysis By Market Taxonomy, 2017 to 2022
    15.3. Current and Future Market Size (US$ Mn) Analysis and Forecast By Market Taxonomy, 2023 to 2033
        15.3.1. By Country
            15.3.1.1. China
            15.3.1.2. Japan
            15.3.1.3. South Korea
        15.3.2. By Test Type
        15.3.3. By Indication
        15.3.4. By Distribution Channel
    15.4. Market Attractiveness Analysis
        15.4.1. By Country
        15.4.2. By Product
        15.4.3. By Test Type
        15.4.4. By Indication
        15.4.5. By Distribution Channel
    15.5. Market Trends
    15.6. Market Drivers & Restraints – Intensity Mapping
    15.7. Country Level Analysis & Forecast
        15.7.1. China Market Analysis
            15.7.1.1. Introduction
            15.7.1.2. Market Analysis and Forecast by Market Taxonomy
                15.7.1.2.1. By Product
                15.7.1.2.2. By Test Type
                15.7.1.2.3. By Indication
                15.7.1.2.4. By Distribution Channel
        15.7.2. Japan Market Analysis
            15.7.2.1. Introduction
            15.7.2.2. Market Analysis and Forecast by Market Taxonomy
                15.7.2.2.1. By Product
                15.7.2.2.2. By Test Type
                15.7.2.2.3. By Indication
                15.7.2.2.4. By Distribution Channel
        15.7.3. South Korea Market Analysis
            15.7.3.1. Introduction
            15.7.3.2. Market Analysis and Forecast by Market Taxonomy
                15.7.3.2.1. By Product
                15.7.3.2.2. By Test Type
                15.7.3.2.3. By Indication
                15.7.3.2.4. By Distribution Channel
16. South Asia Market Analysis 2017 to 2022 and Forecast 2023–2033
    16.1. Introduction
    16.2. Historical Market Size (US$ Mn) Trend Analysis By Market Taxonomy, 2017 to 2022
    16.3. Current and Future Market Size (US$ Mn) Analysis and Forecast By Market Taxonomy, 2023 to 2033
        16.3.1. By Country
            16.3.1.1. India
            16.3.1.2. Indonesia
            16.3.1.3. Malaysia
            16.3.1.4. Thailand
            16.3.1.5. Rest of South Asia
        16.3.2. By Product
        16.3.3. By Test Type
        16.3.4. By Indication
        16.3.5. By Distribution Channel
    16.4. Market Attractiveness Analysis
        16.4.1. By Country
        16.4.2. By Product
        16.4.3. By Test Type
        16.4.4. By Indication
        16.4.5. By Distribution Channel
    16.5. Market Trends
    16.6. Market Drivers & Restraints – Intensity Mapping
    16.7. Country Level Analysis & Forecast
        16.7.1. India Market Analysis
            16.7.1.1. Introduction
            16.7.1.2. Market Analysis and Forecast by Market Taxonomy
                16.7.1.2.1. By Product
                16.7.1.2.2. By Test Type
                16.7.1.2.3. By Indication
                16.7.1.2.4. By Distribution Channel
        16.7.2. Indonesia Market Analysis
            16.7.2.1. Introduction
            16.7.2.2. Market Analysis and Forecast by Market Taxonomy
                16.7.2.2.1. By Product
                16.7.2.2.2. By Test Type
                16.7.2.2.3. By Indication
                16.7.2.2.4. By Distribution Channel
        16.7.3. Malaysia Market Analysis
            16.7.3.1. Introduction
            16.7.3.2. Market Analysis and Forecast by Market Taxonomy
                16.7.3.2.1. By Product
                16.7.3.2.2. By Test Type
                16.7.3.2.3. By Indication
                16.7.3.2.4. By Distribution Channel
        16.7.4. Thailand Market Analysis
            16.7.4.1. Introduction
            16.7.4.2. Market Analysis and Forecast by Market Taxonomy
                16.7.4.2.1. By Product
                16.7.4.2.2. By Test Type
                16.7.4.2.3. By Indication
                16.7.4.2.4. By Distribution Channel
17. Oceania Market Analysis 2017 to 2022 and Forecast 2023–2033
    17.1. Introduction
    17.2. Historical Market Size (US$ Mn) Trend Analysis By Market Taxonomy, 2017 to 2022
    17.3. Current and Future Market Size (US$ Mn) Analysis and Forecast By Market Taxonomy, 2023 to 2033
        17.3.1. By Country
            17.3.1.1. Australia
            17.3.1.2. New Zealand
        17.3.2. By Product
        17.3.3. By Test Type
        17.3.4. By Indication
        17.3.5. By Distribution Channel
    17.4. Market Attractiveness Analysis
        17.4.1. By Country
        17.4.2. By Product
        17.4.3. By Test Type
        17.4.4. By Indication
        17.4.5. By Distribution Channel
    17.5. Market Trends
    17.6. Market Drivers & Restraints – Intensity Mapping
    17.7. Country Level Analysis & Forecast
        17.7.1. Australia Market Analysis
            17.7.1.1. Introduction
            17.7.1.2. Market Analysis and Forecast by Market Taxonomy
                17.7.1.2.1. By Product
                17.7.1.2.2. By Test Type
                17.7.1.2.3. By Indication
                17.7.1.2.4. By Distribution Channel
        17.7.2. New Zealand Market Analysis
            17.7.2.1. Introduction
            17.7.2.2. Market Analysis and Forecast by Market Taxonomy
                17.7.2.2.1. By Product
                17.7.2.2.2. By Test Type
                17.7.2.2.3. By Indication
                17.7.2.2.4. By Distribution Channel
18. Middle East & Africa Market Analysis 2017 to 2022 and Forecast 2023–2033
    18.1. Introduction
    18.2. Historical Market Size (US$ Mn) Trend Analysis By Market Taxonomy, 2017 to 2022
    18.3. Current and Future Market Size (US$ Mn) Analysis and Forecast By Market Taxonomy, 2023 to 2033
        18.3.1. By Country
            18.3.1.1. GCC Countries
            18.3.1.2. Türkiye
            18.3.1.3. South Africa
            18.3.1.4. Northern Africa
            18.3.1.5. Rest of MEA
        18.3.2. By Product
        18.3.3. By Test Type
        18.3.4. By Indication
        18.3.5. By Distribution Channel
    18.4. Market Attractiveness Analysis
        18.4.1. By Country
        18.4.2. By Product
        18.4.3. By Test Type
        18.4.4. By Indication
        18.4.5. By Distribution Channel
    18.5. Market Trends
    18.6. Market Drivers & Restraints – Intensity Mapping
    18.7. Country Level Analysis & Forecast
        18.7.1. GCC Countries Market Analysis
            18.7.1.1. Introduction
            18.7.1.2. Market Analysis and Forecast by Market Taxonomy
                18.7.1.2.1. By Product
                18.7.1.2.2. By Test Type
                18.7.1.2.3. By Indication
                18.7.1.2.4. By Distribution Channel
        18.7.2. Türkiye Market Analysis
            18.7.2.1. Introduction
            18.7.2.2. Market Analysis and Forecast by Market Taxonomy
                18.7.2.2.1. By Product
                18.7.2.2.2. By Test Type
                18.7.2.2.3. By Indication
                18.7.2.2.4. By Distribution Channel
        18.7.3. South Africa Market Analysis
            18.7.3.1. Introduction
            18.7.3.2. Market Analysis and Forecast by Market Taxonomy
                18.7.3.2.1. By Product
                18.7.3.2.2. By Test Type
                18.7.3.2.3. By Indication
                18.7.3.2.4. By Distribution Channel
        18.7.4. Northern Africa Market Analysis
            18.7.4.1. Introduction
            18.7.4.2. Market Analysis and Forecast by Market Taxonomy
                18.7.4.2.1. By Product
                18.7.4.2.2. By Test Type
                18.7.4.2.3. By Indication
                18.7.4.2.4. By Distribution Channel
19. Market Structure Analysis
    19.1. Market Analysis by Tier of Companies (s)
    19.2. Market Share Analysis of Top Players
    19.3. Market Concentration
20. Competition Analysis
    20.1. Competition Dashboard
    20.2. Branding and Promotional Strategies, By Key Players
    20.3. Key Development Analysis
    20.4. Competition Deep Dive
        20.4.1. Vitagene
            20.4.1.1. Overview
            20.4.1.2. Product Portfolio
            20.4.1.3. Key Financials
            20.4.1.4. SWOT Analysis
            20.4.1.5. Key Developments
            20.4.1.6. Sales Footprint
            20.4.1.7. Strategy Overview
                20.4.1.7.1. Marketing Strategy
                20.4.1.7.2. Product Strategy
                20.4.1.7.3. Channel Strategy
        20.4.2. myLAB Box
        20.4.3. FoodMarble Digestive Health Ltd
        20.4.4. Laboratory Corporation of America Holdings
        20.4.5. cerascreen LLC.
        20.4.6. Everlywell, Inc.
        20.4.7. YorkTest
        20.4.8. TesMyAllergy (Global Science Technology Limited)
        20.4.9. 5Strands Affordable Testing
        20.4.10. UCARI
        20.4.11. Pinnertest Food Intolerance Test
21. Assumptions and Acronyms Used
22. Research Methodology
Recommendations

Healthcare

Point-of-Care Food Sensitivity Testing Market

July 2023

REP-GB-17623

250 pages

Food and Beverage

Food Authenticity Testing Services Market

March 2023

REP-GB-12630

306 pages

Explore Healthcare Insights

View Reports
Future Market Insights

At-Home Food Sensitivity Test Market

Schedule a Call