Zymogens Market Size and Share Forecast Outlook 2025 to 2035

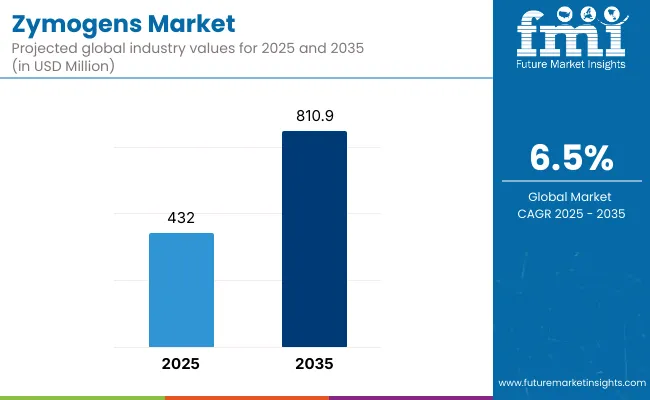
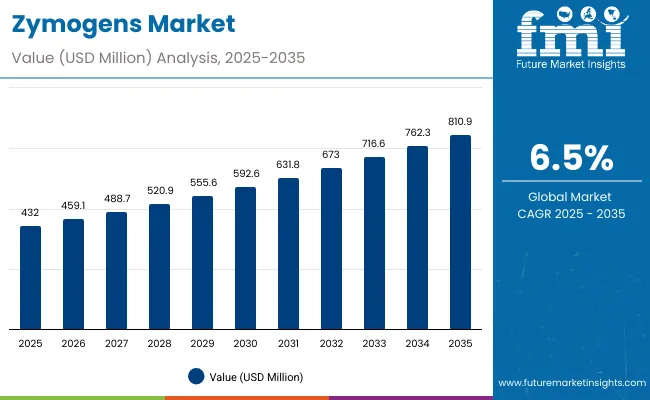
The Zymogens Market is projected to be valued at USD 432.0 million in 2025, rising to USD 810.9 million by 2035. This expansion reflects a USD 378.9 million increase, equivalent to nearly a 1.9X growth in size over the decade. The trajectory represents a compound annual growth rate (CAGR) of 6.5%, indicating steady yet resilient advancement across healthcare, industrial, and research-driven applications.
Zymogens Market 1

Quick Stats for Zymogens Market

  • Zymogens Market Value (2025): USD 432.0 million
  • Zymogens Market Forecast Value (2035): USD 810.9 million
  • Zymogens Forecast CAGR:6.5%
  • Leading Segment in Zymogens in 2025, by Product Type: Protease Zymogens (46.3%)
  • Key Growth Regions in the Zymogens: North America, Asia-Pacific, Europe
  • Top Key Players in Zymogens: Merck KGaA, Thermo Fisher Scientific, Novonesis, Codexis, Inc., Amano Enzyme Inc., Creative Enzymes, GenScript Biotech Corporation, Takara Bio Inc., Dyadic International, Inc., and Biosynth AG.

Zymogens Market Key Takeaways

Zymogens Market

Metric Value
Zymogens Estimated Value in (2025E) USD 432.0 million
Zymogens Forecast Value in (2035F) USD 810.9 million
Forecast CAGR (2025 to 2035) 6.5%

During the first five-year period from 2025 to 2030, the market is expected to expand from USD 432.0 million to approximately USD 592.6 million, adding USD 160.6 million. This phase accounts for 42% of total decade growth, highlighting early adoption across pharmaceutical and biologics applications. Growing recognition of zymogens’ ability to enhance precision and reduce variability in enzyme activation is anticipated to reinforce their inclusion in biologics pipelines and diagnostic innovations.

In the second half of the forecast period (2030–2035), the market is expected to grow from USD 592.6 million to 810.9 million, contributing USD 218.3 million, equal to 58% of decade expansion. This acceleration will likely be driven by intensified integration in bioprocessing, synthetic biology, and food biotechnology. The convergence of advanced protein engineering, regulatory alignment, and cross-industry collaborations is expected to position zymogens as critical enablers of scalable innovation, thereby ensuring long-term sustainability of market momentum.

From 2020 to 2024, the Zymogens Market expanded from niche enzyme applications into broader integration across pharmaceuticals, diagnostics, and industrial biotechnology. Growth during this period was primarily supported by pharmaceutical adoption, with biologics and diagnostics accounting for nearly half of revenue. Global leaders such as Merck KGaA and Thermo Fisher Scientific reinforced their dominance through biologics-focused enzyme solutions, while Novonesis and Amano Enzyme Inc. expanded industrial and food biotechnology portfolios.

Competitive differentiation relied on enzyme stability, precision in controlled activation, and scalability of recombinant production platforms. Service-led models were limited but gradually emerged in contract research and biotech collaborations. By 2025, demand is projected to reach USD 432.0 million, with the revenue mix shifting toward high-growth applications in research institutions and industrial biotech. Competitive advantage is increasingly being defined not only by enzyme portfolios but also by recombinant innovation, academic-industry partnerships, and region-specific adoption strategies. Emerging players emphasizing customization, molecular engineering, and application-specific zymogen solutions are expected to gain market share, challenging established leaders to innovate beyond traditional enzyme platforms.

Why the Zymogens Market is growing?

Growth in the Zymogens Market is being propelled by the rising adoption of controlled enzyme activation mechanisms across healthcare, biotechnology, and industrial applications. Demand is being reinforced by the increasing reliance on zymogens for precise regulation in biologics manufacturing, where stability and reduced off-target effects are being prioritized. The potential of zymogens to minimize side reactions and enhance therapeutic efficiency is being recognized as a transformative driver for their integration into next-generation drug development.

Pharmaceutical and diagnostics companies are increasingly channeling investments into zymogen-based research, with recombinant and microbial-derived sources being advanced for scalability and cost-effectiveness. Academic institutions and research organizations are contributing to this momentum through deeper exploration of zymogen activation pathways, supporting innovations in both therapeutic and diagnostic use cases. Expansion into industrial biotechnology and food processing is also being facilitated, where controlled enzymatic activity is being leveraged for improved process yields and product consistency.

Future growth is expected to be sustained through advancements in recombinant expression systems, enabling high-purity and tailored zymogen variants for commercial applications. With regulatory frameworks becoming more accommodating to biotechnology innovations, the Zymogens Market is being positioned as a critical enabler of precision-driven enzyme technologies across multiple high-value industries.

Segmental Analysis

The Zymogens Market is segmented by product type, end-use application, and form, each highlighting unique drivers of adoption and innovation. Product type segmentation encompasses protease, lipase, amylase, nuclease, and other enzyme zymogens, reflecting the diversity of enzymatic functions being integrated across industries. End-use applications span pharmaceuticals & biologics, diagnostics & research, food & beverage processing, industrial biotech, and academic institutions, showcasing the broad reach of zymogen technology. Form segmentation includes powders, liquid/suspension, and encapsulated/stabilized formats, representing the different delivery mechanisms shaping commercial adoption. Each segment reflects distinct growth dynamics influenced by technological innovation, regulatory support, and industry-specific demand patterns. The outlook suggests that traditional strongholds will continue to anchor revenue, while faster-growing niches are expected to create new opportunities for strategic expansion and cross-industry collaborations.
Insights into the Product Type Segment with Protease Zymogens leading in Market Share

Zymogens Market By Product Type

Product Type Segment Market Value Share, 2025
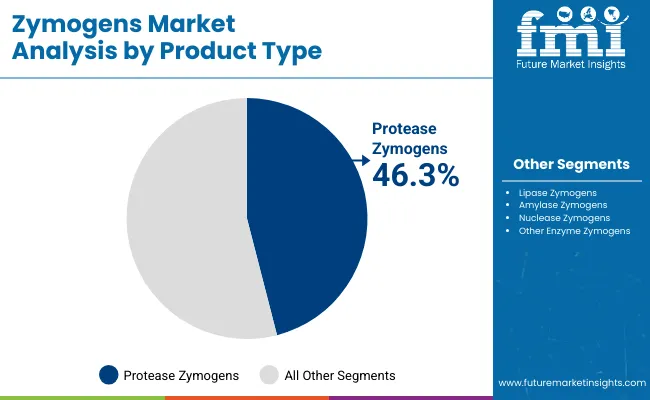
Protease Zymogens 46.3%
Lipase Zymogens 19.2%

Protease Zymogens are projected to command the largest share at 46.3% in 2025, maintaining their central role in the market. Their dominance is being reinforced by widespread application in pharmaceuticals, where controlled protease activity underpins drug development and therapeutic stability. Growth is also being supported by industrial processes that rely on protease zymogens for enhanced efficiency in bioprocessing and protein engineering. While this segment leads in scale, higher growth rates are being observed in nuclease and other zymogen classes, indicating a gradual diversification of demand. Continuous innovation in enzyme engineering and recombinant production methods is expected to reinforce the competitive strength of protease zymogens, ensuring their sustained relevance across high-value sectors.
Insights into the Form Segment with Powder Dominating the Demand

Zymogens Market By Form

Form 2025 Share%
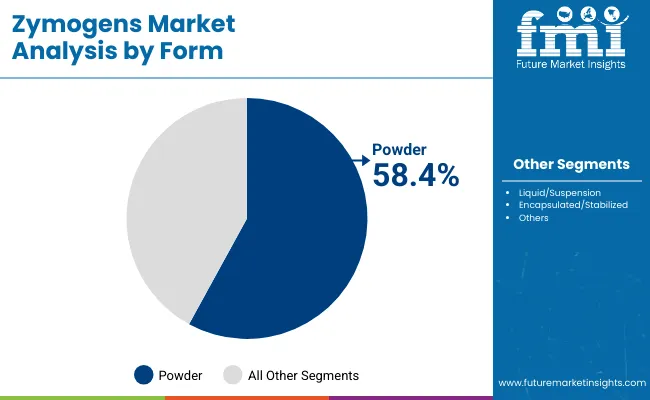
Powder (lyophilized, spray-dried) 58.4%
Liquid/Suspension 26.1%
Encapsulated/Stabilized 15.5%

Powder formulations are projected to account for 58.4% of the Zymogens Market in 2025, securing their lead due to longer shelf life, higher stability, and easier storage. Their dominance is being reinforced by widespread adoption in pharmaceuticals and industrial biotech, where consistent quality is essential. However, faster growth is being recorded in encapsulated and stabilized formats (9.0% CAGR), reflecting advances in delivery mechanisms tailored to research and therapeutic applications. Liquid suspensions are also gaining ground, offering convenience in laboratory and process-scale environments. The sustained leadership of powders underscores their role as the backbone of current commercialization, while innovation-driven forms are expected to gradually reshape the market landscape through enhanced usability and performance optimization.
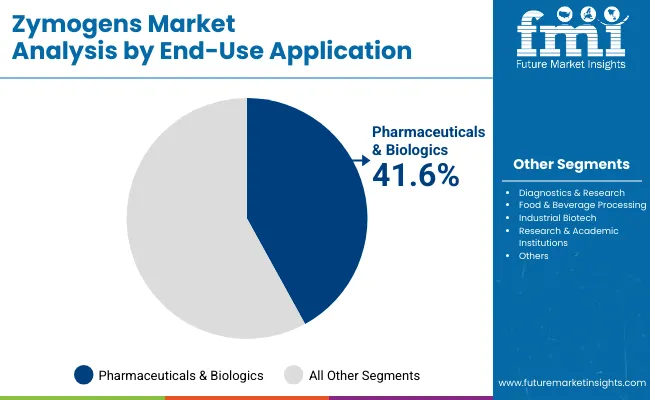
Insights into the End-Use Application Segment with Focus on Pharmaceuticals & Biologics

Zymogens Market By End Use

End-Use Application 2025 Share%
Pharmaceuticals & Biologics 41.6%
Diagnostics & Research 22.4%
Food & Beverage Processing 14.3%

Pharmaceuticals & Biologics are projected to lead with a 41.6% share in 2025, reflecting the strategic integration of zymogens into drug pipelines and biologic therapies. Their precision in controlled activation is being leveraged to reduce adverse reactions and improve therapeutic efficacy. Beyond clinical use, demand is being driven by biologics manufacturing, where stability and process consistency are critical. While this segment anchors overall revenue, rapid growth is being seen in research institutions and industrial biotech, signaling expansion into discovery and applied sciences. Over the coming decade, pharmaceuticals are expected to remain the backbone of zymogen adoption, yet cross-sectoral applications will increasingly balance market growth, reinforcing the role of zymogens in shaping both healthcare and industrial innovation.

What are the Drivers, Restraints, and Key Trends of the Zymogens Market?

Although challenges in cost efficiency and scalability persist, the Zymogens Market is being accelerated by rising demand in pharmaceuticals, diagnostics, and industrial biotechnology. Controlled activation properties are being recognized as critical to innovation, enabling precision-driven applications. Parallelly, industry-wide emphasis on novel biotechnologies is being reflected in emerging research pipelines and strategic collaborations, reinforcing long-term growth prospects.

Increasing Role in Biologics and Precision Medicine

Market expansion is being reinforced by the growing adoption of zymogens in biologics and precision medicine. Their controlled activation capacity is being utilized to enhance therapeutic safety, reduce off-target effects, and improve clinical outcomes. As demand for next-generation biologics increases, zymogens are being integrated into advanced pipelines, where scalable recombinant production systems are ensuring commercial viability. Regulatory recognition of their therapeutic value is further solidifying this trajectory, encouraging continued investment.

Advancements in Recombinant Expression and Stabilization

A major trend is being observed in the advancement of recombinant expression systems and stabilization technologies. Recombinant platforms are enabling the production of highly pure, customizable zymogen variants, aligning with pharmaceutical and diagnostic requirements. Simultaneously, innovations in encapsulated and stabilized formats are being prioritized to improve delivery efficiency and shelf life. These advancements are positioning zymogens as adaptable tools across diverse end-use industries, reshaping market competitiveness and long-term adoption pathways.
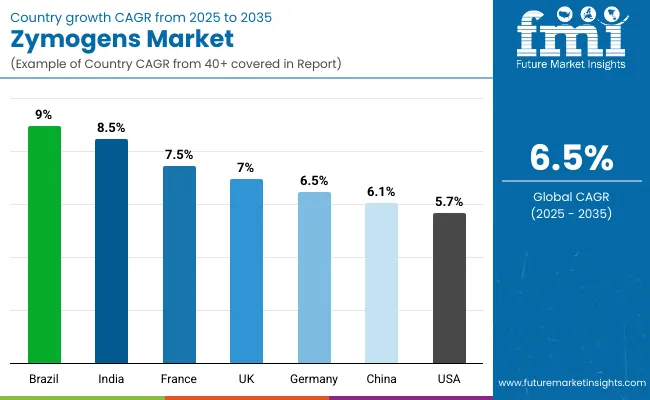
Analysis of Zymogens Market by Key Countries

Country Wise Zymogens Market

Country CAGR (2025 to 2035)
China 6.1%
India 8.5%
Germany 6.5%
France 7.5%
UK 7.0%
USA 5.7%
Brazil 9.0%

The global Zymogens Market is being shaped by distinct country-level growth trajectories, reflecting differences in industrial maturity, research capacity, and regulatory alignment. In Asia-Pacific, China is expected to advance at a 6.1% CAGR, supported by large-scale biopharmaceutical production and strong government focus on biotechnology innovation. India is projected to record the fastest regional growth at 8.5% CAGR, as research-driven institutions and contract manufacturing hubs increasingly integrate zymogens into biologics pipelines and diagnostic solutions.

In Europe, Germany is anticipated to expand at 6.5% CAGR, leveraging its established pharmaceutical and industrial biotech sectors. France at 7.5% CAGR and the UK at 7.0% CAGR are being positioned as leading innovation centers, propelled by strong research frameworks and academic-industry collaborations. Regulatory alignment with EU biotechnology standards is expected to further enhance adoption.

In North America, the USA is forecasted to grow at a 5.7% CAGR, reflecting market maturity but also consistent integration of zymogens into drug discovery, diagnostics, and food biotechnology applications. Growth is being driven more by advanced research and high-value biologics development rather than scale-driven production.

Latin America is being led by Brazil at a 9.0% CAGR, signaling rising adoption across food processing and industrial biotech, supported by expanding R&D capabilities and regional manufacturing initiatives.
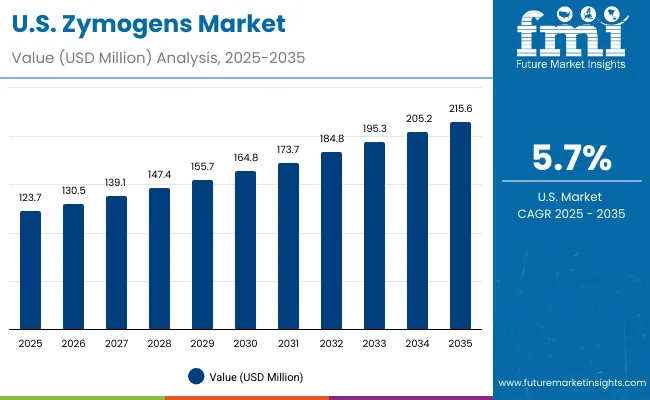
Sales Outlook for Zymogens in the United States

Usa Zymogens Market

Year USA Zymogens Market (USD Million)
2025 123.7
2026 130.5
2027 139.1
2028 147.4
2029 155.7
2030 164.8
2031 173.7
2032 184.8
2033 195.3
2034 205.2
2035 215.6

The Zymogens Market in the United States is projected to grow from USD 123.7 million in 2025 to USD 215.6 million by 2035, advancing at a CAGR of 5.7%. Growth is being reinforced by continued demand for biologics, diagnostics, and industrial applications, where controlled enzymatic activity is regarded as critical for precision and consistency.

Pharmaceutical adoption is being strengthened through integration into biologic pipelines, while diagnostic laboratories are increasingly employing zymogen-based assays to improve testing accuracy. Food biotechnology and industrial sectors are also expanding their utilization, supported by the efficiency gains offered by zymogen-controlled pathways. The trajectory is expected to be shaped by regulatory harmonization, advancements in recombinant expression, and expanding academic research partnerships.

  • Biologics development is driving sustained zymogen adoption in drug pipelines and therapeutic innovation.
  • Diagnostic laboratories are integrating zymogens for enhanced assay sensitivity and reliability.

Growth and Expansion Outlook for Zymogens Market in the United Kingdom

The Zymogens Market in the United Kingdom is projected to expand at a 7.0% CAGR from 2025 to 2035, supported by a well-established life sciences ecosystem and government-backed biotech initiatives. Growth is being reinforced by the UK’s strong presence in clinical trials and biologics research, where zymogens are being explored to enhance therapeutic precision and reduce variability in drug development. Rising investments through the UK’s Life Sciences Vision strategy are further enabling innovation in enzyme engineering and recombinant production.

In addition, food and beverage innovation is being advanced by zymogen-enabled fermentation technologies, reflecting growing consumer interest in functional nutrition and sustainable protein alternatives. The academic sector is also playing a vital role, with universities and research institutes contributing to early-stage zymogen engineering projects. These dynamics are expected to position the UK as a leading European hub for translational enzyme research, balancing healthcare and industrial adoption.

  • Life Sciences Vision initiatives are accelerating biotechnology adoption.
  • Functional food innovation is leveraging zymogen-driven fermentation.
  • Academic institutions are strengthening early-stage enzyme discovery.
  • Zymogens are being integrated into drug development and clinical research.

Growth and Expansion Outlook for Zymogens in China

The Zymogens Market in China is forecasted to grow at a 6.1% CAGR from 2025 to 2035, supported by the country’s expanding biopharmaceutical industry and government-backed biotech initiatives. Large-scale biologics production ecosystems are actively integrating zymogens to enhance stability and process efficiency. Academic institutions are contributing to early-stage innovation, with translational research being prioritized in genomics and molecular biology. Food and beverage sectors are also emerging as growth drivers, reflecting China’s strategic interest in precision fermentation and functional nutrition. Regulatory reforms that streamline approval pathways for biotechnology applications are expected to further reinforce market acceleration.

  • Biopharma ecosystems are integrating zymogens into large-scale biologics.
  • Government-backed biotech initiatives are driving long-term adoption.
  • Food and beverage sectors are utilizing zymogens for precision fermentation.
  • Regulatory streamlining is facilitating biotechnology commercialization.

Sales Outlook for Zymogens in India

The Zymogens Market in India is expected to record robust growth at an 8.5% CAGR through 2035, making it one of the fastest-expanding markets globally. Rapid investment in contract research and manufacturing services (CRAMS) is enabling zymogen integration into biologics and biosimilar pipelines. Government initiatives in biotechnology and life sciences are providing strong support, creating fertile ground for academic research and commercial application. Diagnostics laboratories are also expanding adoption, driven by rising healthcare access and a growing focus on precision medicine. In addition, industrial biotech applications, including fermentation and enzyme-controlled processes, are being scaled up to meet export-oriented production demand.
  • CRAMS sector is integrating zymogens into biologics and biosimilars.
  • Government biotech policies are catalyzing domestic innovation.
  • Diagnostic adoption is being reinforced by expanding healthcare access.
  • Industrial biotech applications are being scaled for export competitiveness.

In-depth Analysis of Zymogens in Germany

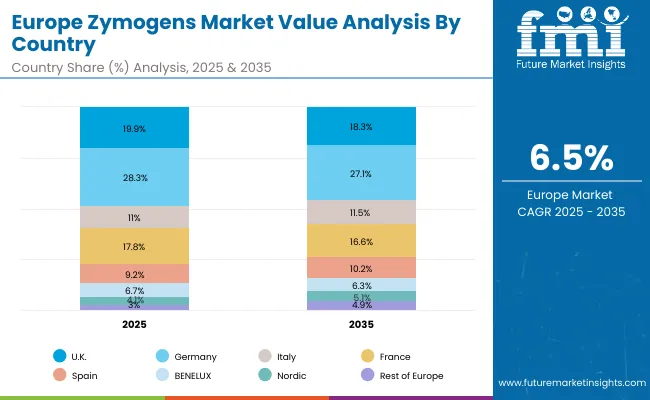
Europe Zymogens Market

Country 2025
UK 19.9%
Germany 28.3%
Italy 11.0%
France 17.8%
Spain 9.2%
BENELUX 6.7%
Nordic 4.1%
Rest of Europe 3.0%
Country 2035
UK 18.3%
Germany 27.1%
Italy 11.5%
France 16.6%
Spain 10.2%
BENELUX 6.3%
Nordic 5.1%
Rest of Europe 4.9%

The Zymogens Market in Germany is projected to expand at a 6.5% CAGR over the forecast period, anchored by its established pharmaceutical, diagnostics, and industrial biotech sectors. German biopharma manufacturers are incorporating zymogens into biologics pipelines, with precision-focused research reinforcing therapeutic innovation. Diagnostics adoption is rising, supported by Europe’s strong emphasis on clinical reliability and regulatory compliance. Industrial biotech utilization is also accelerating, particularly in enzyme-driven fermentation and process optimization. Germany’s role as a research hub is expected to sustain innovation-led growth, with academic and institutional collaborations advancing recombinant and stabilized zymogen formats.
  • Pharma and biotech sectors are strengthening biologics integration.
  • Diagnostics adoption is supported by clinical reliability standards.
  • Industrial biotech demand is reinforcing enzyme-driven process efficiency.
  • Academic collaborations are accelerating recombinant zymogen innovation.

Growth Outlook for Zymogens in Japan

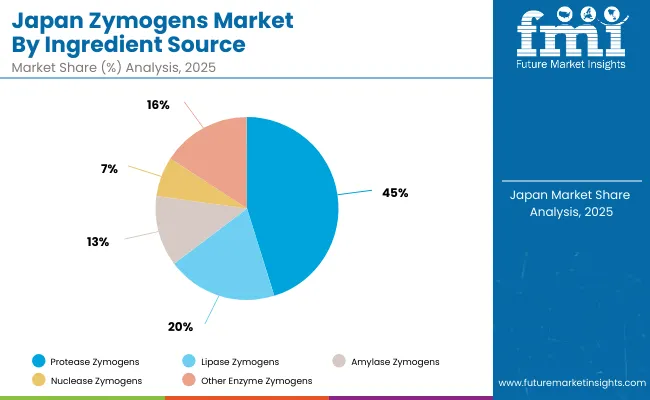
Japan Zymogens Market

Product Type Market Value Share, 2025
Protease Zymogens 46.3%
Lipase Zymogens 19.2%
Amylase Zymogens 12.7%
Nuclease Zymogens 6.8%
Other Enzyme Zymogens 15.0%

The Zymogens Market in Japan is projected at USD 25.6 million in 2025, with protease zymogens contributing 45.2%, while nuclease zymogens, though smaller in scale, are advancing fastest at a 7.0% CAGR. This dynamic illustrates a dual trajectory anchored by protease-driven applications in pharmaceuticals and biologics, while rapid expansion is being propelled by nucleases in genomics and molecular biology. Rising integration of recombinant expression systems in Japan’s established biotech sector is being reinforced by government funding for precision medicine and regenerative healthcare initiatives.

Beyond healthcare, industrial biotechnology is gradually adopting amylase and lipase zymogens for fermentation and enzyme-controlled processes, strengthening the diversification of use cases. Academic collaborations with global research institutions are further accelerating early-stage development, positioning Japan as a hub for translational science. With precision diagnostics and advanced biologics manufacturing expected to remain national priorities, the outlook suggests that protease dominance will persist, but nucleases and other specialized zymogens will gain rising importance in shaping the country’s innovation-led growth.
  • Japan holds a notable share of the global zymogens market in 2025.
  • Protease zymogens anchor the market, while nuclease zymogens expand fastest.
  • Government-backed regenerative medicine initiatives are fueling adoption.
  • Industrial biotech and academic collaborations are reinforcing diversification.

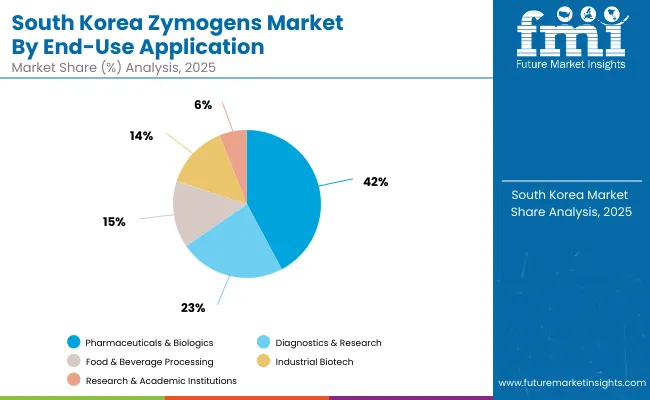
Opportunity Analysis of South Korea Zymogens Market

South Korea Zymogens Market

End-Use Application Market Value Share, 2025
Pharmaceuticals & Biologics 42.2%
Diagnostics & Research 23.2%
Food & Beverage Processing 14.6%
Industrial Biotech 13.9%
Research & Academic Institutions 6.1%

The Zymogens Market in South Korea is projected at USD 13.8 million in 2025, led by pharmaceuticals and biologics with a 42.2% share, supported by the country’s expanding biopharmaceutical ecosystem. Diagnostics and research applications follow closely, with strong government investment in precision medicine and healthcare technology driving adoption. Food and beverage processing represents a significant share, reflecting South Korea’s advanced food technology industry and increasing demand for functional and fermented products.

The fastest growth is being recorded in research and academic institutions (9.4% CAGR) and industrial biotechnology (8.8% CAGR), where early-stage R&D is being reinforced by collaborations with global players. Universities and biotech hubs are accelerating translational studies, focusing on recombinant and stabilized zymogen formats. These initiatives are positioning South Korea as a leading center for next-generation enzyme research in Asia.

With strong policy alignment under national biotech roadmaps and emphasis on digitalized healthcare, zymogens are expected to transition from niche applications into mainstream bioprocessing and diagnostic solutions. This trajectory underscores the dual strength of South Korea—anchoring value through pharmaceuticals while pushing frontier growth in research and industrial applications.
  • Pharmaceuticals remain the largest contributor, anchoring adoption.
  • Industrial Biotech drives the fastest adoption at 8.8% CAGR.
  • Industrial biotech gains traction in enzyme-driven process optimization.
  • Food technology integration expands zymogen utility in functional foods.

Competitive Landscape of Zymogens Market

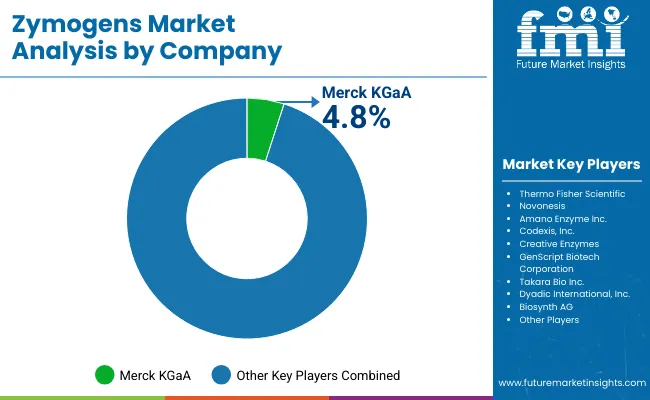
Zymogens Market By Company

Company Global Value Share 2025
Merck KGaA 4.8%
Others 95.2%

The Zymogens Market is moderately fragmented, with global leaders, mid-sized innovators, and specialized biotechnology firms competing across healthcare, industrial, and research domains. Global players such as Merck KGaA and Thermo Fisher Scientific are holding significant influence, leveraging strong portfolios in biologics, diagnostics, and life science solutions. Their strategies are being focused on recombinant zymogen development, scalable production platforms, and integration into pharmaceutical pipelines, reinforcing their leadership positions.

Established mid-sized innovators, including Novonesis, Codexis, Inc., and Amano Enzyme Inc., are contributing to accelerated adoption by emphasizing tailored enzymatic solutions for industrial biotechnology, food processing, and emerging therapeutic applications. Their competitive strength is being enhanced through partnerships, contract research services, and a focus on sustainability-driven enzyme innovation.

Specialized biotechnology firms such as GenScript Biotech Corporation, Takara Bio Inc., Dyadic International, Inc., and Biosynth AG are carving niches in academic and clinical research segments. Their differentiation is being built on customization, proprietary enzyme engineering platforms, and regional adaptability rather than global scale.

Competitive differentiation is expected to shift further from volume-driven supply to innovation-led ecosystems, where recombinant engineering, encapsulation technologies, and collaborative R&D partnerships are anticipated to define long-term market leadership.

Key Developments in Zymogens Market

  • Zymogen innovation is being prioritized within Merck’s Life Science division, where recombinant enzyme platforms are continuously expanded. Strategic integration of zymogens into biologics and diagnostics is being reinforced by regulatory alignment and R&D collaborations, positioning the company as a leader in therapeutic enzyme stability and controlled activation technologies.
  • Thermo Fisher’s zymogen focus is being advanced through its biologics and diagnostics portfolios. Research tools and enzyme-based assay kits are increasingly supported by zymogen integration, offering precision in activation control. Strategic collaborations with academic and pharma institutions are enabling translational applications, reinforcing Thermo Fisher’s competitive role in the zymogen space.

Scope of the Report

Item Value
Quantitative Units USD 432.0 million
Product Type Protease Zymogens, Lipase Zymogens, Amylase Zymogens, Nuclease Zymogens, Other Enzyme Zymogens
Source Animal-Derived, Microbial-Derived (bacterial/fungal), Recombinant (biotech expression systems)
Form Powder (Lyophilized, Spray-Dried), Liquid/Suspension, Encapsulated/Stabilized
End-Use Application Pharmaceuticals & Biologics, Diagnostics & Research, Food & Beverage Processing, Industrial Biotech, Research & Academic Institutions
Regions Covered North America, Europe, Asia-Pacific, Latin America, Middle East & Africa
Country Covered United States, Canada, Germany, France, United Kingdom, China, Japan, India, Brazil, South Africa
Key Companies Profiled Merck KGaA, Thermo Fisher Scientific, Novonesis, Amano Enzyme Inc., Codexis, Inc., Creative Enzymes, GenScript Biotech Corporation, Takara Bio Inc., Dyadic International, Inc., Biosynth AG
Additional Attributes Market outlook by product type, source, and end-use application; recombinant and microbial-derived zymogen adoption trends; application expansion in biologics, diagnostics, and food biotechnology; sector-specific opportunities in industrial biotech and academic R&D; regional growth dynamics shaped by policy support, biotech ecosystems, and academic-industry collaborations; innovation in recombinant expression systems, encapsulated formats, and zymogen engineering platforms.

Key Segments

By Product Type:

  • Protease Zymogens
  • Lipase Zymogens
  • Amylase Zymogens
  • Nuclease Zymogens
  • Other Enzyme Zymogens

By Source:

  • Animal-Derived
  • Microbial-Derived (bacterial/fungal)
  • Recombinant (biotech expression systems)

By Form:

  • Powder (lyophilized, spray-dried)
  • Liquid/Suspension
  • Encapsulated/Stabilized

By End-Use Application:

  • Food & Beverage Processing
  • Pharmaceuticals & Biologics
  • Diagnostics & Research
  • Industrial Biotech
  • Research & Academic Institutions

By Region:

  • North America
  • Latin America
  • Europe
  • East Asia
  • South Asia & Pacific
  • MEA

Table of Content

  1. Executive Summary
    • Global Market Outlook
    • Demand-side Trends
    • Supply-side Trends
    • Technology Roadmap Analysis
    • Analysis and Recommendations
  2. Market Overview
    • Market Coverage / Taxonomy
    • Market Definition / Scope / Limitations
  3. Market Background
    • Market Dynamics
      • Drivers
      • Restraints
      • Opportunity
      • Trends
    • Scenario Forecast
      • Demand in Optimistic Scenario
      • Demand in Likely Scenario
      • Demand in Conservative Scenario
    • Opportunity Map Analysis
    • Product Life Cycle Analysis
    • Supply Chain Analysis
    • Investment Feasibility Matrix
    • Value Chain Analysis
    • PESTLE and Porter’s Analysis
    • Regulatory Landscape
    • Regional Parent Market Outlook
    • Production and Consumption Statistics
    • Import and Export Statistics
  4. Global Market Analysis 2020 to 2024 and Forecast, 2025 to 2035
    • Historical Market Size Value (USD Million) & Volume (MT) Analysis, 2020 to 2024
    • Current and Future Market Size Value (USD Million) & Volume (MT) Projections, 2025 to 2035
      • Y-o-Y Growth Trend Analysis
      • Absolute $ Opportunity Analysis
  5. Global Market Pricing Analysis 2020 to 2024 and Forecast 2025 to 2035
  6. Global Market Analysis 2020 to 2024 and Forecast 2025 to 2035, By Product Type
    • Introduction / Key Findings
    • Historical Market Size Value (USD Million) & Volume (MT) Analysis By Product Type, 2020 to 2024
    • Current and Future Market Size Value (USD Million) & Volume (MT) Analysis and Forecast By Product Type, 2025 to 2035
      • Protease Zymogens
      • Lipase Zymogens
      • Amylase Zymogens
      • Nuclease Zymogens
      • Other Enzyme Zymogens
    • Y-o-Y Growth Trend Analysis By Product Type, 2020 to 2024
    • Absolute $ Opportunity Analysis By Product Type, 2025 to 2035
  7. Global Market Analysis 2020 to 2024 and Forecast 2025 to 2035, By Source
    • Introduction / Key Findings
    • Historical Market Size Value (USD Million) & Volume (MT) Analysis By Source, 2020 to 2024
    • Current and Future Market Size Value (USD Million) & Volume (MT) Analysis and Forecast By Source, 2025 to 2035
      • Animal-Derived
      • Microbial-Derived (bacterial/fungal)
      • Recombinant (biotech expression systems)
    • Y-o-Y Growth Trend Analysis By Source, 2020 to 2024
    • Absolute $ Opportunity Analysis By Source, 2025 to 2035
  8. Global Market Analysis 2020 to 2024 and Forecast 2025 to 2035, By Form
    • Introduction / Key Findings
    • Historical Market Size Value (USD Million) & Volume (MT) Analysis By Form, 2020 to 2024
    • Current and Future Market Size Value (USD Million) & Volume (MT) Analysis and Forecast By Form, 2025 to 2035
      • Powder (lyophilized, spray-dried)
      • Liquid/Suspension
      • Encapsulated/Stabilized
    • Y-o-Y Growth Trend Analysis By Form, 2020 to 2024
    • Absolute $ Opportunity Analysis By Form, 2025 to 2035
  9. Global Market Analysis 2020 to 2024 and Forecast 2025 to 2035, By End-Use Application
    • Introduction / Key Findings
    • Historical Market Size Value (USD Million) & Volume (MT) Analysis By End-Use Application, 2020 to 2024
    • Current and Future Market Size Value (USD Million) & Volume (MT) Analysis and Forecast By End-Use Application, 2025 to 2035
      • Food & Beverage Processing
      • Pharmaceuticals & Biologics
      • Diagnostics & Research
      • Industrial Biotech
      • Research & Academic Institutions
    • Y-o-Y Growth Trend Analysis By End-Use Application, 2020 to 2024
    • Absolute $ Opportunity Analysis By End-Use Application, 2025 to 2035
  10. Global Market Analysis 2020 to 2024 and Forecast 2025 to 2035, By Region
    • Introduction
    • Historical Market Size Value (USD Million) & Volume (MT) Analysis By Region, 2020 to 2024
    • Current Market Size Value (USD Million) & Volume (MT) Analysis and Forecast By Region, 2025 to 2035
      • North America
      • Latin America
      • Europe
      • East Asia
      • South Asia & Pacific
      • MEA
    • Market Attractiveness Analysis By Region
  11. North America Market Analysis 2020 to 2024 and Forecast 2025 to 2035, By Country
    • Historical Market Size Value (USD Million) & Volume (MT) Trend Analysis By Market Taxonomy, 2020 to 2024
    • Market Size Value (USD Million) & Volume (MT) Forecast By Market Taxonomy, 2025 to 2035
      • By Country
        • USA
        • Canada
      • By Product Type
      • By Source
      • By Form
      • By End-Use Application
    • Market Attractiveness Analysis
      • By Country
      • By Product Type
      • By Source
      • By Form
      • By End-Use Application
    • Key Takeaways
  12. Latin America Market Analysis 2020 to 2024 and Forecast 2025 to 2035, By Country
    • Historical Market Size Value (USD Million) & Volume (MT) Trend Analysis By Market Taxonomy, 2020 to 2024
    • Market Size Value (USD Million) & Volume (MT) Forecast By Market Taxonomy, 2025 to 2035
      • By Country
        • Brazil
        • Mexico
        • Colombia
        • Rest of Latin America
      • By Product Type
      • By Source
      • By Form
      • By End-Use Application
    • Market Attractiveness Analysis
      • By Country
      • By Product Type
      • By Source
      • By Form
      • By End-Use Application
    • Key Takeaways
  13. Europe Market Analysis 2020 to 2024 and Forecast 2025 to 2035, By Country
    • Historical Market Size Value (USD Million) & Volume (MT) Trend Analysis By Market Taxonomy, 2020 to 2024
    • Market Size Value (USD Million) & Volume (MT) Forecast By Market Taxonomy, 2025 to 2035
      • By Country
        • Germany
        • UK
        • France
        • Italy
        • Spain
        • Belgium
        • Netherlands
        • Nordic
        • Switzerland
        • Russia
        • Poland
        • Rest of Europe
      • By Product Type
      • By Source
      • By Form
      • By End-Use Application
    • Market Attractiveness Analysis
      • By Country
      • By Product Type
      • By Source
      • By Form
      • By End-Use Application
    • Key Takeaways
  14. East Asia Market Analysis 2020 to 2024 and Forecast 2025 to 2035, By Country
    • Historical Market Size Value (USD Million) & Volume (MT) Trend Analysis By Market Taxonomy, 2020 to 2024
    • Market Size Value (USD Million) & Volume (MT) Forecast By Market Taxonomy, 2025 to 2035
      • By Country
        • China
        • Japan
        • South Korea
      • By Product Type
      • By Source
      • By Form
      • By End-Use Application
    • Market Attractiveness Analysis
      • By Country
      • By Product Type
      • By Source
      • By Form
      • By End-Use Application
    • Key Takeaways
  15. South Asia & Pacific Market Analysis 2020 to 2024 and Forecast 2025 to 2035, By Country
    • Historical Market Size Value (USD Million) & Volume (MT) Trend Analysis By Market Taxonomy, 2020 to 2024
    • Market Size Value (USD Million) & Volume (MT) Forecast By Market Taxonomy, 2025 to 2035
      • By Country
        • India
        • Thailand
        • Malaysia
        • Indonesia
        • Singapore
        • Vietnam
        • Australia
        • New Zealand
        • Rest of South Asia & Pacific
      • By Product Type
      • By Source
      • By Form
      • By End-Use Application
    • Market Attractiveness Analysis
      • By Country
      • By Product Type
      • By Source
      • By Form
      • By End-Use Application
    • Key Takeaways
  16. MEA Market Analysis 2020 to 2024 and Forecast 2025 to 2035, By Country
    • Historical Market Size Value (USD Million) & Volume (MT) Trend Analysis By Market Taxonomy, 2020 to 2024
    • Market Size Value (USD Million) & Volume (MT) Forecast By Market Taxonomy, 2025 to 2035
      • By Country
        • Turkey
        • UAE
        • Saudi Arabia
        • Israel
        • Other GCC Countries
        • North Africa
        • South Africa
        • Central Africa
      • By Product Type
      • By Source
      • By Form
      • By End-Use Application
    • Market Attractiveness Analysis
      • By Country
      • By Product Type
      • By Source
      • By Form
      • By End-Use Application
    • Key Takeaways
  17. Key Countries Market Analysis
    • USA
      • Pricing Analysis
      • Market Share Analysis, 2024
        • By Product Type
        • By Source
        • By Form
        • By End-Use Application
    • Canada
      • Pricing Analysis
      • Market Share Analysis, 2024
        • By Product Type
        • By Source
        • By Form
        • By End-Use Application
    • Brazil
      • Pricing Analysis
      • Market Share Analysis, 2024
        • By Product Type
        • By Source
        • By Form
        • By End-Use Application
    • Mexico
      • Pricing Analysis
      • Market Share Analysis, 2024
        • By Product Type
        • By Source
        • By Form
        • By End-Use Application
    • Colombia
      • Pricing Analysis
      • Market Share Analysis, 2024
        • By Product Type
        • By Source
        • By Form
        • By End-Use Application
    • Germany
      • Pricing Analysis
      • Market Share Analysis, 2024
        • By Product Type
        • By Source
        • By Form
        • By End-Use Application
    • UK
      • Pricing Analysis
      • Market Share Analysis, 2024
        • By Product Type
        • By Source
        • By Form
        • By End-Use Application
    • France
      • Pricing Analysis
      • Market Share Analysis, 2024
        • By Product Type
        • By Source
        • By Form
        • By End-Use Application
    • Italy
      • Pricing Analysis
      • Market Share Analysis, 2024
        • By Product Type
        • By Source
        • By Form
        • By End-Use Application
    • Spain
      • Pricing Analysis
      • Market Share Analysis, 2024
        • By Product Type
        • By Source
        • By Form
        • By End-Use Application
    • Belgium
      • Pricing Analysis
      • Market Share Analysis, 2024
        • By Product Type
        • By Source
        • By Form
        • By End-Use Application
    • Netherlands
      • Pricing Analysis
      • Market Share Analysis, 2024
        • By Product Type
        • By Source
        • By Form
        • By End-Use Application
    • Nordic
      • Pricing Analysis
      • Market Share Analysis, 2024
        • By Product Type
        • By Source
        • By Form
        • By End-Use Application
    • Switzerland
      • Pricing Analysis
      • Market Share Analysis, 2024
        • By Product Type
        • By Source
        • By Form
        • By End-Use Application
    • Russia
      • Pricing Analysis
      • Market Share Analysis, 2024
        • By Product Type
        • By Source
        • By Form
        • By End-Use Application
    • Poland
      • Pricing Analysis
      • Market Share Analysis, 2024
        • By Product Type
        • By Source
        • By Form
        • By End-Use Application
    • China
      • Pricing Analysis
      • Market Share Analysis, 2024
        • By Product Type
        • By Source
        • By Form
        • By End-Use Application
    • Japan
      • Pricing Analysis
      • Market Share Analysis, 2024
        • By Product Type
        • By Source
        • By Form
        • By End-Use Application
    • South Korea
      • Pricing Analysis
      • Market Share Analysis, 2024
        • By Product Type
        • By Source
        • By Form
        • By End-Use Application
    • India
      • Pricing Analysis
      • Market Share Analysis, 2024
        • By Product Type
        • By Source
        • By Form
        • By End-Use Application
    • Thailand
      • Pricing Analysis
      • Market Share Analysis, 2024
        • By Product Type
        • By Source
        • By Form
        • By End-Use Application
    • Indonesia
      • Pricing Analysis
      • Market Share Analysis, 2024
        • By Product Type
        • By Source
        • By Form
        • By End-Use Application
    • Australia
      • Pricing Analysis
      • Market Share Analysis, 2024
        • By Product Type
        • By Source
        • By Form
        • By End-Use Application
    • New Zealand
      • Pricing Analysis
      • Market Share Analysis, 2024
        • By Product Type
        • By Source
        • By Form
        • By End-Use Application
    • Turkey
      • Pricing Analysis
      • Market Share Analysis, 2024
        • By Product Type
        • By Source
        • By Form
        • By End-Use Application
    • UAE
      • Pricing Analysis
      • Market Share Analysis, 2024
        • By Product Type
        • By Source
        • By Form
        • By End-Use Application
    • Saudi Arabia
      • Pricing Analysis
      • Market Share Analysis, 2024
        • By Product Type
        • By Source
        • By Form
        • By End-Use Application
    • Israel
      • Pricing Analysis
      • Market Share Analysis, 2024
        • By Product Type
        • By Source
        • By Form
        • By End-Use Application
    • North Africa
      • Pricing Analysis
      • Market Share Analysis, 2024
        • By Product Type
        • By Source
        • By Form
        • By End-Use Application
    • South Africa
      • Pricing Analysis
      • Market Share Analysis, 2024
        • By Product Type
        • By Source
        • By Form
        • By End-Use Application
  18. Market Structure Analysis
    • Competition Dashboard
    • Competition Benchmarking
    • Market Share Analysis of Top Players
      • By Regional
      • By Product Type
      • By Source
      • By Form
      • By End-Use Application
  19. Competition Analysis
    • Competition Deep Dive
      • Novonesis
        • Overview
        • Product Portfolio
        • Profitability by Market Segments (Product/Form /End-Use Application/Region)
        • Sales Footprint
        • Strategy Overview
        • Amano Enzyme Inc.
        • Codexis, Inc.
        • Merck KGaA
        • Thermo Fisher Scientific
        • Creative Enzymes
        • GenScript Biotech Corporation
        • Takara Bio Inc.
        • Dyadic International, Inc.
        • Biosynth AG
        • Others
    • Assumptions & Acronyms Used
    • Research Methodology

List of Tables

  • Table 1: Global Market Value (USD Million) Forecast by Region, 2020-2035
  • Table 2: Global Market Volume (MT) Forecast by Region, 2020-2035
  • Table 3: Global Market Value (USD Million) Forecast by Product Type, 2020-2035
  • Table 4: Global Market Volume (MT) Forecast by Product Type, 2020-2035
  • Table 5: Global Market Value (USD Million) Forecast by Source, 2020-2035
  • Table 6: Global Market Volume (MT) Forecast by Source, 2020-2035
  • Table 7: Global Market Value (USD Million) Forecast by Form, 2020-2035
  • Table 8: Global Market Volume (MT) Forecast by Form, 2020-2035
  • Table 9: Global Market Value (USD Million) Forecast by End-Use Application, 2020-2035
  • Table 10: Global Market Volume (MT) Forecast by End-Use Application, 2020-2035
  • Table 11: North America Market Value (USD Million) Forecast by Country, 2020-2035
  • Table 12: North America Market Volume (MT) Forecast by Country, 2020-2035
  • Table 13: North America Market Value (USD Million) Forecast by Product Type, 2020-2035
  • Table 14: North America Market Volume (MT) Forecast by Product Type, 2020-2035
  • Table 15: North America Market Value (USD Million) Forecast by Source, 2020-2035
  • Table 16: North America Market Volume (MT) Forecast by Source, 2020-2035
  • Table 17: North America Market Value (USD Million) Forecast by Form, 2020-2035
  • Table 18: North America Market Volume (MT) Forecast by Form, 2020-2035
  • Table 19: North America Market Value (USD Million) Forecast by End-Use Application, 2020-2035
  • Table 20: North America Market Volume (MT) Forecast by End-Use Application, 2020-2035
  • Table 21: Latin America Market Value (USD Million) Forecast by Country, 2020-2035
  • Table 22: Latin America Market Volume (MT) Forecast by Country, 2020-2035
  • Table 23: Latin America Market Value (USD Million) Forecast by Product Type, 2020-2035
  • Table 24: Latin America Market Volume (MT) Forecast by Product Type, 2020-2035
  • Table 25: Latin America Market Value (USD Million) Forecast by Source, 2020-2035
  • Table 26: Latin America Market Volume (MT) Forecast by Source, 2020-2035
  • Table 27: Latin America Market Value (USD Million) Forecast by Form, 2020-2035
  • Table 28: Latin America Market Volume (MT) Forecast by Form, 2020-2035
  • Table 29: Latin America Market Value (USD Million) Forecast by End-Use Application, 2020-2035
  • Table 30: Latin America Market Volume (MT) Forecast by End-Use Application, 2020-2035
  • Table 31: Europe Market Value (USD Million) Forecast by Country, 2020-2035
  • Table 32: Europe Market Volume (MT) Forecast by Country, 2020-2035
  • Table 33: Europe Market Value (USD Million) Forecast by Product Type, 2020-2035
  • Table 34: Europe Market Volume (MT) Forecast by Product Type, 2020-2035
  • Table 35: Europe Market Value (USD Million) Forecast by Source, 2020-2035
  • Table 36: Europe Market Volume (MT) Forecast by Source, 2020-2035
  • Table 37: Europe Market Value (USD Million) Forecast by Form, 2020-2035
  • Table 38: Europe Market Volume (MT) Forecast by Form, 2020-2035
  • Table 39: Europe Market Value (USD Million) Forecast by End-Use Application, 2020-2035
  • Table 40: Europe Market Volume (MT) Forecast by End-Use Application, 2020-2035
  • Table 41: East Asia Market Value (USD Million) Forecast by Country, 2020-2035
  • Table 42: East Asia Market Volume (MT) Forecast by Country, 2020-2035
  • Table 43: East Asia Market Value (USD Million) Forecast by Product Type, 2020-2035
  • Table 44: East Asia Market Volume (MT) Forecast by Product Type, 2020-2035
  • Table 45: East Asia Market Value (USD Million) Forecast by Source, 2020-2035
  • Table 46: East Asia Market Volume (MT) Forecast by Source, 2020-2035
  • Table 47: East Asia Market Value (USD Million) Forecast by Form, 2020-2035
  • Table 48: East Asia Market Volume (MT) Forecast by Form, 2020-2035
  • Table 49: East Asia Market Value (USD Million) Forecast by End-Use Application, 2020-2035
  • Table 50: East Asia Market Volume (MT) Forecast by End-Use Application, 2020-2035
  • Table 51: South Asia & Pacific Market Value (USD Million) Forecast by Country, 2020-2035
  • Table 52: South Asia & Pacific Market Volume (MT) Forecast by Country, 2020-2035
  • Table 53: South Asia & Pacific Market Value (USD Million) Forecast by Product Type, 2020-2035
  • Table 54: South Asia & Pacific Market Volume (MT) Forecast by Product Type, 2020-2035
  • Table 55: South Asia & Pacific Market Value (USD Million) Forecast by Source, 2020-2035
  • Table 56: South Asia & Pacific Market Volume (MT) Forecast by Source, 2020-2035
  • Table 57: South Asia & Pacific Market Value (USD Million) Forecast by Form, 2020-2035
  • Table 58: South Asia & Pacific Market Volume (MT) Forecast by Form, 2020-2035
  • Table 59: South Asia & Pacific Market Value (USD Million) Forecast by End-Use Application, 2020-2035
  • Table 60: South Asia & Pacific Market Volume (MT) Forecast by End-Use Application, 2020-2035
  • Table 61: MEA Market Value (USD Million) Forecast by Country, 2020-2035
  • Table 62: MEA Market Volume (MT) Forecast by Country, 2020-2035
  • Table 63: MEA Market Value (USD Million) Forecast by Product Type, 2020-2035
  • Table 64: MEA Market Volume (MT) Forecast by Product Type, 2020-2035
  • Table 65: MEA Market Value (USD Million) Forecast by Source, 2020-2035
  • Table 66: MEA Market Volume (MT) Forecast by Source, 2020-2035
  • Table 67: MEA Market Value (USD Million) Forecast by Form, 2020-2035
  • Table 68: MEA Market Volume (MT) Forecast by Form, 2020-2035
  • Table 69: MEA Market Value (USD Million) Forecast by End-Use Application, 2020-2035
  • Table 70: MEA Market Volume (MT) Forecast by End-Use Application, 2020-2035

List of Figures

  • Figure 1: Global Market Volume (MT) Forecast 2020-2035
  • Figure 2: Global Market Pricing Analysis
  • Figure 3: Global Market Value (USD Million) Forecast 2020-2035
  • Figure 4: Global Market Value Share and BPS Analysis by Product Type, 2025 and 2035
  • Figure 5: Global Market Y-o-Y Growth Comparison by Product Type, 2025-2035
  • Figure 6: Global Market Attractiveness Analysis by Product Type
  • Figure 7: Global Market Value Share and BPS Analysis by Source, 2025 and 2035
  • Figure 8: Global Market Y-o-Y Growth Comparison by Source, 2025-2035
  • Figure 9: Global Market Attractiveness Analysis by Source
  • Figure 10: Global Market Value Share and BPS Analysis by Form, 2025 and 2035
  • Figure 11: Global Market Y-o-Y Growth Comparison by Form, 2025-2035
  • Figure 12: Global Market Attractiveness Analysis by Form
  • Figure 13: Global Market Value Share and BPS Analysis by End-Use Application, 2025 and 2035
  • Figure 14: Global Market Y-o-Y Growth Comparison by End-Use Application, 2025-2035
  • Figure 15: Global Market Attractiveness Analysis by End-Use Application
  • Figure 16: Global Market Value (USD Million) Share and BPS Analysis by Region, 2025 and 2035
  • Figure 17: Global Market Y-o-Y Growth Comparison by Region, 2025-2035
  • Figure 18: Global Market Attractiveness Analysis by Region
  • Figure 19: North America Market Incremental $ Opportunity, 2025-2035
  • Figure 20: Latin America Market Incremental $ Opportunity, 2025-2035
  • Figure 21: Europe Market Incremental $ Opportunity, 2025-2035
  • Figure 22: East Asia Market Incremental $ Opportunity, 2025-2035
  • Figure 23: South Asia & Pacific Market Incremental $ Opportunity, 2025-2035
  • Figure 24: MEA Market Incremental $ Opportunity, 2025-2035
  • Figure 25: North America Market Value Share and BPS Analysis by Country, 2025 and 2035
  • Figure 26: North America Market Value Share and BPS Analysis by Product Type, 2025 and 2035
  • Figure 27: North America Market Y-o-Y Growth Comparison by Product Type, 2025-2035
  • Figure 28: North America Market Attractiveness Analysis by Product Type
  • Figure 29: North America Market Value Share and BPS Analysis by Source, 2025 and 2035
  • Figure 30: North America Market Y-o-Y Growth Comparison by Source, 2025-2035
  • Figure 31: North America Market Attractiveness Analysis by Source
  • Figure 32: North America Market Value Share and BPS Analysis by Form, 2025 and 2035
  • Figure 33: North America Market Y-o-Y Growth Comparison by Form, 2025-2035
  • Figure 34: North America Market Attractiveness Analysis by Form
  • Figure 35: North America Market Value Share and BPS Analysis by End-Use Application, 2025 and 2035
  • Figure 36: North America Market Y-o-Y Growth Comparison by End-Use Application, 2025-2035
  • Figure 37: North America Market Attractiveness Analysis by End-Use Application
  • Figure 38: Latin America Market Value Share and BPS Analysis by Country, 2025 and 2035
  • Figure 39: Latin America Market Value Share and BPS Analysis by Product Type, 2025 and 2035
  • Figure 40: Latin America Market Y-o-Y Growth Comparison by Product Type, 2025-2035
  • Figure 41: Latin America Market Attractiveness Analysis by Product Type
  • Figure 42: Latin America Market Value Share and BPS Analysis by Source, 2025 and 2035
  • Figure 43: Latin America Market Y-o-Y Growth Comparison by Source, 2025-2035
  • Figure 44: Latin America Market Attractiveness Analysis by Source
  • Figure 45: Latin America Market Value Share and BPS Analysis by Form, 2025 and 2035
  • Figure 46: Latin America Market Y-o-Y Growth Comparison by Form, 2025-2035
  • Figure 47: Latin America Market Attractiveness Analysis by Form
  • Figure 48: Latin America Market Value Share and BPS Analysis by End-Use Application, 2025 and 2035
  • Figure 49: Latin America Market Y-o-Y Growth Comparison by End-Use Application, 2025-2035
  • Figure 50: Latin America Market Attractiveness Analysis by End-Use Application
  • Figure 51: Europe Market Value Share and BPS Analysis by Country, 2025 and 2035
  • Figure 52: Europe Market Value Share and BPS Analysis by Product Type, 2025 and 2035
  • Figure 53: Europe Market Y-o-Y Growth Comparison by Product Type, 2025-2035
  • Figure 54: Europe Market Attractiveness Analysis by Product Type
  • Figure 55: Europe Market Value Share and BPS Analysis by Source, 2025 and 2035
  • Figure 56: Europe Market Y-o-Y Growth Comparison by Source, 2025-2035
  • Figure 57: Europe Market Attractiveness Analysis by Source
  • Figure 58: Europe Market Value Share and BPS Analysis by Form, 2025 and 2035
  • Figure 59: Europe Market Y-o-Y Growth Comparison by Form, 2025-2035
  • Figure 60: Europe Market Attractiveness Analysis by Form
  • Figure 61: Europe Market Value Share and BPS Analysis by End-Use Application, 2025 and 2035
  • Figure 62: Europe Market Y-o-Y Growth Comparison by End-Use Application, 2025-2035
  • Figure 63: Europe Market Attractiveness Analysis by End-Use Application
  • Figure 64: East Asia Market Value Share and BPS Analysis by Country, 2025 and 2035
  • Figure 65: East Asia Market Value Share and BPS Analysis by Product Type, 2025 and 2035
  • Figure 66: East Asia Market Y-o-Y Growth Comparison by Product Type, 2025-2035
  • Figure 67: East Asia Market Attractiveness Analysis by Product Type
  • Figure 68: East Asia Market Value Share and BPS Analysis by Source, 2025 and 2035
  • Figure 69: East Asia Market Y-o-Y Growth Comparison by Source, 2025-2035
  • Figure 70: East Asia Market Attractiveness Analysis by Source
  • Figure 71: East Asia Market Value Share and BPS Analysis by Form, 2025 and 2035
  • Figure 72: East Asia Market Y-o-Y Growth Comparison by Form, 2025-2035
  • Figure 73: East Asia Market Attractiveness Analysis by Form
  • Figure 74: East Asia Market Value Share and BPS Analysis by End-Use Application, 2025 and 2035
  • Figure 75: East Asia Market Y-o-Y Growth Comparison by End-Use Application, 2025-2035
  • Figure 76: East Asia Market Attractiveness Analysis by End-Use Application
  • Figure 77: South Asia & Pacific Market Value Share and BPS Analysis by Country, 2025 and 2035
  • Figure 78: South Asia & Pacific Market Value Share and BPS Analysis by Product Type, 2025 and 2035
  • Figure 79: South Asia & Pacific Market Y-o-Y Growth Comparison by Product Type, 2025-2035
  • Figure 80: South Asia & Pacific Market Attractiveness Analysis by Product Type
  • Figure 81: South Asia & Pacific Market Value Share and BPS Analysis by Source, 2025 and 2035
  • Figure 82: South Asia & Pacific Market Y-o-Y Growth Comparison by Source, 2025-2035
  • Figure 83: South Asia & Pacific Market Attractiveness Analysis by Source
  • Figure 84: South Asia & Pacific Market Value Share and BPS Analysis by Form, 2025 and 2035
  • Figure 85: South Asia & Pacific Market Y-o-Y Growth Comparison by Form, 2025-2035
  • Figure 86: South Asia & Pacific Market Attractiveness Analysis by Form
  • Figure 87: South Asia & Pacific Market Value Share and BPS Analysis by End-Use Application, 2025 and 2035
  • Figure 88: South Asia & Pacific Market Y-o-Y Growth Comparison by End-Use Application, 2025-2035
  • Figure 89: South Asia & Pacific Market Attractiveness Analysis by End-Use Application
  • Figure 90: MEA Market Value Share and BPS Analysis by Country, 2025 and 2035
  • Figure 91: MEA Market Value Share and BPS Analysis by Product Type, 2025 and 2035
  • Figure 92: MEA Market Y-o-Y Growth Comparison by Product Type, 2025-2035
  • Figure 93: MEA Market Attractiveness Analysis by Product Type
  • Figure 94: MEA Market Value Share and BPS Analysis by Source, 2025 and 2035
  • Figure 95: MEA Market Y-o-Y Growth Comparison by Source, 2025-2035
  • Figure 96: MEA Market Attractiveness Analysis by Source
  • Figure 97: MEA Market Value Share and BPS Analysis by Form, 2025 and 2035
  • Figure 98: MEA Market Y-o-Y Growth Comparison by Form, 2025-2035
  • Figure 99: MEA Market Attractiveness Analysis by Form
  • Figure 100: MEA Market Value Share and BPS Analysis by End-Use Application, 2025 and 2035
  • Figure 101: MEA Market Y-o-Y Growth Comparison by End-Use Application, 2025-2035
  • Figure 102: MEA Market Attractiveness Analysis by End-Use Application
  • Figure 103: Global Market - Tier Structure Analysis
  • Figure 104: Global Market - Company Share Analysis

Frequently Asked Questions

How big is the Zymogens Market in 2025?

The global Zymogens is estimated to be valued at USD 432.0 million in 2025.

What will be the size of Zymogens Market in 2035?

The market size for the Zymogens is projected to reach USD 810.9 million by 2035.

How much will be the Zymogens Market growth between 2025 and 2035?

The Zymogens is expected to grow at a 6.5% CAGR between 2025 and 2035.

What are the key product types in the Zymogens Market?

The key product types in the Zymogens Market include protease zymogens, lipase zymogens, amylase zymogens, nuclease zymogens, and other enzyme zymogens.

Which product type segment to contribute significant share in the Zymogens Market in 2025?

In terms of product type, protease zymogens are projected to command the largest share at 46.3% of the Zymogens Market in 2025.

Future Market Insights

Zymogens Market

Chat With

MaRIA

Hi There, I am MaRIA, Your Market Research Intelligence Assistant. How may I help you?