Reports
- Global Locations -
Headquarters
Future Market Insights, Inc.
Christiana Corporate, 200
Continental Drive, Suite 401,
Newark, Delaware - 19713,
United States
Americas
Future Market Insights, Inc.
616 Corporate Way, Suite 2-9018,
Valley Cottage, NY 10989, United States
MEA
Future Market Insights
1602-6 Jumeirah Bay X2 Tower, Plot No: JLT-PH2-X2A,
Jumeirah Lakes Towers, Dubai,
United Arab Emirates
Europe
Future Market Insights
3rd Floor, 207 Regent Street,
W1B 3HH London
United Kingdom
Asia Pacific
Future Market Insights
Office No. 401-A, 4th Floor,
VANTAGE 9, S.No. 36/1/1,
Baner, Pune 411045, India
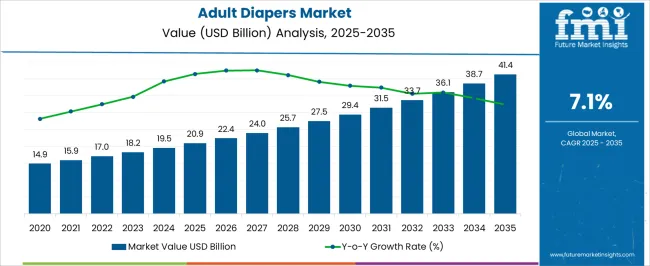
The adult diapers market is estimated to be valued at US$ 18.12 billion in 2023 and is expected to reach a valuation of US$ 37 billion by 2033. The adoption of adult diapers is likely to advance at a CAGR of 7.4% during the forecast period.
Incontinence is the most common problem among older population. According to the global survey on incontinence, around 33 million people in the United States have overactive bladder and nearly 425 million people worldwide have the problem of incontinence. Because of this, the demand for incontinence absorbent products is expected to surge at a robust pace over the forecast period. Besides this, with rising incidence of neurological disorders such as dementia, Alzheimer’s, and others, the demand for adult diapers is increasing.
Future Market Insights predict a comparison and review analysis of the dynamics of the adult diapers market, which is principally subjected to an array of industry factors along with a few definite influences concerning viewpoints that support industry innovation. Some new advances that have taken place in the market include key companies in the adult diapers market collaborating with e-commerce giants to capitalize on this existing trend.
Key reasons for this change in growth rate are attributed to the steady uptake of the market during the first half of the forecast period, owing to the awareness regarding hygiene among the geriatric population to boost the sales of adult diapers and the fast emergence of the e-commerce industry and online channels is creating remunerative growth potential for the market. In 2021, North Shore, the leading brand of high absorbency adult diapers and incontinence supplies announced its expansion in Canada.
Attribute | Details |
---|---|
Estimated Market Size 2023 | US$ 18.12 billion |
Projected Market Size 2033 | US$ 37 billion |
CAGR from 2023 to 2033 | 7.4% |
Don't pay for what you don't need
Customize your report by selecting specific countries or regions and save 30%!
As per Future Market Insights (FMI), the global adult diapers market is projected to witness healthy growth over the forecast period (2023 to 2033). Rising incidence of incontinence in geriatric population is eliminating the social taboo regarding the use of incontinence absorbent products.
Besides, improper disposal of adult diapers is increasing environmental concerns due to the use of harmful chemicals among end users. Hence, availability of biodegradable adult diapers is fuelling the demand in the market. Further, penetration of e-commerce industry and increase preference for digitization is improving the sales of adult diapers through online sales channel. To capitalize on this existing trend, key companies in the adult diapers market are collaborating with e-commerce giants.
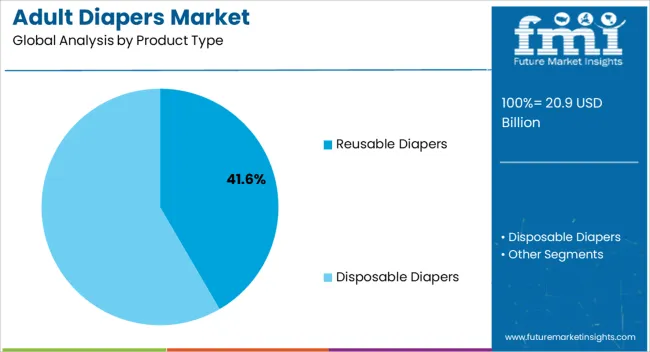
In terms of product type, the disposable diapers segment is expected to dominate the global adult diapers market. As per the study, attributes such as high absorption capacities as compared to reusable diapers will drive the sales in the market.
E-Commerce's Game-Changer for Adult Diapers Market
Fast emergence of e-commerce industry and online channels is creating remunerative growth potential for market players. Availability of different brands and convenience of door delivery at cost-effective prices is pushing the demand for adult diapers.
Key companies are collaborating with e-commerce giants such as Amazon, e-Bay, and others to increase their revenue. This is expected to boost the global adult diapers market over the forecast period.
Empowering Senior Comfort: Rising Hygiene Awareness Drives Adult Diaper Sales
According to Centers for Disease Control and Prevention (CDC), around 61 million adults in the United States live with some sort of disability. Among those, over 13.7% of people have mobility impairment.
People with mobility disability have serious difficulty in walking, climbing stairs, or doing any physical work. Due to the disability and loss of bladder, control increases the risk of skin infection and other diseases.
To limit the risk of skin infection and for better hygiene, need for adult diapers is expected to increase among people with mobility impairment. Further, rising prevalence of incontinence among women is improving the demand for adult diapers.
According to FMI, India is expected to be the most lucrative pocket in South Asia. Growth in the country is attributed to growing incidence of incontinence, especially among women.
Over 48% of people in India have urinary incontinence and around 21.8% are women, according to the survey by National Institute of Health. Besides this, emergence of online platforms and availability of hygiene products on social media platforms and online pharmacies will increase the sales. On the back of these factors, India’s adult diapers market is expected to register a 7% CAGR during the assessment period.
According to FMI, North America is expected to be the largest adult diapers market, accounting for over 33% of overall sales in 2023. Rising incidence of incontinence across the United States is increasing the demand for adult diapers in the market.
An increasing number of people with mobile impairment in the United States coupled with demand for eco-friendly with innovative design and features will fuel the growth in the market. Additionally, presence of leading players in the country and introduction of new style of adult diapers will drive the demand in the market.
FMI estimates, China is expected to dominate the East Asia adult diapers market over the forecast period. Sales of adult diapers are projected to increase at a 7.1% CAGR between 2023 and 2033.
Demand for adult diapers in China is projected to increase on the back of easy availability of these diapers in retail and online stores. Rising older population in China is pushing the sales of adult diapers. According to World Health Organization (WHO), by 2050, the population of older people above the age of 80 will reach 120 million. This is likely to facilitate the growth in the China adult diapers market.
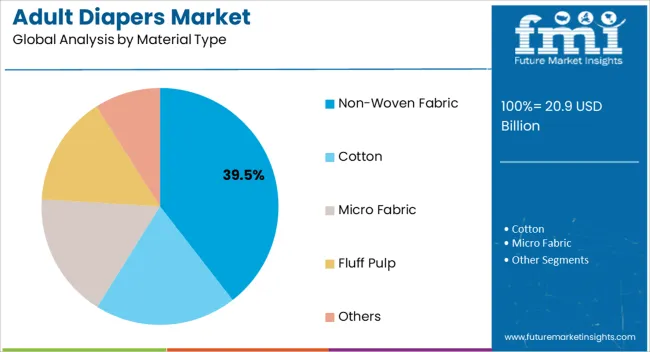
In terms of product type, the disposable adult diapers segment is expected to dominate the global market. Disposable diapers are gaining immense traction as they are made from cotton and non-woven material.
As per FMI, the disposable diaper segment is expected to register highest growth at a 7.7% CAGR between 2023 and 2033. Subsequently, as the cotton material is comparatively softer than other material, the demand for disposable cotton diapers is surging. Because of this, sales of cotton adult diapers are poised to surge at over 7.5% CAGR during the assessment period.
In terms of end user, the female segment is expected to dominate the market over the forecast period. Rising prevalence of incontinence among women is anticipated to fuel the growth in the segment.
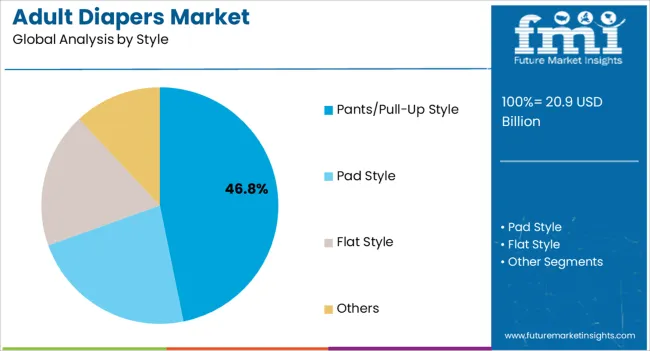
As there is an increasing need for adult diapers among women, the demand for pants/pull-up style diapers is surging. This owes to the comfort and convenience offered by these diapers. They are also available in several sizes and range.
In terms of price range, the mid-range segment is estimated to hold significant share in the market. Growth in the segment is primarily attributed to the growing prevalence of incontinence in developing economies such as India, China, Indonesia, and Brazil.
Emergence of online platforms and penetration of e-commerce industry coupled with availability of adult diapers have increased the demand in the market. As per FMI, the online sales channel is expected to account for significant share during the assessment period.
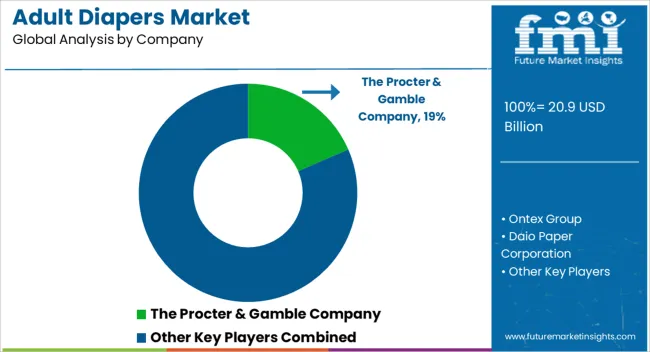
The adult diapers market displays a highly competitive landscape with several key players vying for market share. Leading companies like Kimberly-Clark Corporation, Essity AB, and Procter & Gamble Co. dominate the global market with their established brands and wide product offerings.
These giants continuously invest in research and development to introduce innovative and comfortable products that cater to diverse consumer needs. Regional players, such as DSG International, also compete effectively by focusing on localized marketing and cost-effective solutions. As the aging population increases, the market's growth potential attracts new entrants, fostering a dynamic environment where innovation and quality are paramount to success.
Product Portfolio:
Get the data you need at a Fraction of the cost
Personalize your report by choosing insights you need
and save 40%!
Report Attribute | Details |
---|---|
Market Value in 2023 | US$ 18.12 billion |
Market Value in 2033 | US$ 37 billion |
Growth Rate | CAGR of 7.4% from 2023 to 2033 |
Base Year for Estimation | 2022 |
Historical Data | 2018 to 2022 |
Forecast Period | 2023 to 2033 |
Quantitative Units | Revenue in US$ billion and CAGR from 2023 to 2033 |
Report Coverage | Revenue Forecast, Company Ranking, Competitive Landscape, Growth Factors, Trends and Pricing Analysis |
Segments Covered |
|
Regions Covered |
|
Key Countries Profiled |
|
Key Companies Profiled |
|
Customization& Pricing | Available upon Request |
1. Executive Summary 1.1. Global Market Outlook 1.2. Demand-side Trends 1.3. Supply-side Trends 1.4. Technology Roadmap Analysis 1.5. Analysis and Recommendations 2. Market Overview 2.1. Market Coverage / Taxonomy 2.2. Market Definition / Scope / Limitations 3. Market Background 3.1. Market Dynamics 3.1.1. Drivers 3.1.2. Restraints 3.1.3. Opportunity 3.1.4. Trends 3.2. Scenario Forecast 3.2.1. Demand in Optimistic Scenario 3.2.2. Demand in Likely Scenario 3.2.3. Demand in Conservative Scenario 3.3. Opportunity Map Analysis 3.4. Product Life Cycle Analysis 3.5. Supply Chain Analysis 3.5.1. Supply Side Participants and their Roles 3.5.1.1. Producers 3.5.1.2. Mid-Level Participants (Traders/ Agents/ Brokers) 3.5.1.3. Wholesalers and Distributors 3.5.2. Value Added and Value Created at Node in the Supply Chain 3.5.3. List of Raw Material Suppliers 3.5.4. List of Existing and Potential Buyer’s 3.6. Investment Feasibility Matrix 3.7. Value Chain Analysis 3.7.1. Profit Margin Analysis 3.7.2. Wholesalers and Distributors 3.7.3. Retailers 3.8. PESTLE and Porter’s Analysis 3.9. Regulatory Landscape 3.9.1. By Key Regions 3.9.2. By Key Countries 3.10. Regional Parent Market Outlook 3.11. Production and Consumption Statistics 3.12. Import and Export Statistics 4. Global Market Analysis 2018 to 2022 and Forecast, 2023 to 2033 4.1. Historical Market Size Value (US$ Million) & Volume (Units) Analysis, 2018 to 2022 4.2. Current and Future Market Size Value (US$ Million) & Volume (Units) Projections, 2023 to 2033 4.2.1. Y-o-Y Growth Trend Analysis 4.2.2. Absolute $ Opportunity Analysis 5. Global Market Analysis 2018 to 2022 and Forecast 2023 to 2033, By Product Type 5.1. Introduction / Key Findings 5.2. Historical Market Size Value (US$ Million) & Volume (Units) Analysis By Product Type, 2018 to 2022 5.3. Current and Future Market Size Value (US$ Million) & Volume (Units) Analysis and Forecast By Product Type, 2023 to 2033 5.3.1. Reusable Diapers 5.3.2. Disposable Diapers 5.4. Y-o-Y Growth Trend Analysis By Product Type, 2018 to 2022 5.5. Absolute $ Opportunity Analysis By Product Type, 2023 to 2033 6. Global Market Analysis 2018 to 2022 and Forecast 2023 to 2033, By Style 6.1. Introduction / Key Findings 6.2. Historical Market Size Value (US$ Million) & Volume (Units) Analysis By Style, 2018 to 2022 6.3. Current and Future Market Size Value (US$ Million) & Volume (Units) Analysis and Forecast By Style, 2023 to 2033 6.3.1. Pants/Pull-Up Style 6.3.2. Pad Style 6.3.3. Flat Style 6.3.4. Others 6.4. Y-o-Y Growth Trend Analysis By Style, 2018 to 2022 6.5. Absolute $ Opportunity Analysis By Style, 2023 to 2033 7. Global Market Analysis 2018 to 2022 and Forecast 2023 to 2033, By Material Type 7.1. Introduction / Key Findings 7.2. Historical Market Size Value (US$ Million) & Volume (Units) Analysis By Material Type, 2018 to 2022 7.3. Current and Future Market Size Value (US$ Million) & Volume (Units) Analysis and Forecast By Material Type, 2023 to 2033 7.3.1. Cotton 7.3.2. Non-Woven Fabric 7.3.3. Micro Fabric 7.3.4. Fluff Pulp 7.3.5. Others 7.4. Y-o-Y Growth Trend Analysis By Material Type, 2018 to 2022 7.5. Absolute $ Opportunity Analysis By Material Type, 2023 to 2033 8. Global Market Analysis 2018 to 2022 and Forecast 2023 to 2033, By Size 8.1. Introduction / Key Findings 8.2. Historical Market Size Value (US$ Million) & Volume (Units) Analysis By Size, 2018 to 2022 8.3. Current and Future Market Size Value (US$ Million) & Volume (Units) Analysis and Forecast By Size, 2023 to 2033 8.3.1. Small 8.3.2. Medium 8.3.3. Large 8.3.4. Extra-Large 8.3.5. 2XL 8.4. Y-o-Y Growth Trend Analysis By Size, 2018 to 2022 8.5. Absolute $ Opportunity Analysis By Size, 2023 to 2033 9. Global Market Analysis 2018 to 2022 and Forecast 2023 to 2033, By Price Range 9.1. Introduction / Key Findings 9.2. Historical Market Size Value (US$ Million) & Volume (Units) Analysis By Price Range, 2018 to 2022 9.3. Current and Future Market Size Value (US$ Million) & Volume (Units) Analysis and Forecast By Price Range, 2023 to 2033 9.3.1. Economy 9.3.2. Mid-Range 9.3.3. Premium 9.4. Y-o-Y Growth Trend Analysis By Price Range, 2018 to 2022 9.5. Absolute $ Opportunity Analysis By Price Range, 2023 to 2033 10. Global Market Analysis 2018 to 2022 and Forecast 2023 to 2033, By End User 10.1. Introduction / Key Findings 10.2. Historical Market Size Value (US$ Million) & Volume (Units) Analysis By End User, 2018 to 2022 10.3. Current and Future Market Size Value (US$ Million) & Volume (Units) Analysis and Forecast By End User, 2023 to 2033 10.3.1. Male 10.3.2. Female 10.3.3. Unisex 10.4. Y-o-Y Growth Trend Analysis By End User, 2018 to 2022 10.5. Absolute $ Opportunity Analysis By End User, 2023 to 2033 11. Global Market Analysis 2018 to 2022 and Forecast 2023 to 2033, By Sales Channel 11.1. Introduction / Key Findings 11.2. Historical Market Size Value (US$ Million) & Volume (Units) Analysis By Sales Channel, 2018 to 2022 11.3. Current and Future Market Size Value (US$ Million) & Volume (Units) Analysis and Forecast By Sales Channel, 2023 to 2033 11.3.1. Wholesalers/ Distributors 11.3.2. Supermarkets/Hypermarkets 11.3.3. Pharmacies & Drug Stores 11.3.4. Specialty Outlets 11.3.5. Independent Small Stores 11.3.6. E-Retailers 11.3.7. Other Sales Channel 11.4. Y-o-Y Growth Trend Analysis By Sales Channel, 2018 to 2022 11.5. Absolute $ Opportunity Analysis By Sales Channel, 2023 to 2033 12. Global Market Analysis 2018 to 2022 and Forecast 2023 to 2033, By Region 12.1. Introduction 12.2. Historical Market Size Value (US$ Million) & Volume (Units) Analysis By Region, 2018 to 2022 12.3. Current Market Size Value (US$ Million) & Volume (Units) Analysis and Forecast By Region, 2023 to 2033 12.3.1. North America 12.3.2. Latin America 12.3.3. Western Europe 12.3.4. Eastern Europe 12.3.5. South Asia and Pacific 12.3.6. East Asia 12.3.7. Middle East and Africa 12.4. Market Attractiveness Analysis By Region 13. North America Market Analysis 2018 to 2022 and Forecast 2023 to 2033, By Country 13.1. Historical Market Size Value (US$ Million) & Volume (Units) Trend Analysis By Market Taxonomy, 2018 to 2022 13.2. Market Size Value (US$ Million) & Volume (Units) Forecast By Market Taxonomy, 2023 to 2033 13.2.1. By Country 13.2.1.1. USA 13.2.1.2. Canada 13.2.2. By Product Type 13.2.3. By Style 13.2.4. By Material Type 13.2.5. By Size 13.2.6. By Price Range 13.2.7. By End User 13.2.8. By Sales Channel 13.3. Market Attractiveness Analysis 13.3.1. By Country 13.3.2. By Product Type 13.3.3. By Style 13.3.4. By Material Type 13.3.5. By Size 13.3.6. By Price Range 13.3.7. By End User 13.3.8. By Sales Channel 13.4. Key Takeaways 14. Latin America Market Analysis 2018 to 2022 and Forecast 2023 to 2033, By Country 14.1. Historical Market Size Value (US$ Million) & Volume (Units) Trend Analysis By Market Taxonomy, 2018 to 2022 14.2. Market Size Value (US$ Million) & Volume (Units) Forecast By Market Taxonomy, 2023 to 2033 14.2.1. By Country 14.2.1.1. Brazil 14.2.1.2. Mexico 14.2.1.3. Rest of Latin America 14.2.2. By Product Type 14.2.3. By Style 14.2.4. By Material Type 14.2.5. By Size 14.2.6. By Price Range 14.2.7. By End User 14.2.8. By Sales Channel 14.3. Market Attractiveness Analysis 14.3.1. By Country 14.3.2. By Product Type 14.3.3. By Style 14.3.4. By Material Type 14.3.5. By Size 14.3.6. By Price Range 14.3.7. By End User 14.3.8. By Sales Channel 14.4. Key Takeaways 15. Western Europe Market Analysis 2018 to 2022 and Forecast 2023 to 2033, By Country 15.1. Historical Market Size Value (US$ Million) & Volume (Units) Trend Analysis By Market Taxonomy, 2018 to 2022 15.2. Market Size Value (US$ Million) & Volume (Units) Forecast By Market Taxonomy, 2023 to 2033 15.2.1. By Country 15.2.1.1. Germany 15.2.1.2. UK 15.2.1.3. France 15.2.1.4. Spain 15.2.1.5. Italy 15.2.1.6. Rest of Western Europe 15.2.2. By Product Type 15.2.3. By Style 15.2.4. By Material Type 15.2.5. By Size 15.2.6. By Price Range 15.2.7. By End User 15.2.8. By Sales Channel 15.3. Market Attractiveness Analysis 15.3.1. By Country 15.3.2. By Product Type 15.3.3. By Style 15.3.4. By Material Type 15.3.5. By Size 15.3.6. By Price Range 15.3.7. By End User 15.3.8. By Sales Channel 15.4. Key Takeaways 16. Eastern Europe Market Analysis 2018 to 2022 and Forecast 2023 to 2033, By Country 16.1. Historical Market Size Value (US$ Million) & Volume (Units) Trend Analysis By Market Taxonomy, 2018 to 2022 16.2. Market Size Value (US$ Million) & Volume (Units) Forecast By Market Taxonomy, 2023 to 2033 16.2.1. By Country 16.2.1.1. Poland 16.2.1.2. Russia 16.2.1.3. Czech Republic 16.2.1.4. Romania 16.2.1.5. Rest of Eastern Europe 16.2.2. By Product Type 16.2.3. By Style 16.2.4. By Material Type 16.2.5. By Size 16.2.6. By Price Range 16.2.7. By End User 16.2.8. By Sales Channel 16.3. Market Attractiveness Analysis 16.3.1. By Country 16.3.2. By Product Type 16.3.3. By Style 16.3.4. By Material Type 16.3.5. By Size 16.3.6. By Price Range 16.3.7. By End User 16.3.8. By Sales Channel 16.4. Key Takeaways 17. South Asia and Pacific Market Analysis 2018 to 2022 and Forecast 2023 to 2033, By Country 17.1. Historical Market Size Value (US$ Million) & Volume (Units) Trend Analysis By Market Taxonomy, 2018 to 2022 17.2. Market Size Value (US$ Million) & Volume (Units) Forecast By Market Taxonomy, 2023 to 2033 17.2.1. By Country 17.2.1.1. India 17.2.1.2. Bangladesh 17.2.1.3. Australia 17.2.1.4. New Zealand 17.2.1.5. Rest of South Asia and Pacific 17.2.2. By Product Type 17.2.3. By Style 17.2.4. By Material Type 17.2.5. By Size 17.2.6. By Price Range 17.2.7. By End User 17.2.8. By Sales Channel 17.3. Market Attractiveness Analysis 17.3.1. By Country 17.3.2. By Product Type 17.3.3. By Style 17.3.4. By Material Type 17.3.5. By Size 17.3.6. By Price Range 17.3.7. By End User 17.3.8. By Sales Channel 17.4. Key Takeaways 18. East Asia Market Analysis 2018 to 2022 and Forecast 2023 to 2033, By Country 18.1. Historical Market Size Value (US$ Million) & Volume (Units) Trend Analysis By Market Taxonomy, 2018 to 2022 18.2. Market Size Value (US$ Million) & Volume (Units) Forecast By Market Taxonomy, 2023 to 2033 18.2.1. By Country 18.2.1.1. China 18.2.1.2. Japan 18.2.1.3. South Korea 18.2.2. By Product Type 18.2.3. By Style 18.2.4. By Material Type 18.2.5. By Size 18.2.6. By Price Range 18.2.7. By End User 18.2.8. By Sales Channel 18.3. Market Attractiveness Analysis 18.3.1. By Country 18.3.2. By Product Type 18.3.3. By Style 18.3.4. By Material Type 18.3.5. By Size 18.3.6. By Price Range 18.3.7. By End User 18.3.8. By Sales Channel 18.4. Key Takeaways 19. Middle East and Africa Market Analysis 2018 to 2022 and Forecast 2023 to 2033, By Country 19.1. Historical Market Size Value (US$ Million) & Volume (Units) Trend Analysis By Market Taxonomy, 2018 to 2022 19.2. Market Size Value (US$ Million) & Volume (Units) Forecast By Market Taxonomy, 2023 to 2033 19.2.1. By Country 19.2.1.1. GCC Countries 19.2.1.2. South Africa 19.2.1.3. Israel 19.2.1.4. Rest of MEA 19.2.2. By Product Type 19.2.3. By Style 19.2.4. By Material Type 19.2.5. By Size 19.2.6. By Price Range 19.2.7. By End User 19.2.8. By Sales Channel 19.3. Market Attractiveness Analysis 19.3.1. By Country 19.3.2. By Product Type 19.3.3. By Style 19.3.4. By Material Type 19.3.5. By Size 19.3.6. By Price Range 19.3.7. By End User 19.3.8. By Sales Channel 19.4. Key Takeaways 20. Key Countries Market Analysis 20.1. USA 20.1.1. Pricing Analysis 20.1.2. Market Share Analysis, 2022 20.1.2.1. By Product Type 20.1.2.2. By Style 20.1.2.3. By Material Type 20.1.2.4. By Size 20.1.2.5. By Price Range 20.1.2.6. By End User 20.1.2.7. By Sales Channel 20.2. Canada 20.2.1. Pricing Analysis 20.2.2. Market Share Analysis, 2022 20.2.2.1. By Product Type 20.2.2.2. By Style 20.2.2.3. By Material Type 20.2.2.4. By Size 20.2.2.5. By Price Range 20.2.2.6. By End User 20.2.2.7. By Sales Channel 20.3. Brazil 20.3.1. Pricing Analysis 20.3.2. Market Share Analysis, 2022 20.3.2.1. By Product Type 20.3.2.2. By Style 20.3.2.3. By Material Type 20.3.2.4. By Size 20.3.2.5. By Price Range 20.3.2.6. By End User 20.3.2.7. By Sales Channel 20.4. Mexico 20.4.1. Pricing Analysis 20.4.2. Market Share Analysis, 2022 20.4.2.1. By Product Type 20.4.2.2. By Style 20.4.2.3. By Material Type 20.4.2.4. By Size 20.4.2.5. By Price Range 20.4.2.6. By End User 20.4.2.7. By Sales Channel 20.5. Germany 20.5.1. Pricing Analysis 20.5.2. Market Share Analysis, 2022 20.5.2.1. By Product Type 20.5.2.2. By Style 20.5.2.3. By Material Type 20.5.2.4. By Size 20.5.2.5. By Price Range 20.5.2.6. By End User 20.5.2.7. By Sales Channel 20.6. UK 20.6.1. Pricing Analysis 20.6.2. Market Share Analysis, 2022 20.6.2.1. By Product Type 20.6.2.2. By Style 20.6.2.3. By Material Type 20.6.2.4. By Size 20.6.2.5. By Price Range 20.6.2.6. By End User 20.6.2.7. By Sales Channel 20.7. France 20.7.1. Pricing Analysis 20.7.2. Market Share Analysis, 2022 20.7.2.1. By Product Type 20.7.2.2. By Style 20.7.2.3. By Material Type 20.7.2.4. By Size 20.7.2.5. By Price Range 20.7.2.6. By End User 20.7.2.7. By Sales Channel 20.8. Spain 20.8.1. Pricing Analysis 20.8.2. Market Share Analysis, 2022 20.8.2.1. By Product Type 20.8.2.2. By Style 20.8.2.3. By Material Type 20.8.2.4. By Size 20.8.2.5. By Price Range 20.8.2.6. By End User 20.8.2.7. By Sales Channel 20.9. Italy 20.9.1. Pricing Analysis 20.9.2. Market Share Analysis, 2022 20.9.2.1. By Product Type 20.9.2.2. By Style 20.9.2.3. By Material Type 20.9.2.4. By Size 20.9.2.5. By Price Range 20.9.2.6. By End User 20.9.2.7. By Sales Channel 20.10. Poland 20.10.1. Pricing Analysis 20.10.2. Market Share Analysis, 2022 20.10.2.1. By Product Type 20.10.2.2. By Style 20.10.2.3. By Material Type 20.10.2.4. By Size 20.10.2.5. By Price Range 20.10.2.6. By End User 20.10.2.7. By Sales Channel 20.11. Russia 20.11.1. Pricing Analysis 20.11.2. Market Share Analysis, 2022 20.11.2.1. By Product Type 20.11.2.2. By Style 20.11.2.3. By Material Type 20.11.2.4. By Size 20.11.2.5. By Price Range 20.11.2.6. By End User 20.11.2.7. By Sales Channel 20.12. Czech Republic 20.12.1. Pricing Analysis 20.12.2. Market Share Analysis, 2022 20.12.2.1. By Product Type 20.12.2.2. By Style 20.12.2.3. By Material Type 20.12.2.4. By Size 20.12.2.5. By Price Range 20.12.2.6. By End User 20.12.2.7. By Sales Channel 20.13. Romania 20.13.1. Pricing Analysis 20.13.2. Market Share Analysis, 2022 20.13.2.1. By Product Type 20.13.2.2. By Style 20.13.2.3. By Material Type 20.13.2.4. By Size 20.13.2.5. By Price Range 20.13.2.6. By End User 20.13.2.7. By Sales Channel 20.14. India 20.14.1. Pricing Analysis 20.14.2. Market Share Analysis, 2022 20.14.2.1. By Product Type 20.14.2.2. By Style 20.14.2.3. By Material Type 20.14.2.4. By Size 20.14.2.5. By Price Range 20.14.2.6. By End User 20.14.2.7. By Sales Channel 20.15. Bangladesh 20.15.1. Pricing Analysis 20.15.2. Market Share Analysis, 2022 20.15.2.1. By Product Type 20.15.2.2. By Style 20.15.2.3. By Material Type 20.15.2.4. By Size 20.15.2.5. By Price Range 20.15.2.6. By End User 20.15.2.7. By Sales Channel 20.16. Australia 20.16.1. Pricing Analysis 20.16.2. Market Share Analysis, 2022 20.16.2.1. By Product Type 20.16.2.2. By Style 20.16.2.3. By Material Type 20.16.2.4. By Size 20.16.2.5. By Price Range 20.16.2.6. By End User 20.16.2.7. By Sales Channel 20.17. New Zealand 20.17.1. Pricing Analysis 20.17.2. Market Share Analysis, 2022 20.17.2.1. By Product Type 20.17.2.2. By Style 20.17.2.3. By Material Type 20.17.2.4. By Size 20.17.2.5. By Price Range 20.17.2.6. By End User 20.17.2.7. By Sales Channel 20.18. China 20.18.1. Pricing Analysis 20.18.2. Market Share Analysis, 2022 20.18.2.1. By Product Type 20.18.2.2. By Style 20.18.2.3. By Material Type 20.18.2.4. By Size 20.18.2.5. By Price Range 20.18.2.6. By End User 20.18.2.7. By Sales Channel 20.19. Japan 20.19.1. Pricing Analysis 20.19.2. Market Share Analysis, 2022 20.19.2.1. By Product Type 20.19.2.2. By Style 20.19.2.3. By Material Type 20.19.2.4. By Size 20.19.2.5. By Price Range 20.19.2.6. By End User 20.19.2.7. By Sales Channel 20.20. South Korea 20.20.1. Pricing Analysis 20.20.2. Market Share Analysis, 2022 20.20.2.1. By Product Type 20.20.2.2. By Style 20.20.2.3. By Material Type 20.20.2.4. By Size 20.20.2.5. By Price Range 20.20.2.6. By End User 20.20.2.7. By Sales Channel 20.21. GCC Countries 20.21.1. Pricing Analysis 20.21.2. Market Share Analysis, 2022 20.21.2.1. By Product Type 20.21.2.2. By Style 20.21.2.3. By Material Type 20.21.2.4. By Size 20.21.2.5. By Price Range 20.21.2.6. By End User 20.21.2.7. By Sales Channel 20.22. South Africa 20.22.1. Pricing Analysis 20.22.2. Market Share Analysis, 2022 20.22.2.1. By Product Type 20.22.2.2. By Style 20.22.2.3. By Material Type 20.22.2.4. By Size 20.22.2.5. By Price Range 20.22.2.6. By End User 20.22.2.7. By Sales Channel 20.23. Israel 20.23.1. Pricing Analysis 20.23.2. Market Share Analysis, 2022 20.23.2.1. By Product Type 20.23.2.2. By Style 20.23.2.3. By Material Type 20.23.2.4. By Size 20.23.2.5. By Price Range 20.23.2.6. By End User 20.23.2.7. By Sales Channel 21. Market Structure Analysis 21.1. Competition Dashboard 21.2. Competition Benchmarking 21.3. Market Share Analysis of Top Players 21.3.1. By Regional 21.3.2. By Product Type 21.3.3. By Style 21.3.4. By Material Type 21.3.5. By Size 21.3.6. By Price Range 21.3.7. By End User 21.3.8. By Sales Channel 22. Competition Analysis 22.1. Competition Deep Dive 22.1.1. The Procter & Gamble Company 22.1.1.1. Overview 22.1.1.2. Product Portfolio 22.1.1.3. Profitability by Market Segments 22.1.1.4. Sales Footprint 22.1.1.5. Strategy Overview 22.1.1.5.1. Marketing Strategy 22.1.1.5.2. Product Strategy 22.1.1.5.3. Channel Strategy 22.1.2. Ontex Group 22.1.2.1. Overview 22.1.2.2. Product Portfolio 22.1.2.3. Profitability by Market Segments 22.1.2.4. Sales Footprint 22.1.2.5. Strategy Overview 22.1.2.5.1. Marketing Strategy 22.1.2.5.2. Product Strategy 22.1.2.5.3. Channel Strategy 22.1.3. Daio Paper Corporation 22.1.3.1. Overview 22.1.3.2. Product Portfolio 22.1.3.3. Profitability by Market Segments 22.1.3.4. Sales Footprint 22.1.3.5. Strategy Overview 22.1.3.5.1. Marketing Strategy 22.1.3.5.2. Product Strategy 22.1.3.5.3. Channel Strategy 22.1.4. Unicharm Corporation 22.1.4.1. Overview 22.1.4.2. Product Portfolio 22.1.4.3. Profitability by Market Segments 22.1.4.4. Sales Footprint 22.1.4.5. Strategy Overview 22.1.4.5.1. Marketing Strategy 22.1.4.5.2. Product Strategy 22.1.4.5.3. Channel Strategy 22.1.5. Kimberly-Clark Corporation 22.1.5.1. Overview 22.1.5.2. Product Portfolio 22.1.5.3. Profitability by Market Segments 22.1.5.4. Sales Footprint 22.1.5.5. Strategy Overview 22.1.5.5.1. Marketing Strategy 22.1.5.5.2. Product Strategy 22.1.5.5.3. Channel Strategy 22.1.6. Medline Industries Inc. 22.1.6.1. Overview 22.1.6.2. Product Portfolio 22.1.6.3. Profitability by Market Segments 22.1.6.4. Sales Footprint 22.1.6.5. Strategy Overview 22.1.6.5.1. Marketing Strategy 22.1.6.5.2. Product Strategy 22.1.6.5.3. Channel Strategy 22.1.7. Hengan International Group Co. Limited 22.1.7.1. Overview 22.1.7.2. Product Portfolio 22.1.7.3. Profitability by Market Segments 22.1.7.4. Sales Footprint 22.1.7.5. Strategy Overview 22.1.7.5.1. Marketing Strategy 22.1.7.5.2. Product Strategy 22.1.7.5.3. Channel Strategy 22.1.8. First Quality Enterprises Inc. 22.1.8.1. Overview 22.1.8.2. Product Portfolio 22.1.8.3. Profitability by Market Segments 22.1.8.4. Sales Footprint 22.1.8.5. Strategy Overview 22.1.8.5.1. Marketing Strategy 22.1.8.5.2. Product Strategy 22.1.8.5.3. Channel Strategy 22.1.9. Nippon Paper Industries Co. Ltd. 22.1.9.1. Overview 22.1.9.2. Product Portfolio 22.1.9.3. Profitability by Market Segments 22.1.9.4. Sales Footprint 22.1.9.5. Strategy Overview 22.1.9.5.1. Marketing Strategy 22.1.9.5.2. Product Strategy 22.1.9.5.3. Channel Strategy 22.1.10. Essity AB 22.1.10.1. Overview 22.1.10.2. Product Portfolio 22.1.10.3. Profitability by Market Segments 22.1.10.4. Sales Footprint 22.1.10.5. Strategy Overview 22.1.10.5.1. Marketing Strategy 22.1.10.5.2. Product Strategy 22.1.10.5.3. Channel Strategy 23. Assumptions & Acronyms Used 24. Research Methodology
Don't pay for what you don't need
Customize your report by selecting specific countries or regions and save 30%!
Table 01: Global Market Value (US$ Million) Forecast by Region, 2018 to 2033 Table 02: Global Market Volume (Units) Forecast by Region, 2018 to 2033 Table 03: Global Market Value (US$ Million) Forecast by Product Type, 2018 to 2033 Table 04: Global Market Volume (Units) Forecast by Product Type, 2018 to 2033 Table 05: Global Market Value (US$ Million) Forecast by Style, 2018 to 2033 Table 06: Global Market Volume (Units) Forecast by Style, 2018 to 2033 Table 07: Global Market Value (US$ Million) Forecast by Material Type, 2018 to 2033 Table 08: Global Market Volume (Units) Forecast by Material Type, 2018 to 2033 Table 09: Global Market Value (US$ Million) Forecast by Size, 2018 to 2033 Table 10: Global Market Volume (Units) Forecast by Size, 2018 to 2033 Table 11: Global Market Value (US$ Million) Forecast by Price Range, 2018 to 2033 Table 12: Global Market Volume (Units) Forecast by Price Range, 2018 to 2033 Table 13: Global Market Value (US$ Million) Forecast by End User, 2018 to 2033 Table 14: Global Market Volume (Units) Forecast by End User, 2018 to 2033 Table 15: Global Market Value (US$ Million) Forecast by Sales Channel, 2018 to 2033 Table 16: Global Market Volume (Units) Forecast by Sales Channel, 2018 to 2033 Table 17: North America Market Value (US$ Million) Forecast by Country, 2018 to 2033 Table 18: North America Market Volume (Units) Forecast by Country, 2018 to 2033 Table 19: North America Market Value (US$ Million) Forecast by Product Type, 2018 to 2033 Table 20: North America Market Volume (Units) Forecast by Product Type, 2018 to 2033 Table 21: North America Market Value (US$ Million) Forecast by Style, 2018 to 2033 Table 22: North America Market Volume (Units) Forecast by Style, 2018 to 2033 Table 23: North America Market Value (US$ Million) Forecast by Material Type, 2018 to 2033 Table 24: North America Market Volume (Units) Forecast by Material Type, 2018 to 2033 Table 25: North America Market Value (US$ Million) Forecast by Size, 2018 to 2033 Table 26: North America Market Volume (Units) Forecast by Size, 2018 to 2033 Table 27: North America Market Value (US$ Million) Forecast by Price Range, 2018 to 2033 Table 28: North America Market Volume (Units) Forecast by Price Range, 2018 to 2033 Table 29: North America Market Value (US$ Million) Forecast by End User, 2018 to 2033 Table 30: North America Market Volume (Units) Forecast by End User, 2018 to 2033 Table 31: North America Market Value (US$ Million) Forecast by Sales Channel, 2018 to 2033 Table 32: North America Market Volume (Units) Forecast by Sales Channel, 2018 to 2033 Table 33: Latin America Market Value (US$ Million) Forecast by Country, 2018 to 2033 Table 34: Latin America Market Volume (Units) Forecast by Country, 2018 to 2033 Table 35: Latin America Market Value (US$ Million) Forecast by Product Type, 2018 to 2033 Table 36: Latin America Market Volume (Units) Forecast by Product Type, 2018 to 2033 Table 37: Latin America Market Value (US$ Million) Forecast by Style, 2018 to 2033 Table 38: Latin America Market Volume (Units) Forecast by Style, 2018 to 2033 Table 39: Latin America Market Value (US$ Million) Forecast by Material Type, 2018 to 2033 Table 40: Latin America Market Volume (Units) Forecast by Material Type, 2018 to 2033 Table 41: Latin America Market Value (US$ Million) Forecast by Size, 2018 to 2033 Table 42: Latin America Market Volume (Units) Forecast by Size, 2018 to 2033 Table 43: Latin America Market Value (US$ Million) Forecast by Price Range, 2018 to 2033 Table 44: Latin America Market Volume (Units) Forecast by Price Range, 2018 to 2033 Table 45: Latin America Market Value (US$ Million) Forecast by End User, 2018 to 2033 Table 46: Latin America Market Volume (Units) Forecast by End User, 2018 to 2033 Table 47: Latin America Market Value (US$ Million) Forecast by Sales Channel, 2018 to 2033 Table 48: Latin America Market Volume (Units) Forecast by Sales Channel, 2018 to 2033 Table 49: Western Europe Market Value (US$ Million) Forecast by Country, 2018 to 2033 Table 50: Western Europe Market Volume (Units) Forecast by Country, 2018 to 2033 Table 51: Western Europe Market Value (US$ Million) Forecast by Product Type, 2018 to 2033 Table 52: Western Europe Market Volume (Units) Forecast by Product Type, 2018 to 2033 Table 53: Western Europe Market Value (US$ Million) Forecast by Style, 2018 to 2033 Table 54: Western Europe Market Volume (Units) Forecast by Style, 2018 to 2033 Table 55: Western Europe Market Value (US$ Million) Forecast by Material Type, 2018 to 2033 Table 56: Western Europe Market Volume (Units) Forecast by Material Type, 2018 to 2033 Table 57: Western Europe Market Value (US$ Million) Forecast by Size, 2018 to 2033 Table 58: Western Europe Market Volume (Units) Forecast by Size, 2018 to 2033 Table 59: Western Europe Market Value (US$ Million) Forecast by Price Range, 2018 to 2033 Table 60: Western Europe Market Volume (Units) Forecast by Price Range, 2018 to 2033 Table 61: Western Europe Market Value (US$ Million) Forecast by End User, 2018 to 2033 Table 62: Western Europe Market Volume (Units) Forecast by End User, 2018 to 2033 Table 63: Western Europe Market Value (US$ Million) Forecast by Sales Channel, 2018 to 2033 Table 64: Western Europe Market Volume (Units) Forecast by Sales Channel, 2018 to 2033 Table 65: Eastern Europe Market Value (US$ Million) Forecast by Country, 2018 to 2033 Table 66: Eastern Europe Market Volume (Units) Forecast by Country, 2018 to 2033 Table 67: Eastern Europe Market Value (US$ Million) Forecast by Product Type, 2018 to 2033 Table 68: Eastern Europe Market Volume (Units) Forecast by Product Type, 2018 to 2033 Table 69: Eastern Europe Market Value (US$ Million) Forecast by Style, 2018 to 2033 Table 70: Eastern Europe Market Volume (Units) Forecast by Style, 2018 to 2033 Table 71: Eastern Europe Market Value (US$ Million) Forecast by Material Type, 2018 to 2033 Table 72: Eastern Europe Market Volume (Units) Forecast by Material Type, 2018 to 2033 Table 73: Eastern Europe Market Value (US$ Million) Forecast by Size, 2018 to 2033 Table 74: Eastern Europe Market Volume (Units) Forecast by Size, 2018 to 2033 Table 75: Eastern Europe Market Value (US$ Million) Forecast by Price Range, 2018 to 2033 Table 76: Eastern Europe Market Volume (Units) Forecast by Price Range, 2018 to 2033 Table 77: Eastern Europe Market Value (US$ Million) Forecast by End User, 2018 to 2033 Table 78: Eastern Europe Market Volume (Units) Forecast by End User, 2018 to 2033 Table 79: Eastern Europe Market Value (US$ Million) Forecast by Sales Channel, 2018 to 2033 Table 80: Eastern Europe Market Volume (Units) Forecast by Sales Channel, 2018 to 2033 Table 81: South Asia and Pacific Market Value (US$ Million) Forecast by Country, 2018 to 2033 Table 82: South Asia and Pacific Market Volume (Units) Forecast by Country, 2018 to 2033 Table 83: South Asia and Pacific Market Value (US$ Million) Forecast by Product Type, 2018 to 2033 Table 84: South Asia and Pacific Market Volume (Units) Forecast by Product Type, 2018 to 2033 Table 85: South Asia and Pacific Market Value (US$ Million) Forecast by Style, 2018 to 2033 Table 86: South Asia and Pacific Market Volume (Units) Forecast by Style, 2018 to 2033 Table 87: South Asia and Pacific Market Value (US$ Million) Forecast by Material Type, 2018 to 2033 Table 88: South Asia and Pacific Market Volume (Units) Forecast by Material Type, 2018 to 2033 Table 89: South Asia and Pacific Market Value (US$ Million) Forecast by Size, 2018 to 2033 Table 90: South Asia and Pacific Market Volume (Units) Forecast by Size, 2018 to 2033 Table 91: South Asia and Pacific Market Value (US$ Million) Forecast by Price Range, 2018 to 2033 Table 92: South Asia and Pacific Market Volume (Units) Forecast by Price Range, 2018 to 2033 Table 93: South Asia and Pacific Market Value (US$ Million) Forecast by End User, 2018 to 2033 Table 94: South Asia and Pacific Market Volume (Units) Forecast by End User, 2018 to 2033 Table 95: South Asia and Pacific Market Value (US$ Million) Forecast by Sales Channel, 2018 to 2033 Table 96: South Asia and Pacific Market Volume (Units) Forecast by Sales Channel, 2018 to 2033 Table 97: East Asia Market Value (US$ Million) Forecast by Country, 2018 to 2033 Table 98: East Asia Market Volume (Units) Forecast by Country, 2018 to 2033 Table 99: East Asia Market Value (US$ Million) Forecast by Product Type, 2018 to 2033 Table 100: East Asia Market Volume (Units) Forecast by Product Type, 2018 to 2033 Table 101: East Asia Market Value (US$ Million) Forecast by Style, 2018 to 2033 Table 102: East Asia Market Volume (Units) Forecast by Style, 2018 to 2033 Table 103: East Asia Market Value (US$ Million) Forecast by Material Type, 2018 to 2033 Table 104: East Asia Market Volume (Units) Forecast by Material Type, 2018 to 2033 Table 105: East Asia Market Value (US$ Million) Forecast by Size, 2018 to 2033 Table 106: East Asia Market Volume (Units) Forecast by Size, 2018 to 2033 Table 107: East Asia Market Value (US$ Million) Forecast by Price Range, 2018 to 2033 Table 108: East Asia Market Volume (Units) Forecast by Price Range, 2018 to 2033 Table 109: East Asia Market Value (US$ Million) Forecast by End User, 2018 to 2033 Table 110: East Asia Market Volume (Units) Forecast by End User, 2018 to 2033 Table 111: East Asia Market Value (US$ Million) Forecast by Sales Channel, 2018 to 2033 Table 112: East Asia Market Volume (Units) Forecast by Sales Channel, 2018 to 2033 Table 113: Middle East and Africa Market Value (US$ Million) Forecast by Country, 2018 to 2033 Table 114: Middle East and Africa Market Volume (Units) Forecast by Country, 2018 to 2033 Table 115: Middle East and Africa Market Value (US$ Million) Forecast by Product Type, 2018 to 2033 Table 116: Middle East and Africa Market Volume (Units) Forecast by Product Type, 2018 to 2033 Table 117: Middle East and Africa Market Value (US$ Million) Forecast by Style, 2018 to 2033 Table 118: Middle East and Africa Market Volume (Units) Forecast by Style, 2018 to 2033 Table 119: Middle East and Africa Market Value (US$ Million) Forecast by Material Type, 2018 to 2033 Table 120: Middle East and Africa Market Volume (Units) Forecast by Material Type, 2018 to 2033 Table 121: Middle East and Africa Market Value (US$ Million) Forecast by Size, 2018 to 2033 Table 122: Middle East and Africa Market Volume (Units) Forecast by Size, 2018 to 2033 Table 123: Middle East and Africa Market Value (US$ Million) Forecast by Price Range, 2018 to 2033 Table 124: Middle East and Africa Market Volume (Units) Forecast by Price Range, 2018 to 2033 Table 125: Middle East and Africa Market Value (US$ Million) Forecast by End User, 2018 to 2033 Table 126: Middle East and Africa Market Volume (Units) Forecast by End User, 2018 to 2033 Table 127: Middle East and Africa Market Value (US$ Million) Forecast by Sales Channel, 2018 to 2033 Table 128: Middle East and Africa Market Volume (Units) Forecast by Sales Channel, 2018 to 2033
Figure 01: Global Market Value (US$ Million) by Product Type, 2023 to 2033 Figure 02: Global Market Value (US$ Million) by Style, 2023 to 2033 Figure 03: Global Market Value (US$ Million) by Material Type, 2023 to 2033 Figure 04: Global Market Value (US$ Million) by Size, 2023 to 2033 Figure 05: Global Market Value (US$ Million) by Price Range, 2023 to 2033 Figure 06: Global Market Value (US$ Million) by End User, 2023 to 2033 Figure 07: Global Market Value (US$ Million) by Sales Channel, 2023 to 2033 Figure 08: Global Market Value (US$ Million) by Region, 2023 to 2033 Figure 09: Global Market Value (US$ Million) Analysis by Region, 2018 to 2033 Figure 10: Global Market Volume (Units) Analysis by Region, 2018 to 2033 Figure 11: Global Market Value Share (%) and BPS Analysis by Region, 2023 to 2033 Figure 12: Global Market Y-o-Y Growth (%) Projections by Region, 2023 to 2033 Figure 13: Global Market Value (US$ Million) Analysis by Product Type, 2018 to 2033 Figure 14: Global Market Volume (Units) Analysis by Product Type, 2018 to 2033 Figure 15: Global Market Value Share (%) and BPS Analysis by Product Type, 2023 to 2033 Figure 16: Global Market Y-o-Y Growth (%) Projections by Product Type, 2023 to 2033 Figure 17: Global Market Value (US$ Million) Analysis by Style, 2018 to 2033 Figure 18: Global Market Volume (Units) Analysis by Style, 2018 to 2033 Figure 19: Global Market Value Share (%) and BPS Analysis by Style, 2023 to 2033 Figure 20: Global Market Y-o-Y Growth (%) Projections by Style, 2023 to 2033 Figure 21: Global Market Value (US$ Million) Analysis by Material Type, 2018 to 2033 Figure 22: Global Market Volume (Units) Analysis by Material Type, 2018 to 2033 Figure 23: Global Market Value Share (%) and BPS Analysis by Material Type, 2023 to 2033 Figure 24: Global Market Y-o-Y Growth (%) Projections by Material Type, 2023 to 2033 Figure 25: Global Market Value (US$ Million) Analysis by Size, 2018 to 2033 Figure 26: Global Market Volume (Units) Analysis by Size, 2018 to 2033 Figure 27: Global Market Value Share (%) and BPS Analysis by Size, 2023 to 2033 Figure 28: Global Market Y-o-Y Growth (%) Projections by Size, 2023 to 2033 Figure 29: Global Market Value (US$ Million) Analysis by Price Range, 2018 to 2033 Figure 30: Global Market Volume (Units) Analysis by Price Range, 2018 to 2033 Figure 31: Global Market Value Share (%) and BPS Analysis by Price Range, 2023 to 2033 Figure 32: Global Market Y-o-Y Growth (%) Projections by Price Range, 2023 to 2033 Figure 33: Global Market Value (US$ Million) Analysis by End User, 2018 to 2033 Figure 34: Global Market Volume (Units) Analysis by End User, 2018 to 2033 Figure 35: Global Market Value Share (%) and BPS Analysis by End User, 2023 to 2033 Figure 36: Global Market Y-o-Y Growth (%) Projections by End User, 2023 to 2033 Figure 37: Global Market Value (US$ Million) Analysis by Sales Channel, 2018 to 2033 Figure 38: Global Market Volume (Units) Analysis by Sales Channel, 2018 to 2033 Figure 39: Global Market Value Share (%) and BPS Analysis by Sales Channel, 2023 to 2033 Figure 40: Global Market Y-o-Y Growth (%) Projections by Sales Channel, 2023 to 2033 Figure 41: Global Market Attractiveness by Product Type, 2023 to 2033 Figure 42: Global Market Attractiveness by Style, 2023 to 2033 Figure 43: Global Market Attractiveness by Material Type, 2023 to 2033 Figure 44: Global Market Attractiveness by Size, 2023 to 2033 Figure 45: Global Market Attractiveness by Price Range, 2023 to 2033 Figure 46: Global Market Attractiveness by End User, 2023 to 2033 Figure 47: Global Market Attractiveness by Sales Channel, 2023 to 2033 Figure 48: Global Market Attractiveness by Region, 2023 to 2033 Figure 49: North America Market Value (US$ Million) by Product Type, 2023 to 2033 Figure 50: North America Market Value (US$ Million) by Style, 2023 to 2033 Figure 51: North America Market Value (US$ Million) by Material Type, 2023 to 2033 Figure 52: North America Market Value (US$ Million) by Size, 2023 to 2033 Figure 53: North America Market Value (US$ Million) by Price Range, 2023 to 2033 Figure 54: North America Market Value (US$ Million) by End User, 2023 to 2033 Figure 55: North America Market Value (US$ Million) by Sales Channel, 2023 to 2033 Figure 56: North America Market Value (US$ Million) by Country, 2023 to 2033 Figure 57: North America Market Value (US$ Million) Analysis by Country, 2018 to 2033 Figure 58: North America Market Volume (Units) Analysis by Country, 2018 to 2033 Figure 59: North America Market Value Share (%) and BPS Analysis by Country, 2023 to 2033 Figure 60: North America Market Y-o-Y Growth (%) Projections by Country, 2023 to 2033 Figure 61: North America Market Value (US$ Million) Analysis by Product Type, 2018 to 2033 Figure 62: North America Market Volume (Units) Analysis by Product Type, 2018 to 2033 Figure 63: North America Market Value Share (%) and BPS Analysis by Product Type, 2023 to 2033 Figure 64: North America Market Y-o-Y Growth (%) Projections by Product Type, 2023 to 2033 Figure 65: North America Market Value (US$ Million) Analysis by Style, 2018 to 2033 Figure 66: North America Market Volume (Units) Analysis by Style, 2018 to 2033 Figure 67: North America Market Value Share (%) and BPS Analysis by Style, 2023 to 2033 Figure 68: North America Market Y-o-Y Growth (%) Projections by Style, 2023 to 2033 Figure 69: North America Market Value (US$ Million) Analysis by Material Type, 2018 to 2033 Figure 70: North America Market Volume (Units) Analysis by Material Type, 2018 to 2033 Figure 71: North America Market Value Share (%) and BPS Analysis by Material Type, 2023 to 2033 Figure 72: North America Market Y-o-Y Growth (%) Projections by Material Type, 2023 to 2033 Figure 73: North America Market Value (US$ Million) Analysis by Size, 2018 to 2033 Figure 74: North America Market Volume (Units) Analysis by Size, 2018 to 2033 Figure 75: North America Market Value Share (%) and BPS Analysis by Size, 2023 to 2033 Figure 76: North America Market Y-o-Y Growth (%) Projections by Size, 2023 to 2033 Figure 77: North America Market Value (US$ Million) Analysis by Price Range, 2018 to 2033 Figure 78: North America Market Volume (Units) Analysis by Price Range, 2018 to 2033 Figure 79: North America Market Value Share (%) and BPS Analysis by Price Range, 2023 to 2033 Figure 80: North America Market Y-o-Y Growth (%) Projections by Price Range, 2023 to 2033 Figure 81: North America Market Value (US$ Million) Analysis by End User, 2018 to 2033 Figure 82: North America Market Volume (Units) Analysis by End User, 2018 to 2033 Figure 83: North America Market Value Share (%) and BPS Analysis by End User, 2023 to 2033 Figure 84: North America Market Y-o-Y Growth (%) Projections by End User, 2023 to 2033 Figure 85: North America Market Value (US$ Million) Analysis by Sales Channel, 2018 to 2033 Figure 86: North America Market Volume (Units) Analysis by Sales Channel, 2018 to 2033 Figure 87: North America Market Value Share (%) and BPS Analysis by Sales Channel, 2023 to 2033 Figure 88: North America Market Y-o-Y Growth (%) Projections by Sales Channel, 2023 to 2033 Figure 89: North America Market Attractiveness by Product Type, 2023 to 2033 Figure 90: North America Market Attractiveness by Style, 2023 to 2033 Figure 91: North America Market Attractiveness by Material Type, 2023 to 2033 Figure 92: North America Market Attractiveness by Size, 2023 to 2033 Figure 93: North America Market Attractiveness by Price Range, 2023 to 2033 Figure 94: North America Market Attractiveness by End User, 2023 to 2033 Figure 95: North America Market Attractiveness by Sales Channel, 2023 to 2033 Figure 96: North America Market Attractiveness by Country, 2023 to 2033 Figure 97: Latin America Market Value (US$ Million) by Product Type, 2023 to 2033 Figure 98: Latin America Market Value (US$ Million) by Style, 2023 to 2033 Figure 99: Latin America Market Value (US$ Million) by Material Type, 2023 to 2033 Figure 100: Latin America Market Value (US$ Million) by Size, 2023 to 2033 Figure 101: Latin America Market Value (US$ Million) by Price Range, 2023 to 2033 Figure 102: Latin America Market Value (US$ Million) by End User, 2023 to 2033 Figure 103: Latin America Market Value (US$ Million) by Sales Channel, 2023 to 2033 Figure 104: Latin America Market Value (US$ Million) by Country, 2023 to 2033 Figure 105: Latin America Market Value (US$ Million) Analysis by Country, 2018 to 2033 Figure 106: Latin America Market Volume (Units) Analysis by Country, 2018 to 2033 Figure 107: Latin America Market Value Share (%) and BPS Analysis by Country, 2023 to 2033 Figure 108: Latin America Market Y-o-Y Growth (%) Projections by Country, 2023 to 2033 Figure 109: Latin America Market Value (US$ Million) Analysis by Product Type, 2018 to 2033 Figure 110: Latin America Market Volume (Units) Analysis by Product Type, 2018 to 2033 Figure 111: Latin America Market Value Share (%) and BPS Analysis by Product Type, 2023 to 2033 Figure 112: Latin America Market Y-o-Y Growth (%) Projections by Product Type, 2023 to 2033 Figure 113: Latin America Market Value (US$ Million) Analysis by Style, 2018 to 2033 Figure 114: Latin America Market Volume (Units) Analysis by Style, 2018 to 2033 Figure 115: Latin America Market Value Share (%) and BPS Analysis by Style, 2023 to 2033 Figure 116: Latin America Market Y-o-Y Growth (%) Projections by Style, 2023 to 2033 Figure 117: Latin America Market Value (US$ Million) Analysis by Material Type, 2018 to 2033 Figure 118: Latin America Market Volume (Units) Analysis by Material Type, 2018 to 2033 Figure 119: Latin America Market Value Share (%) and BPS Analysis by Material Type, 2023 to 2033 Figure 120: Latin America Market Y-o-Y Growth (%) Projections by Material Type, 2023 to 2033 Figure 121: Latin America Market Value (US$ Million) Analysis by Size, 2018 to 2033 Figure 122: Latin America Market Volume (Units) Analysis by Size, 2018 to 2033 Figure 123: Latin America Market Value Share (%) and BPS Analysis by Size, 2023 to 2033 Figure 124: Latin America Market Y-o-Y Growth (%) Projections by Size, 2023 to 2033 Figure 125: Latin America Market Value (US$ Million) Analysis by Price Range, 2018 to 2033 Figure 126: Latin America Market Volume (Units) Analysis by Price Range, 2018 to 2033 Figure 127: Latin America Market Value Share (%) and BPS Analysis by Price Range, 2023 to 2033 Figure 128: Latin America Market Y-o-Y Growth (%) Projections by Price Range, 2023 to 2033 Figure 129: Latin America Market Value (US$ Million) Analysis by End User, 2018 to 2033 Figure 130: Latin America Market Volume (Units) Analysis by End User, 2018 to 2033 Figure 131: Latin America Market Value Share (%) and BPS Analysis by End User, 2023 to 2033 Figure 132: Latin America Market Y-o-Y Growth (%) Projections by End User, 2023 to 2033 Figure 133: Latin America Market Value (US$ Million) Analysis by Sales Channel, 2018 to 2033 Figure 134: Latin America Market Volume (Units) Analysis by Sales Channel, 2018 to 2033 Figure 135: Latin America Market Value Share (%) and BPS Analysis by Sales Channel, 2023 to 2033 Figure 136: Latin America Market Y-o-Y Growth (%) Projections by Sales Channel, 2023 to 2033 Figure 137: Latin America Market Attractiveness by Product Type, 2023 to 2033 Figure 138: Latin America Market Attractiveness by Style, 2023 to 2033 Figure 139: Latin America Market Attractiveness by Material Type, 2023 to 2033 Figure 140: Latin America Market Attractiveness by Size, 2023 to 2033 Figure 141: Latin America Market Attractiveness by Price Range, 2023 to 2033 Figure 142: Latin America Market Attractiveness by End User, 2023 to 2033 Figure 143: Latin America Market Attractiveness by Sales Channel, 2023 to 2033 Figure 144: Latin America Market Attractiveness by Country, 2023 to 2033 Figure 145: Western Europe Market Value (US$ Million) by Product Type, 2023 to 2033 Figure 146: Western Europe Market Value (US$ Million) by Style, 2023 to 2033 Figure 147: Western Europe Market Value (US$ Million) by Material Type, 2023 to 2033 Figure 148: Western Europe Market Value (US$ Million) by Size, 2023 to 2033 Figure 149: Western Europe Market Value (US$ Million) by Price Range, 2023 to 2033 Figure 150: Western Europe Market Value (US$ Million) by End User, 2023 to 2033 Figure 151: Western Europe Market Value (US$ Million) by Sales Channel, 2023 to 2033 Figure 152: Western Europe Market Value (US$ Million) by Country, 2023 to 2033 Figure 153: Western Europe Market Value (US$ Million) Analysis by Country, 2018 to 2033 Figure 154: Western Europe Market Volume (Units) Analysis by Country, 2018 to 2033 Figure 155: Western Europe Market Value Share (%) and BPS Analysis by Country, 2023 to 2033 Figure 156: Western Europe Market Y-o-Y Growth (%) Projections by Country, 2023 to 2033 Figure 157: Western Europe Market Value (US$ Million) Analysis by Product Type, 2018 to 2033 Figure 158: Western Europe Market Volume (Units) Analysis by Product Type, 2018 to 2033 Figure 159: Western Europe Market Value Share (%) and BPS Analysis by Product Type, 2023 to 2033 Figure 160: Western Europe Market Y-o-Y Growth (%) Projections by Product Type, 2023 to 2033 Figure 161: Western Europe Market Value (US$ Million) Analysis by Style, 2018 to 2033 Figure 162: Western Europe Market Volume (Units) Analysis by Style, 2018 to 2033 Figure 163: Western Europe Market Value Share (%) and BPS Analysis by Style, 2023 to 2033 Figure 164: Western Europe Market Y-o-Y Growth (%) Projections by Style, 2023 to 2033 Figure 165: Western Europe Market Value (US$ Million) Analysis by Material Type, 2018 to 2033 Figure 166: Western Europe Market Volume (Units) Analysis by Material Type, 2018 to 2033 Figure 167: Western Europe Market Value Share (%) and BPS Analysis by Material Type, 2023 to 2033 Figure 168: Western Europe Market Y-o-Y Growth (%) Projections by Material Type, 2023 to 2033 Figure 169: Western Europe Market Value (US$ Million) Analysis by Size, 2018 to 2033 Figure 170: Western Europe Market Volume (Units) Analysis by Size, 2018 to 2033 Figure 171: Western Europe Market Value Share (%) and BPS Analysis by Size, 2023 to 2033 Figure 172: Western Europe Market Y-o-Y Growth (%) Projections by Size, 2023 to 2033 Figure 173: Western Europe Market Value (US$ Million) Analysis by Price Range, 2018 to 2033 Figure 174: Western Europe Market Volume (Units) Analysis by Price Range, 2018 to 2033 Figure 175: Western Europe Market Value Share (%) and BPS Analysis by Price Range, 2023 to 2033 Figure 176: Western Europe Market Y-o-Y Growth (%) Projections by Price Range, 2023 to 2033 Figure 177: Western Europe Market Value (US$ Million) Analysis by End User, 2018 to 2033 Figure 178: Western Europe Market Volume (Units) Analysis by End User, 2018 to 2033 Figure 179: Western Europe Market Value Share (%) and BPS Analysis by End User, 2023 to 2033 Figure 180: Western Europe Market Y-o-Y Growth (%) Projections by End User, 2023 to 2033 Figure 181: Western Europe Market Value (US$ Million) Analysis by Sales Channel, 2018 to 2033 Figure 182: Western Europe Market Volume (Units) Analysis by Sales Channel, 2018 to 2033 Figure 183: Western Europe Market Value Share (%) and BPS Analysis by Sales Channel, 2023 to 2033 Figure 184: Western Europe Market Y-o-Y Growth (%) Projections by Sales Channel, 2023 to 2033 Figure 185: Western Europe Market Attractiveness by Product Type, 2023 to 2033 Figure 186: Western Europe Market Attractiveness by Style, 2023 to 2033 Figure 187: Western Europe Market Attractiveness by Material Type, 2023 to 2033 Figure 188: Western Europe Market Attractiveness by Size, 2023 to 2033 Figure 189: Western Europe Market Attractiveness by Price Range, 2023 to 2033 Figure 190: Western Europe Market Attractiveness by End User, 2023 to 2033 Figure 191: Western Europe Market Attractiveness by Sales Channel, 2023 to 2033 Figure 192: Western Europe Market Attractiveness by Country, 2023 to 2033 Figure 193: Eastern Europe Market Value (US$ Million) by Product Type, 2023 to 2033 Figure 194: Eastern Europe Market Value (US$ Million) by Style, 2023 to 2033 Figure 195: Eastern Europe Market Value (US$ Million) by Material Type, 2023 to 2033 Figure 196: Eastern Europe Market Value (US$ Million) by Size, 2023 to 2033 Figure 197: Eastern Europe Market Value (US$ Million) by Price Range, 2023 to 2033 Figure 198: Eastern Europe Market Value (US$ Million) by End User, 2023 to 2033 Figure 199: Eastern Europe Market Value (US$ Million) by Sales Channel, 2023 to 2033 Figure 200: Eastern Europe Market Value (US$ Million) by Country, 2023 to 2033 Figure 201: Eastern Europe Market Value (US$ Million) Analysis by Country, 2018 to 2033 Figure 202: Eastern Europe Market Volume (Units) Analysis by Country, 2018 to 2033 Figure 203: Eastern Europe Market Value Share (%) and BPS Analysis by Country, 2023 to 2033 Figure 204: Eastern Europe Market Y-o-Y Growth (%) Projections by Country, 2023 to 2033 Figure 205: Eastern Europe Market Value (US$ Million) Analysis by Product Type, 2018 to 2033 Figure 206: Eastern Europe Market Volume (Units) Analysis by Product Type, 2018 to 2033 Figure 207: Eastern Europe Market Value Share (%) and BPS Analysis by Product Type, 2023 to 2033 Figure 208: Eastern Europe Market Y-o-Y Growth (%) Projections by Product Type, 2023 to 2033 Figure 209: Eastern Europe Market Value (US$ Million) Analysis by Style, 2018 to 2033 Figure 210: Eastern Europe Market Volume (Units) Analysis by Style, 2018 to 2033 Figure 211: Eastern Europe Market Value Share (%) and BPS Analysis by Style, 2023 to 2033 Figure 212: Eastern Europe Market Y-o-Y Growth (%) Projections by Style, 2023 to 2033 Figure 213: Eastern Europe Market Value (US$ Million) Analysis by Material Type, 2018 to 2033 Figure 214: Eastern Europe Market Volume (Units) Analysis by Material Type, 2018 to 2033 Figure 215: Eastern Europe Market Value Share (%) and BPS Analysis by Material Type, 2023 to 2033 Figure 216: Eastern Europe Market Y-o-Y Growth (%) Projections by Material Type, 2023 to 2033 Figure 217: Eastern Europe Market Value (US$ Million) Analysis by Size, 2018 to 2033 Figure 218: Eastern Europe Market Volume (Units) Analysis by Size, 2018 to 2033 Figure 219: Eastern Europe Market Value Share (%) and BPS Analysis by Size, 2023 to 2033 Figure 220: Eastern Europe Market Y-o-Y Growth (%) Projections by Size, 2023 to 2033 Figure 221: Eastern Europe Market Value (US$ Million) Analysis by Price Range, 2018 to 2033 Figure 222: Eastern Europe Market Volume (Units) Analysis by Price Range, 2018 to 2033 Figure 223: Eastern Europe Market Value Share (%) and BPS Analysis by Price Range, 2023 to 2033 Figure 224: Eastern Europe Market Y-o-Y Growth (%) Projections by Price Range, 2023 to 2033 Figure 225: Eastern Europe Market Value (US$ Million) Analysis by End User, 2018 to 2033 Figure 226: Eastern Europe Market Volume (Units) Analysis by End User, 2018 to 2033 Figure 227: Eastern Europe Market Value Share (%) and BPS Analysis by End User, 2023 to 2033 Figure 228: Eastern Europe Market Y-o-Y Growth (%) Projections by End User, 2023 to 2033 Figure 229: Eastern Europe Market Value (US$ Million) Analysis by Sales Channel, 2018 to 2033 Figure 230: Eastern Europe Market Volume (Units) Analysis by Sales Channel, 2018 to 2033 Figure 231: Eastern Europe Market Value Share (%) and BPS Analysis by Sales Channel, 2023 to 2033 Figure 232: Eastern Europe Market Y-o-Y Growth (%) Projections by Sales Channel, 2023 to 2033 Figure 233: Eastern Europe Market Attractiveness by Product Type, 2023 to 2033 Figure 234: Eastern Europe Market Attractiveness by Style, 2023 to 2033 Figure 235: Eastern Europe Market Attractiveness by Material Type, 2023 to 2033 Figure 236: Eastern Europe Market Attractiveness by Size, 2023 to 2033 Figure 237: Eastern Europe Market Attractiveness by Price Range, 2023 to 2033 Figure 238: Eastern Europe Market Attractiveness by End User, 2023 to 2033 Figure 239: Eastern Europe Market Attractiveness by Sales Channel, 2023 to 2033 Figure 240: Eastern Europe Market Attractiveness by Country, 2023 to 2033 Figure 241: South Asia and Pacific Market Value (US$ Million) by Product Type, 2023 to 2033 Figure 242: South Asia and Pacific Market Value (US$ Million) by Style, 2023 to 2033 Figure 243: South Asia and Pacific Market Value (US$ Million) by Material Type, 2023 to 2033 Figure 244: South Asia and Pacific Market Value (US$ Million) by Size, 2023 to 2033 Figure 245: South Asia and Pacific Market Value (US$ Million) by Price Range, 2023 to 2033 Figure 246: South Asia and Pacific Market Value (US$ Million) by End User, 2023 to 2033 Figure 247: South Asia and Pacific Market Value (US$ Million) by Sales Channel, 2023 to 2033 Figure 248: South Asia and Pacific Market Value (US$ Million) by Country, 2023 to 2033 Figure 249: South Asia and Pacific Market Value (US$ Million) Analysis by Country, 2018 to 2033 Figure 250: South Asia and Pacific Market Volume (Units) Analysis by Country, 2018 to 2033 Figure 251: South Asia and Pacific Market Value Share (%) and BPS Analysis by Country, 2023 to 2033 Figure 252: South Asia and Pacific Market Y-o-Y Growth (%) Projections by Country, 2023 to 2033 Figure 253: South Asia and Pacific Market Value (US$ Million) Analysis by Product Type, 2018 to 2033 Figure 254: South Asia and Pacific Market Volume (Units) Analysis by Product Type, 2018 to 2033 Figure 255: South Asia and Pacific Market Value Share (%) and BPS Analysis by Product Type, 2023 to 2033 Figure 256: South Asia and Pacific Market Y-o-Y Growth (%) Projections by Product Type, 2023 to 2033 Figure 257: South Asia and Pacific Market Value (US$ Million) Analysis by Style, 2018 to 2033 Figure 258: South Asia and Pacific Market Volume (Units) Analysis by Style, 2018 to 2033 Figure 259: South Asia and Pacific Market Value Share (%) and BPS Analysis by Style, 2023 to 2033 Figure 260: South Asia and Pacific Market Y-o-Y Growth (%) Projections by Style, 2023 to 2033 Figure 261: South Asia and Pacific Market Value (US$ Million) Analysis by Material Type, 2018 to 2033 Figure 262: South Asia and Pacific Market Volume (Units) Analysis by Material Type, 2018 to 2033 Figure 263: South Asia and Pacific Market Value Share (%) and BPS Analysis by Material Type, 2023 to 2033 Figure 264: South Asia and Pacific Market Y-o-Y Growth (%) Projections by Material Type, 2023 to 2033 Figure 265: South Asia and Pacific Market Value (US$ Million) Analysis by Size, 2018 to 2033 Figure 266: South Asia and Pacific Market Volume (Units) Analysis by Size, 2018 to 2033 Figure 267: South Asia and Pacific Market Value Share (%) and BPS Analysis by Size, 2023 to 2033 Figure 268: South Asia and Pacific Market Y-o-Y Growth (%) Projections by Size, 2023 to 2033 Figure 269: South Asia and Pacific Market Value (US$ Million) Analysis by Price Range, 2018 to 2033 Figure 270: South Asia and Pacific Market Volume (Units) Analysis by Price Range, 2018 to 2033 Figure 271: South Asia and Pacific Market Value Share (%) and BPS Analysis by Price Range, 2023 to 2033 Figure 272: South Asia and Pacific Market Y-o-Y Growth (%) Projections by Price Range, 2023 to 2033 Figure 273: South Asia and Pacific Market Value (US$ Million) Analysis by End User, 2018 to 2033 Figure 274: South Asia and Pacific Market Volume (Units) Analysis by End User, 2018 to 2033 Figure 275: South Asia and Pacific Market Value Share (%) and BPS Analysis by End User, 2023 to 2033 Figure 276: South Asia and Pacific Market Y-o-Y Growth (%) Projections by End User, 2023 to 2033 Figure 277: South Asia and Pacific Market Value (US$ Million) Analysis by Sales Channel, 2018 to 2033 Figure 278: South Asia and Pacific Market Volume (Units) Analysis by Sales Channel, 2018 to 2033 Figure 279: South Asia and Pacific Market Value Share (%) and BPS Analysis by Sales Channel, 2023 to 2033 Figure 280: South Asia and Pacific Market Y-o-Y Growth (%) Projections by Sales Channel, 2023 to 2033 Figure 281: South Asia and Pacific Market Attractiveness by Product Type, 2023 to 2033 Figure 282: South Asia and Pacific Market Attractiveness by Style, 2023 to 2033 Figure 283: South Asia and Pacific Market Attractiveness by Material Type, 2023 to 2033 Figure 284: South Asia and Pacific Market Attractiveness by Size, 2023 to 2033 Figure 285: South Asia and Pacific Market Attractiveness by Price Range, 2023 to 2033 Figure 286: South Asia and Pacific Market Attractiveness by End User, 2023 to 2033 Figure 287: South Asia and Pacific Market Attractiveness by Sales Channel, 2023 to 2033 Figure 288: South Asia and Pacific Market Attractiveness by Country, 2023 to 2033 Figure 289: East Asia Market Value (US$ Million) by Product Type, 2023 to 2033 Figure 290: East Asia Market Value (US$ Million) by Style, 2023 to 2033 Figure 291: East Asia Market Value (US$ Million) by Material Type, 2023 to 2033 Figure 292: East Asia Market Value (US$ Million) by Size, 2023 to 2033 Figure 293: East Asia Market Value (US$ Million) by Price Range, 2023 to 2033 Figure 294: East Asia Market Value (US$ Million) by End User, 2023 to 2033 Figure 295: East Asia Market Value (US$ Million) by Sales Channel, 2023 to 2033 Figure 296: East Asia Market Value (US$ Million) by Country, 2023 to 2033 Figure 297: East Asia Market Value (US$ Million) Analysis by Country, 2018 to 2033 Figure 298: East Asia Market Volume (Units) Analysis by Country, 2018 to 2033 Figure 299: East Asia Market Value Share (%) and BPS Analysis by Country, 2023 to 2033 Figure 300: East Asia Market Y-o-Y Growth (%) Projections by Country, 2023 to 2033 Figure 301: East Asia Market Value (US$ Million) Analysis by Product Type, 2018 to 2033 Figure 302: East Asia Market Volume (Units) Analysis by Product Type, 2018 to 2033 Figure 303: East Asia Market Value Share (%) and BPS Analysis by Product Type, 2023 to 2033 Figure 304: East Asia Market Y-o-Y Growth (%) Projections by Product Type, 2023 to 2033 Figure 305: East Asia Market Value (US$ Million) Analysis by Style, 2018 to 2033 Figure 306: East Asia Market Volume (Units) Analysis by Style, 2018 to 2033 Figure 307: East Asia Market Value Share (%) and BPS Analysis by Style, 2023 to 2033 Figure 308: East Asia Market Y-o-Y Growth (%) Projections by Style, 2023 to 2033 Figure 309: East Asia Market Value (US$ Million) Analysis by Material Type, 2018 to 2033 Figure 310: East Asia Market Volume (Units) Analysis by Material Type, 2018 to 2033 Figure 311: East Asia Market Value Share (%) and BPS Analysis by Material Type, 2023 to 2033 Figure 312: East Asia Market Y-o-Y Growth (%) Projections by Material Type, 2023 to 2033 Figure 313: East Asia Market Value (US$ Million) Analysis by Size, 2018 to 2033 Figure 314: East Asia Market Volume (Units) Analysis by Size, 2018 to 2033 Figure 315: East Asia Market Value Share (%) and BPS Analysis by Size, 2023 to 2033 Figure 316: East Asia Market Y-o-Y Growth (%) Projections by Size, 2023 to 2033 Figure 317: East Asia Market Value (US$ Million) Analysis by Price Range, 2018 to 2033 Figure 318: East Asia Market Volume (Units) Analysis by Price Range, 2018 to 2033 Figure 319: East Asia Market Value Share (%) and BPS Analysis by Price Range, 2023 to 2033 Figure 320: East Asia Market Y-o-Y Growth (%) Projections by Price Range, 2023 to 2033 Figure 321: East Asia Market Value (US$ Million) Analysis by End User, 2018 to 2033 Figure 322: East Asia Market Volume (Units) Analysis by End User, 2018 to 2033 Figure 323: East Asia Market Value Share (%) and BPS Analysis by End User, 2023 to 2033 Figure 324: East Asia Market Y-o-Y Growth (%) Projections by End User, 2023 to 2033 Figure 325: East Asia Market Value (US$ Million) Analysis by Sales Channel, 2018 to 2033 Figure 326: East Asia Market Volume (Units) Analysis by Sales Channel, 2018 to 2033 Figure 327: East Asia Market Value Share (%) and BPS Analysis by Sales Channel, 2023 to 2033 Figure 328: East Asia Market Y-o-Y Growth (%) Projections by Sales Channel, 2023 to 2033 Figure 329: East Asia Market Attractiveness by Product Type, 2023 to 2033 Figure 330: East Asia Market Attractiveness by Style, 2023 to 2033 Figure 331: East Asia Market Attractiveness by Material Type, 2023 to 2033 Figure 332: East Asia Market Attractiveness by Size, 2023 to 2033 Figure 333: East Asia Market Attractiveness by Price Range, 2023 to 2033 Figure 334: East Asia Market Attractiveness by End User, 2023 to 2033 Figure 335: East Asia Market Attractiveness by Sales Channel, 2023 to 2033 Figure 336: East Asia Market Attractiveness by Country, 2023 to 2033 Figure 337: Middle East and Africa Market Value (US$ Million) by Product Type, 2023 to 2033 Figure 338: Middle East and Africa Market Value (US$ Million) by Style, 2023 to 2033 Figure 339: Middle East and Africa Market Value (US$ Million) by Material Type, 2023 to 2033 Figure 340: Middle East and Africa Market Value (US$ Million) by Size, 2023 to 2033 Figure 341: Middle East and Africa Market Value (US$ Million) by Price Range, 2023 to 2033 Figure 342: Middle East and Africa Market Value (US$ Million) by End User, 2023 to 2033 Figure 343: Middle East and Africa Market Value (US$ Million) by Sales Channel, 2023 to 2033 Figure 344: Middle East and Africa Market Value (US$ Million) by Country, 2023 to 2033 Figure 345: Middle East and Africa Market Value (US$ Million) Analysis by Country, 2018 to 2033 Figure 346: Middle East and Africa Market Volume (Units) Analysis by Country, 2018 to 2033 Figure 347: Middle East and Africa Market Value Share (%) and BPS Analysis by Country, 2023 to 2033 Figure 348: Middle East and Africa Market Y-o-Y Growth (%) Projections by Country, 2023 to 2033 Figure 349: Middle East and Africa Market Value (US$ Million) Analysis by Product Type, 2018 to 2033 Figure 350: Middle East and Africa Market Volume (Units) Analysis by Product Type, 2018 to 2033 Figure 351: Middle East and Africa Market Value Share (%) and BPS Analysis by Product Type, 2023 to 2033 Figure 352: Middle East and Africa Market Y-o-Y Growth (%) Projections by Product Type, 2023 to 2033 Figure 353: Middle East and Africa Market Value (US$ Million) Analysis by Style, 2018 to 2033 Figure 354: Middle East and Africa Market Volume (Units) Analysis by Style, 2018 to 2033 Figure 355: Middle East and Africa Market Value Share (%) and BPS Analysis by Style, 2023 to 2033 Figure 356: Middle East and Africa Market Y-o-Y Growth (%) Projections by Style, 2023 to 2033 Figure 357: Middle East and Africa Market Value (US$ Million) Analysis by Material Type, 2018 to 2033 Figure 358: Middle East and Africa Market Volume (Units) Analysis by Material Type, 2018 to 2033 Figure 359: Middle East and Africa Market Value Share (%) and BPS Analysis by Material Type, 2023 to 2033 Figure 360: Middle East and Africa Market Y-o-Y Growth (%) Projections by Material Type, 2023 to 2033 Figure 361: Middle East and Africa Market Value (US$ Million) Analysis by Size, 2018 to 2033 Figure 362: Middle East and Africa Market Volume (Units) Analysis by Size, 2018 to 2033 Figure 363: Middle East and Africa Market Value Share (%) and BPS Analysis by Size, 2023 to 2033 Figure 364: Middle East and Africa Market Y-o-Y Growth (%) Projections by Size, 2023 to 2033 Figure 365: Middle East and Africa Market Value (US$ Million) Analysis by Price Range, 2018 to 2033 Figure 366: Middle East and Africa Market Volume (Units) Analysis by Price Range, 2018 to 2033 Figure 367: Middle East and Africa Market Value Share (%) and BPS Analysis by Price Range, 2023 to 2033 Figure 368: Middle East and Africa Market Y-o-Y Growth (%) Projections by Price Range, 2023 to 2033 Figure 369: Middle East and Africa Market Value (US$ Million) Analysis by End User, 2018 to 2033 Figure 370: Middle East and Africa Market Volume (Units) Analysis by End User, 2018 to 2033 Figure 371: Middle East and Africa Market Value Share (%) and BPS Analysis by End User, 2023 to 2033 Figure 372: Middle East and Africa Market Y-o-Y Growth (%) Projections by End User, 2023 to 2033 Figure 373: Middle East and Africa Market Value (US$ Million) Analysis by Sales Channel, 2018 to 2033 Figure 374: Middle East and Africa Market Volume (Units) Analysis by Sales Channel, 2018 to 2033 Figure 375: Middle East and Africa Market Value Share (%) and BPS Analysis by Sales Channel, 2023 to 2033 Figure 376: Middle East and Africa Market Y-o-Y Growth (%) Projections by Sales Channel, 2023 to 2033 Figure 377: Middle East and Africa Market Attractiveness by Product Type, 2023 to 2033 Figure 378: Middle East and Africa Market Attractiveness by Style, 2023 to 2033 Figure 379: Middle East and Africa Market Attractiveness by Material Type, 2023 to 2033 Figure 380: Middle East and Africa Market Attractiveness by Size, 2023 to 2033 Figure 381: Middle East and Africa Market Attractiveness by Price Range, 2023 to 2033 Figure 382: Middle East and Africa Market Attractiveness by End User, 2023 to 2033 Figure 383: Middle East and Africa Market Attractiveness by Sales Channel, 2023 to 2033 Figure 384: Middle East and Africa Market Attractiveness by Country, 2023 to 2033
Recommendations
Explore Consumer Product Insights
View Reports