
- Market Size (2026)
- USD 53.0 Bn
- Forecast (2036)
- USD 83.9 Bn
- CAGR (2026 to 2036)
- 4.7%
How big is the Alumina Market in 2026?
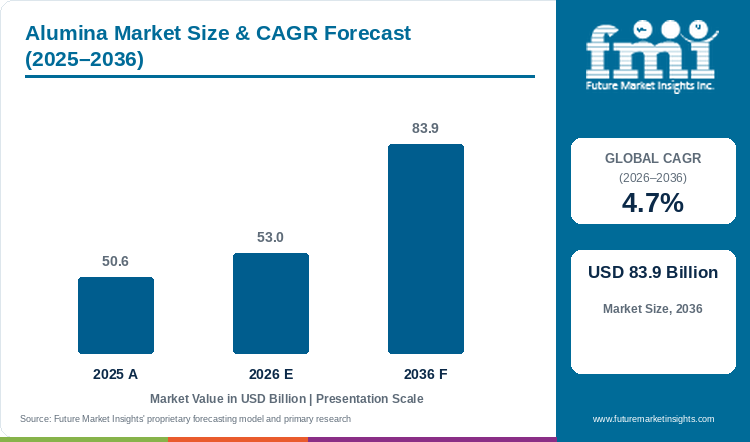
The global alumina market is estimated at USD 52.98 billion in 2026, compared with USD 50.6 billion in 2025, and is forecast to reach USD 83.86 billion by 2036, expanding at a CAGR of 4.7% from 2026 to 2036.
Smelter grade accounts for 42.0% by grade in 2026, aluminium production for 61.0% by application, and the Bayer process for 96.0% by production route in FMI's assessment. FMI finds that a smelter's supply position depends on available refinery output, rather than installed capacity alone. Alcoa's 2025 results reported lower alumina production following Kwinana's earlier curtailment, and its September 2025 announcement made the closure of that 2.2 million tonne annual capacity permanent. Rio Tinto reported 7.6 million tonnes of alumina production in 2025, up 4%. These divergent operating changes distinguish tonnes actually produced from the capacity still installed.
Heat supply can restrict output at a refinery that remains in service. On 13 August 2026, Hydro said Alunorte had begun raising production after regulatory approval to import gas itself and a temporary terminal-access agreement with supplier CELBA. Hydro then estimated lost production at 100,000 to 120,000 tonnes and a possible third-quarter financial effect of USD 75 to 100 million from reduced output and gas bought above the contract price. The interruption consequently affected both physical volume and input cost. The announcement described a ramp-up while a longer-term solution was being pursued.
Key Market Trends & Insights
- Alcoa calculates its Alumina Price Index from a weighted average of a prior month's daily spot prices from three published indices. Its index-linked alumina contracts add negotiated adjustments for freight, quality, customer location and market conditions. The contract price therefore reflects an earlier pricing period as well as the terms of the individual shipment.
- NALCO's June 2026 commissioning-support document identified a shortage of experienced personnel for its fifth refinery stream. New capacity creates work for commissioning and operating specialists before it creates dependable saleable tonnes.
- Hydro's 2025 annual report identifies bauxite, energy and caustic soda as the principal alumina refining cost drivers. A change in the metal price alone cannot explain the cost of a refinery shipment; feed and process-input contracts also matter.
Regional Highlights
- East Asia contains a large local refining and smelting chain. USGS's 2025 summary estimated China's 2024 alumina production at 84 million tonnes. Alongside that bulk refining base, Almatis reported the topping-out of a new Qingdao facility for high-purity alumina and specialty ceramic materials in July 2026; construction and commissioning still lay ahead.
- South Asia and Pacific combines Indian refinery expansion with Australian output restraint. NALCO's fifth-stream project is intended to add 1 million tonnes of annual capacity, while Rio Tinto specified a 40% production reduction at Yarwun from October 2026 to extend the operation's life. The two developments put additional refining capacity and reduced operating throughput in the same regional outlook.
Table 1: Alumina Market Size and Forecast (USD billion and CAGR percentage), 2025 to 2036
| Market size and forecast | Value |
|---|---|
| Market size in 2025 | USD 50.6 billion |
| Estimated market size in 2026 | USD 52.98 billion |
| Projected market size by 2036 | USD 83.86 billion |
| CAGR from 2026 to 2036 | 4.7% |
| Added revenue from 2026 to 2036 | USD 30.88 billion |
Source: Future Market Insights, Alumina Market Report, 2026 to 2036.
Analyst Perspective
“A smelter needs a regular alumina feed even when a nearby refinery closes. Global primary aluminium output of about 73.78 million tonnes in 2025 rests on that feed, so the replacement question is where qualified tonnes can come from and how much of another producer's output is already committed to its own metal plants.”
- Nikhil Kaitwade, Principal Consultant, FMI
How is the Alumina Market segmented?
- By Grade: Smelter grade; Calcined and reactive alumina; Tabular and fused alumina; Chemical and other non-metallurgical grades.
- By Application: Aluminium production; Ceramics and refractories; Abrasives and filtration; Other industrial uses.
- By Production Route: Bayer process; Sintering and combined routes; Other routes.
- By Region: North America; Latin America; Western Europe; Eastern Europe; East Asia; South Asia and Pacific; Middle East and Africa.
Production route refers to the initial extraction or refining origin; later preparation of a grade remains within the alumina feedstock's origin.
Why does smelter grade lead by grade?
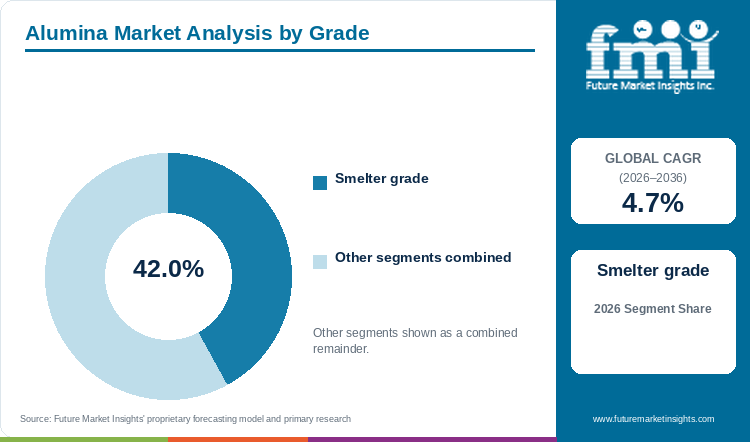
Smelter grade holds 42.0% of the alumina market by grade in 2026.
Captive metal demand and index-linked external trade give smelter-grade supply two distinct commercial channels. Alcoa's own aluminium smelters accounted for approximately 34% of its total alumina shipments in 2025. Its Form 10-K also says approximately 95% of third-party smelter-grade shipments used an adjusted alumina-price-index or fixed-price spot basis. The internal allocation and the negotiated freight, quality and location adjustments explain why a refinery's output, third-party sales and realised revenue are different measures.
Specialty products are differentiated more narrowly than the broad grade labels suggest. Almatis's reactive range includes RG 4000 with a D50 particle size of 0.6 micrometres and soda content of 0.08%, and CTC 20 at 1.8 micrometres and 0.12%. Its unground calcined range separately spans primary crystal sizes of 0.3 to 25 micrometres and several soda classes. These are documented differences in the products sold, rather than one interchangeable remainder behind smelter grade's 42.0% value share.
Table 2: Alumina Market Share by Grade, 2026
| Leading Share | 2026 market share |
|---|---|
| Smelter grade | 42.0% |
| All Other Segments Combined Share | 58.0% |
Source: Future Market Insights, Alumina Market Report, 2026 to 2036.
Why is aluminium production the largest application?
Aluminium production accounts for 61.0% of the alumina market by application in 2026.
The operating changes behind aluminium feed demand are visible at named metal plants. Alcoa's aluminium production rose 5% in 2025, primarily as Alumar in Brazil, San Ciprián in Spain and Lista in Norway restarted capacity. Its alumina production fell 4% over the same year. The divergent movements show why growth in this application can be met through changes in sourcing as well as refinery output. They also keep aluminium production distinct from USGS's separate alumina refining stage.
Alcoa's third-party alumina shipments declined 2% in 2025, with lower production and trading partly offset by more externally sourced material used to meet customer commitments. That recorded sourcing activity is the commercial response to a refining system under constraint. Kwinana had already ceased production before the permanent closure announcement. Its later removal from capacity should not be counted as a second contemporaneous loss of operating supply. The 61.0% application share classifies end use, separately from the grade view.
Table 3: Alumina Market Share by Application, 2026
| Leading Share | 2026 market share |
|---|---|
| Aluminium production | 61.0% |
| All Other Segments Combined Share | 39.0% |
Source: Future Market Insights, Alumina Market Report, 2026 to 2036.
What supports the Bayer process as the leading production route?
The Bayer process accounts for 96.0% of the alumina market by production route in FMI's 2026 assessment.
The International Aluminium Institute's production primer describes Bayer refining as the predominant process. Its refining-energy series excludes non-bauxitic routes, which account for less than 1% of global metallurgical alumina output; the benchmark does not cover the full specialty-grade portfolio. Alcoa's 2025 Form 10-K describes its bauxite refining through the Bayer process alongside sales of smelter-grade and non-metallurgical alumina. This is an operating production system serving both the company's own metal plants and third-party material markets. The extraction route and product grade describe different parts of that system; a specialty product label alone does not identify a separate extraction process.
Production route follows the initial extraction or refining origin. CUMI identifies Bayer alumina as the feedstock for white fused alumina; Almatis describes tabular material made by sintering calcined alumina, and brown fused material made directly from calcined bauxite. Bayer-origin oxide consequently retains that origin through downstream tabular sintering or white fusion. Direct-bauxite brown fusion belongs to Other routes; ore-sintering and combined extraction remain within Sintering and combined routes. SAMI documents the corresponding Bayer, combined and sintering technologies. QAL separately describes hydrate being calcined to alumina powder. The oxide boundary excludes separately sold hydrate.
Changes within the route can still alter the process infrastructure. ARENA's Yarwun project record describes a proposed thermal-storage system for process steam, subject to a feasibility study, review and a final investment decision. The project addresses heat at the existing refinery. The planned change is steam supply within that operation, while sintering, combined routes and other processes remain separately classified production routes.
These route groups follow initial extraction or refining origin. Downstream tabular sintering or white fusion retains the alumina feedstock's origin; direct-bauxite brown fusion is included in Other routes.
Table 4: Alumina Market Share by Production Route, 2026
| Leading Share | 2026 market share |
|---|---|
| Bayer process | 96.0% |
| All Other Segments Combined Share | 4.0% |
Source: Future Market Insights, Alumina Market Report, 2026 to 2036.
What are the key drivers restraints and opportunities?
Smelter restarts support the feed market while gas access and residue capacity constrain refining throughput. Beyond bulk feed, recorded specialty sales and distribution agreements show a separate route to revenue.
Driver
Rio Tinto's New Zealand Aluminium Smelters returned to full production rates in the fourth quarter of 2025, after ramping up when Meridian Energy's request for a 50 MW electricity reduction ended in June. The group reported 3.38 million tonnes of primary aluminium for the year, up 3%. This is a specific recovery in the operating metal base served by alumina. It accompanied, rather than duplicated, the group's separate 4% increase in alumina output.
Restraint
Process heat and residue capacity can restrict output without eliminating the underlying asset. Hydro's Alunorte update describes a temporary production reduction linked to gas availability. Rio Tinto's Yarwun notice links lower throughput to the life of its tailings facility. It also says the curtailment would not affect customer requirements or the group's other operations. A site production constraint and a loss of customer supply are therefore separate commercial questions.
Opportunity
Lower-carbon non-metallurgical alumina provides a demonstrated sales outlet beyond smelter feed. Alcoa's EcoSource offer reached six customers in 2023 and 2024, following its launch for this market in 2022. The disclosed product family includes both hydrates and calcined material. Almatis supplies a different specialty range, including calcined, reactive and tabular aluminas. These offers place product composition and processing alongside bulk refining scale in competition.
How do quality and environmental requirements affect purchasing?
Alcoa defines EcoSource's reported carbon intensity across bauxite mining and alumina refining, including Scope 1 and Scope 2 emissions, at an average below 0.6 tonnes of CO2 equivalent per tonne of alumina from its global refining system. Almatis's calcined range is instead differentiated by crystal size, purity and soda class. The environmental and physical specifications therefore describe different attributes of an offer. Neither a company-wide emissions figure nor a planned heat project substitutes for a particular product specification.
What limits reliable refinery delivery?
Yarwun's constraint is residue storage, rather than absence of bauxite or refining equipment. Rio Tinto said its tailings facility would reach capacity by 2031 at the then-current production rate. The 40% output reduction from October 2026 was intended to keep the operation running until 2035 while further solutions were explored. Hydro separately identifies bauxite, energy and caustic soda as major refining costs. Resource ownership alone does not remove a residue-capacity limit or the cost of process inputs.
Where can suppliers win additional business?
Alcoa's January 2026 outlook set alumina production at 9.7 to 9.9 million tonnes and shipments at 11.8 to 12.0 million tonnes. It explicitly linked the difference to trading and externally sourced alumina fulfilling customer contracts. That disclosed delivery model extends sales beyond the producer's own refinery tonnes. In specialty materials, Almatis and Stockmeier/Bassermann expanded their European distribution cooperation in March 2026. The two mechanisms are concrete: purchased commodity supply and a wider specialty sales channel.
Alumina Market by Country (2026 to 2036)
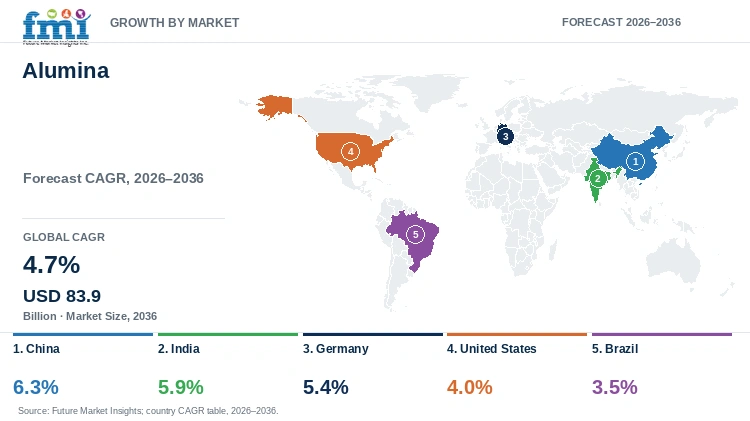
Table 5: Alumina Market Country CAGR Comparison, 2026 to 2036
| Country | CAGR |
|---|---|
| China | 6.3% |
| India | 5.9% |
| Germany | 5.4% |
| United States | 4.0% |
| Brazil | 3.5% |
Source: Future Market Insights, Alumina Market Report, 2026 to 2036.
What supports alumina demand in China?
China's refining scale is accompanied by direct exposure to imported ore. Chalco's 2025 industry review reported 200 million tonnes of national bauxite imports, of which Guinea supplied 74.3% and Australia 18.6%. Those shares locate an important resource dependency upstream of domestic alumina production. The Ministry of Industry and Information Technology's explanation of its 2025 to 2027 aluminium plan identifies resource supply, energy conservation and emissions reduction as industry issues. The commercial significance is the coexistence of a large domestic refining base with concentrated overseas feed supply.
USGS's 2025 summary estimated Chinese alumina output at 84 million tonnes in 2024. The later market was not simply a larger version at a stable price. Chalco reported an average Chinese alumina spot price of RMB 3,221 per tonne in 2025, down 21.1%, as new capacity, maintenance and subsequent restarts changed supply. Output and realised value can consequently move differently within this refining chain. A producer's resource position and its exposure to the spot price both matter to its commercial performance.
Specialty investment adds a separate dimension to FMI's 6.3% CAGR forecast for China's alumina market from 2026 to 2036, the highest in the country comparison. Almatis's July 2026 Qingdao announcement placed its new high-purity alumina and specialty ceramics facility at the main-structure completion stage. Construction and commissioning were to follow, with semiconductor, electronics and new-energy applications identified as target sectors. This is a development of the local product mix alongside bulk refining. It is not operating output at the announcement date, so its prospective contribution depends on completing the remaining project stages.
How does integrated refining shape India's market?
NALCO's June 2026 request for experienced fifth-stream commissioning support identifies work still needed between an Indian expansion and operating output. Its document described commissioning knowledge lost through employee retirements. An earlier target date therefore cannot establish that the new stream was fully available. The request is also an actual procurement opportunity for commissioning expertise, tied to a named refinery project and a stated staffing gap.
The fifth stream is intended to add 1 million tonnes of annual capacity to NALCO's existing 2.1 million tonnes. The company's 2024 to 2025 annual report also recorded 1,064,881 tonnes of alumina exports, compared with 1,112,216 tonnes a year earlier. This existing external trade gives the expansion a commercial context beyond the company's integrated metal plant. The export figures are actual sales from the earlier year; the planned stream is a capacity addition whose contribution still depends on commissioning.
India also has an independently documented specialty manufacturing offer. In September 2026, Almatis and ROMCO signed a term sheet for a proposed brown fused alumina partnership combining ROMCO's Indian manufacturing with Almatis's sales, technical-service and distribution network. Definitive agreements remained subject to commercial and technical discussions in that announcement. FMI's 5.9% CAGR outlook for India from 2026 to 2036 therefore sits within a market containing bulk refinery expansion, existing alumina exports and specialty processing. The term sheet establishes the proposed channel and partners; it does not establish completed collaboration sales or full utilisation of NALCO's new stream.
Why do qualified grades matter in Germany?
Germany's specialty alumina position includes defined products and processing capability. Almatis's company history identifies tabular alumina capability at Ludwigshafen, while its reactive range distinguishes mono-modal from bi-modal particle distributions. RG 4000 and CL 370, for example, are listed with different D50 values and soda contents. These named products make the specialty offer more specific than a general ceramic or refractory grade. The distinction concerns material properties; a national bulk-refining total cannot describe the resulting portfolio of powders and aggregates.
The German metal chain requires a different reading. USGS distinguishes primary from secondary aluminium production and records reliance on imported raw materials. Primary metal production uses refined alumina feed, while scrap remelting does not create that same direct requirement. This separates two operating markets that a combined aluminium tonnage would obscure. In Germany's alumina trade, conventional smelter feed and specialty products consequently have different demand foundations, even when both are sold into the wider aluminium and materials industries.
German specialty suppliers also sell through a wider European network. Almatis GmbH and Stockmeier/Bassermann announced at Munich's Ceramitec fair in March 2026 that their distribution cooperation was expanding to France, Italy, Spain and Portugal. Their notice names existing product brands and regional contacts. This documents a route to external European accounts alongside German industrial demand. FMI forecasts 5.4% CAGR for Germany's alumina market from 2026 to 2036, reflecting the value of the grades sold as well as conventional feed demand. The commercial distinction is between domestic end use and the regional sales reach of suppliers based in Germany.
What shapes supply decisions in the United States?
Imports are a substantial part of the United States' alumina trade. USGS recorded 1.77 million tonnes of imports for consumption in 2025, with Brazil supplying 70% and Jamaica 13%. Fourth-quarter imports were 361,000 tonnes, down 29% from the preceding quarter. Brazil was consequently the principal external source in the reported trade, while the quarterly decline records a reduction in incoming volume. Supplier exposure is concentrated by origin even though the cargo flow changes during the year.
The domestic refining base is narrower than the country's supplier roster. USGS's 2025 summary estimated US alumina production at 720,000 tonnes in 2024. ATALCO identifies Gramercy, Louisiana as its operating refinery, linked to Jamaican bauxite and direct sea and river access. Its site describes truck, rail and barge loading and a calcined C-70 product alongside hydrate lines. That combination places upstream ore access, domestic refining and several dispatch modes within one disclosed business. The earlier national production figure and later import figures retain their separate years.
Investment at Gramercy provides a further specific factor in FMI's 4.0% CAGR forecast for the United States from 2026 to 2036. ATALCO's January 2026 partnership announcement reported USD 150 million of government preferred equity and more than USD 300 million of private capital, intended to sustain and raise alumina production and build a gallium circuit. It described an expectation of over 1 million tonnes of annual alumina production. This is an investment and production objective at an existing refinery. It does not convert that target into achieved output, or make gallium revenue part of the alumina market.
How does refinery operation affect Brazil's outlook?
Alunorte's August 2026 gas disruption exposed a specific operating cost in Brazil's refining system. Hydro said the refinery had begun raising alumina production after obtaining regulatory approval to become a gas self-importer and temporary terminal access from CELBA. It estimated the interruption's lost output at 100,000 to 120,000 tonnes and a possible third-quarter financial effect of USD 75 to 100 million, including gas bought above the contract price. The ramp-up and pursuit of a longer-term solution were the announced status; the lost tonnes were not presented as already recovered.
Brazil's physical production base was estimated at 11 million tonnes in 2024 in USGS's 2025 summary. Hydro describes Alunorte in Pará and the bauxite chain feeding it. Its separate operating account identifies both exports and supply to the nearby Albras aluminium plant. The refinery therefore serves an external market and an integrated local metal chain. National output, Alunorte's production and the material available for export are distinct measures of this business, rather than interchangeable indicators of merchant supply.
Energy investment is changing the refinery's process infrastructure. Hydro reported in June 2025 that natural gas had replaced fuel oil across six steam-generation units and seven calciners. It also identified three electric boilers replacing coal, one introduced in 2022 and two in 2025. These are installed operating changes, alongside the later gas-access interruption. FMI's 3.5% CAGR forecast for Brazil from 2026 to 2036, the lowest in the country comparison, reflects this market's value outlook. Cost and emissions improvements coexist with fuel-access exposure; the operating changes do not establish that all refineries or all shipment destinations follow one growth path.
Who are the notable companies in the Alumina Market?
Alcoa, Rio Tinto, NALCO and Almatis illustrate different commercial positions within alumina. Alcoa's own smelters received approximately 34% of its 2025 alumina shipments, while Rio Tinto reported 7.6 million tonnes of alumina output and a separate 3.38 million tonnes of primary aluminium. NALCO's 2024 to 2025 reporting records existing alumina exports alongside its integrated Indian chain. Almatis organises its offer around calcined, reactive and tabular products. These disclosures locate captive demand, external trade and specialty processing within the named supplier roster.
Rio Tinto's QAL arrangements show why ownership and product allocation can differ. Its 2025 operations review describes a two-year tolling agreement covering 100% of QAL capacity, while explaining that the additional output was excluded from the 2025 production tables and would enter the reporting basis from 2026. Almatis's proposed ROMCO collaboration instead connects an independent Indian manufacturer with a global specialty distribution network, subject to definitive agreements. These are distinct ways of controlling or marketing supply, with different disclosed contract and implementation boundaries.
Hydro adds Brazilian refining through Alunorte, which supplies export markets and Albras. Chalco reports alumina sales to its internal metal and trading businesses as well as external customers. Together, the companies cover several stages and channels of supply, from bulk refining and own-metal demand to merchant trade and specialty distribution.
Key Developments in the Alumina Market
- On 13 August 2026, Hydro announced that Alunorte had begun increasing alumina production after a temporary agreement on gas-terminal access, while work on a longer-term solution continued.
- On 21 October 2026, ARENA recorded the start of Rio Tinto's Yarwun thermal-energy-storage demonstration project. Construction remains subject to a feasibility study, stage-gate review and Rio Tinto's final investment decision.
Key Players in the Alumina Market
- Alcoa
- Rio Tinto
- NALCO
- Almatis
- Hydro
- Chalco
Alumina Market Report Scope
Table 6: Alumina Market Report Scope, 2026 to 2036
| Coverage field | Report scope |
|---|---|
| Market definition | Refined aluminium oxide supplied as smelter and non-metallurgical alumina, including comparable captive transfers. |
| Market boundaries | Counts supplied oxide value once; excludes bauxite mining value, finished aluminium, separately sold alumina hydrate and repeated intermediary transaction values. |
| Quantitative units | USD billion for market value; tonnes for physical production and capacity; percentages for shares and growth. |
| Forecast period | 2026 to 2036, with 2025 as the preceding reference year. |
| Grade coverage | Smelter grade; calcined and reactive; tabular and fused; chemical and other non-metallurgical grades. |
| Application coverage | Aluminium production; ceramics and refractories; abrasives and filtration; other industrial uses. |
| Production route coverage | Initial extraction or refining origin: Bayer process; sintering and combined routes; other routes, including direct-bauxite fusion. Downstream tabular sintering and white fusion retain the alumina feedstock origin. |
| Country analysis | China, India, Germany, United States and Brazil receive detailed forecast profiles. |
| Geographic coverage | Seven global regions with nested coverage; country profiles are selected analysis within the global totals. |
| Competitive coverage | Refinery availability, integrated supply and qualified grades; company positions are not numerical market-share rankings. |
Source: Future Market Insights, Alumina Market Report, 2026 to 2036.
Alumina Market Research Methodology
The assessment combines FMI's market series and country forecasts with secondary review of company operating disclosures, public mineral statistics, technical publications and project records. Market value counts refined oxide once, including comparable captive transfers, and excludes separately sold hydrate, bauxite mining and finished metal. Production route follows initial extraction or refining origin, with later grade preparation kept within that origin. Production, shipments, capacity and value remain separate measures. Company positions reflect documented operations and product offers; the review does not claim new primary interviews.
Alumina Market by Segments
Alumina Market segmented by Grade:
- Smelter grade
- Calcined and reactive alumina
- Tabular and fused alumina
- Chemical and other non-metallurgical grades
Alumina Market segmented by Application:
- Aluminium production
- Ceramics and refractories
- Abrasives and filtration
- Other industrial uses
Alumina Market segmented by Production Route:
- Bayer process
- Sintering and combined routes
- Other routes
Alumina Market by Region
- North America
- United States
- Canada
- Latin America
- Brazil
- Mexico
- Argentina
- Chile
- Western Europe
- Germany
- France
- United Kingdom
- Italy
- Spain
- Benelux
- Nordics
- Eastern Europe
- Poland
- Czech Republic
- Romania
- Hungary
- East Asia
- China
- Japan
- South Korea
- Taiwan
- South Asia and Pacific
- India
- Singapore
- Other ASEAN countries
- Australia and New Zealand
- Middle East and Africa
- GCC Countries
- South Africa
- Türkiye
- Israel
Research Sources and Bibliography
- [1] Rio Tinto. Fourth quarter and full year 2025 production results. January 2026.
- [2] Alcoa. Fourth Quarter and Full Year 2025 Results. January 2026.
- [3] Alcoa. Alcoa Announces Closure of Kwinana Refinery Also Updates Third Quarter 2025 Outlook. September 2025.
- [4] US Geological Survey. Mineral Commodity Summaries 2025, Bauxite and Alumina. January 2025.
- [5] Alcoa. Alcoa makes first EcoSource non-metallurgical alumina sales. 24 June 2024.
- [6] National Aluminium Company. Annual Report 2024 to 2025. September 2025.
- [7] Mysteel. IAI Global primary aluminum output exceeds 73 million tonnes in 2025. January 2026.
- [8] Almatis. Products and markets for specialty aluminas. Accessed 31 October 2026.
- [9] International Aluminium Institute. Metallurgical Alumina Refining Energy Intensity, definitions and coverage. Accessed 31 October 2026.
- [10] National Aluminium Company. Sustainable Development Report 2024 to 2025, expansion projects in progress. Published 2026.
- [11] National Aluminium Company. Expression of Interest for commissioning support for the fifth stream alumina refinery. June 2026.
- [12] Hydro. Alunorte ramps up alumina production. 13 August 2026.
- [13] Hydro. Integrated Annual Report 2025, Hydro Bauxite and Alumina business review. Published 2026.
- [14] Rio Tinto. Rio Tinto to reduce production at Yarwun Alumina Refinery to extend operational life. 18 November 2025.
- [15] International Aluminium Institute and Yale University. Primary Aluminum Production and Health A Primer on the Key Health Issues Associated with Mining Refining and Smelting, alumina refining chapter. 2013.
- [16] Australian Renewable Energy Agency. Rio Tinto Yarwun Thermal Energy Storage Industrial Demonstration Project. 21 October 2026.
- [17] Ministry of Industry and Information Technology of China. Explanation of the Implementation Plan for High Quality Development of the Aluminium Industry 2025 to 2027. 28 March 2025.
- [18] US Geological Survey. Germany mineral industry review, aluminium production in 2024. Accessed 31 October 2026.
- [19] Almatis. Our Story, company history and Ludwigshafen tabular alumina capability. Accessed 31 October 2026.
- [20] US Geological Survey. Bauxite and Alumina in the Fourth Quarter 2025, Table 3, US imports and exports. Published 2026.
- [21] Aluminum Corporation of China. Annual Report 2025. 27 March 2026.
- [22] Rio Tinto. Yarwun operations and market destinations. Accessed 31 October 2026.
- [23] Alcoa. Annual Report on Form 10-K for 2025, Alumina and Sources and Availability of Raw Materials. Filed 26 February 2026.
- [24] Almatis. Reactive Aluminas for the Refractory Market, named products and particle/chemistry data. Accessed 1 November 2026.
- [25] Almatis. Almatis New Qingdao Facility Reaches Major Construction Milestone. July 2026.
- [26] Almatis. Almatis and Stockmeier - Bassermann Minerals expand distribution cooperation across Europe. April 2026; announcement at Ceramitec on 25 March 2026.
- [27] Almatis. Almatis and ROMCO Announce Strategic Partnership for Brown Fused Alumina. 16 September 2026.
- [28] Atlantic Alumina. Gramercy operations, products, feed supply and transport facilities. Accessed 1 November 2026.
- [29] Atlantic Alumina. Atlantic Alumina Announces $450 Million Strategic Partnership with United States Government. 12 January 2026.
- [30] Hydro. One year after implementing natural gas, Hydro Alunorte has reduced annual CO2 emissions by 700,000 tonnes. 19 June 2025.
- [31] Almatis. Unground Calcined Aluminas for the Ceramics Industry, product ranges and soda classes. Accessed 1 November 2026.
- [32] Aluminum Corporation of China. 2025 Annual Results Announcement, industry review and alumina segment. 27 March 2026.
- [33] Carborundum Universal, Electro Minerals Division. Catalogue: Refractory Applications, White Fused Alumina for Refractories. Accessed 1 November 2026.
- [34] Almatis. Technical and Economic Review of High Alumina Raw Materials for Steel Refractories. International Colloquium on Refractories, Aachen, 8 to 9 September 2010, page 2.
- [35] Shenyang Aluminum and Magnesium Engineering and Research Institute. Overview of SAMI Alumina Technology. Accessed 1 November 2026.
- [36] Queensland Alumina Limited. Our Process, hydrate precipitation and calcination. Accessed 1 November 2026.
Table of Content
- Key Takeaways
- Market Size and CAGR
- Top Growth Driver
- Fastest Growing Segment
- Leading Region
- Key Companies
- Emerging Opportunities
- Executive Summary
- Global Market Outlook
- Demand-side Trends
- Supply-side Trends
- Technology Roadmap Analysis
- Analysis and Recommendations
- Analyst Perspective (What is happening? Why now? What should investors know?)
- Key Questions Answered
- How large is the market?
- What is the CAGR?
- What are key trends?
- Which region dominates?
- Who are the leaders?
Read More...
- Market Overview
- Market Coverage / Taxonomy
- Market Definition / Scope / Limitations
- Research Methodology
- Chapter Orientation
- Analytical Lens and Working Hypotheses
- Market Structure, Signals, and Trend Drivers
- Benchmarking and Cross-market Comparability
- Market Sizing, Forecasting, and Opportunity Mapping
- Research Design and Evidence Framework
- Desk Research Programme (Secondary Evidence)
- Expert Input and Fieldwork (Primary Evidence)
- Tooling, Models, and Reference Databases
- Data Engineering and Model Build
- Quality Assurance and Audit Trail
- Market Background
- Market Dynamics (Drivers, Restraints, Opportunity, Trends)
- Scenario Forecast (Optimistic, Likely, Conservative)
- Impact Analysis
- AI Impact
- Sustainability Impact
- Regulatory Impact
- Technology Impact
- Consumer / Buyer Analysis
- Purchase Drivers
- Adoption Barriers
- Buyer Journey
- Opportunity Map Analysis
- Product Life Cycle Analysis
- Supply Chain Analysis
- Investment Feasibility Matrix
- Value Chain Analysis
- PESTLE and Porter's Analysis
- Regulatory Landscape
- Regional Parent Market Outlook
- Production and Consumption Statistics
- Import and Export Statistics
- Global Market Analysis and Forecast, 2021 to 2036
- Historical Market Size Value (USD Billion) Analysis, 2021 to 2025
- Current and Future Market Size Value (USD Billion) Projections, 2026 to 2036
- Y-o-Y Growth Trend Analysis
- Absolute $ Opportunity Analysis
- Global Market Pricing Analysis, 2021 to 2036
- Global Market Analysis and Forecast, By Grade, 2021 to 2036
- Introduction / Key Findings
- Historical Market Size Value (USD Billion) Analysis By Grade, 2021 to 2025
- Current and Future Market Size Value (USD Billion) Analysis and Forecast By Grade, 2026 to 2036
- Smelter grade
- Calcined and reactive alumina
- Tabular and fused alumina
- Chemical and other non-metallurgical grades
- Y-o-Y Growth Trend Analysis By Grade, 2021 to 2025
- Absolute $ Opportunity Analysis By Grade, 2026 to 2036
- Global Market Analysis and Forecast, By Application, 2021 to 2036
- Introduction / Key Findings
- Historical Market Size Value (USD Billion) Analysis By Application, 2021 to 2025
- Current and Future Market Size Value (USD Billion) Analysis and Forecast By Application, 2026 to 2036
- Aluminium production
- Ceramics and refractories
- Abrasives and filtration
- Other industrial uses
- Y-o-Y Growth Trend Analysis By Application, 2021 to 2025
- Absolute $ Opportunity Analysis By Application, 2026 to 2036
- Global Market Analysis and Forecast, By Production Route, 2021 to 2036
- Introduction / Key Findings
- Historical Market Size Value (USD Billion) Analysis By Production Route, 2021 to 2025
- Current and Future Market Size Value (USD Billion) Analysis and Forecast By Production Route, 2026 to 2036
- Bayer process
- Sintering and combined routes
- Other routes
- Y-o-Y Growth Trend Analysis By Production Route, 2021 to 2025
- Absolute $ Opportunity Analysis By Production Route, 2026 to 2036
- Global Market Analysis and Forecast, By Region, 2021 to 2036
- Introduction
- Historical Market Size Value (USD Billion) Analysis By Region, 2021 to 2025
- Current Market Size Value (USD Billion) Analysis and Forecast By Region, 2026 to 2036
- North America
- Latin America
- Western Europe
- Eastern Europe
- East Asia
- South Asia and Pacific
- Middle East and Africa
- Market Attractiveness Analysis By Region
- North America Market Analysis and Forecast, By Country, 2021 to 2036
- Historical Market Size Value (USD Billion) Trend Analysis By Market Taxonomy, 2021 to 2025
- Market Size Value (USD Billion) Forecast By Market Taxonomy, 2026 to 2036
- By Country
- United States
- Canada
- By Grade
- By Application
- By Production Route
- By Country
- Market Attractiveness Analysis
- By Country
- By Grade
- By Application
- By Production Route
- Key Takeaways
- Latin America Market Analysis and Forecast, By Country
- Historical Market Size Value (USD Billion) Trend Analysis By Market Taxonomy, 2021 to 2025
- Market Size Value (USD Billion) Forecast By Market Taxonomy, 2026 to 2036
- By Country
- Brazil
- Mexico
- Argentina
- Chile
- By Grade
- By Application
- By Production Route
- By Country
- Market Attractiveness Analysis
- By Country
- By Grade
- By Application
- By Production Route
- Key Takeaways
- Western Europe Market Analysis and Forecast, By Country
- Historical Market Size Value (USD Billion) Trend Analysis By Market Taxonomy, 2021 to 2025
- Market Size Value (USD Billion) Forecast By Market Taxonomy, 2026 to 2036
- By Country
- Germany
- France
- United Kingdom
- Italy
- Spain
- Benelux
- Nordics
- By Grade
- By Application
- By Production Route
- By Country
- Market Attractiveness Analysis
- By Country
- By Grade
- By Application
- By Production Route
- Key Takeaways
- Eastern Europe Market Analysis and Forecast, By Country
- Historical Market Size Value (USD Billion) Trend Analysis By Market Taxonomy, 2021 to 2025
- Market Size Value (USD Billion) Forecast By Market Taxonomy, 2026 to 2036
- By Country
- Poland
- Czech Republic
- Romania
- Hungary
- By Grade
- By Application
- By Production Route
- By Country
- Market Attractiveness Analysis
- By Country
- By Grade
- By Application
- By Production Route
- Key Takeaways
- East Asia Market Analysis and Forecast, By Country
- Historical Market Size Value (USD Billion) Trend Analysis By Market Taxonomy, 2021 to 2025
- Market Size Value (USD Billion) Forecast By Market Taxonomy, 2026 to 2036
- By Country
- China
- Japan
- South Korea
- Taiwan
- By Grade
- By Application
- By Production Route
- By Country
- Market Attractiveness Analysis
- By Country
- By Grade
- By Application
- By Production Route
- Key Takeaways
- South Asia and Pacific Market Analysis and Forecast, By Country
- Historical Market Size Value (USD Billion) Trend Analysis By Market Taxonomy, 2021 to 2025
- Market Size Value (USD Billion) Forecast By Market Taxonomy, 2026 to 2036
- By Country
- India
- Singapore
- Other ASEAN countries
- Australia and New Zealand
- By Grade
- By Application
- By Production Route
- By Country
- Market Attractiveness Analysis
- By Country
- By Grade
- By Application
- By Production Route
- Key Takeaways
- Middle East and Africa Market Analysis and Forecast, By Country
- Historical Market Size Value (USD Billion) Trend Analysis By Market Taxonomy, 2021 to 2025
- Market Size Value (USD Billion) Forecast By Market Taxonomy, 2026 to 2036
- By Country
- GCC Countries
- South Africa
- Türkiye
- Israel
- By Grade
- By Application
- By Production Route
- By Country
- Market Attractiveness Analysis
- By Country
- By Grade
- By Application
- By Production Route
- Key Takeaways
- Key Countries Market Analysis
- United States
- Pricing Analysis
- Market Share Analysis, 2025
- By Grade
- By Application
- By Production Route
- Canada
- Pricing Analysis
- Market Share Analysis, 2025
- By Grade
- By Application
- By Production Route
- Mexico
- Pricing Analysis
- Market Share Analysis, 2025
- By Grade
- By Application
- By Production Route
- Brazil
- Pricing Analysis
- Market Share Analysis, 2025
- By Grade
- By Application
- By Production Route
- Chile
- Pricing Analysis
- Market Share Analysis, 2025
- By Grade
- By Application
- By Production Route
- Germany
- Pricing Analysis
- Market Share Analysis, 2025
- By Grade
- By Application
- By Production Route
- United Kingdom
- Pricing Analysis
- Market Share Analysis, 2025
- By Grade
- By Application
- By Production Route
- Italy
- Pricing Analysis
- Market Share Analysis, 2025
- By Grade
- By Application
- By Production Route
- Spain
- Pricing Analysis
- Market Share Analysis, 2025
- By Grade
- By Application
- By Production Route
- France
- Pricing Analysis
- Market Share Analysis, 2025
- By Grade
- By Application
- By Production Route
- India
- Pricing Analysis
- Market Share Analysis, 2025
- By Grade
- By Application
- By Production Route
- Australia and New Zealand
- Pricing Analysis
- Market Share Analysis, 2025
- By Grade
- By Application
- By Production Route
- China
- Pricing Analysis
- Market Share Analysis, 2025
- By Grade
- By Application
- By Production Route
- Japan
- Pricing Analysis
- Market Share Analysis, 2025
- By Grade
- By Application
- By Production Route
- South Korea
- Pricing Analysis
- Market Share Analysis, 2025
- By Grade
- By Application
- By Production Route
- Poland
- Pricing Analysis
- Market Share Analysis, 2025
- By Grade
- By Application
- By Production Route
- Hungary
- Pricing Analysis
- Market Share Analysis, 2025
- By Grade
- By Application
- By Production Route
- Türkiye
- Pricing Analysis
- Market Share Analysis, 2025
- By Grade
- By Application
- By Production Route
- South Africa
- Pricing Analysis
- Market Share Analysis, 2025
- By Grade
- By Application
- By Production Route
- United States
- Market Structure Analysis
- Competition Dashboard
- Competition Benchmarking
- Market Share Analysis of Top Players
- By Regional
- By Grade
- By Application
- By Production Route
- Emerging Startups
- Innovation Benchmarking
- Competition Analysis
- Competition Deep Dive
- Rio Tinto
- Overview
- Product Portfolio
- Profitability by Market Segments
- Sales Footprint
- Strategy Overview
- Marketing Strategy
- Product Strategy
- Channel Strategy
- Alcoa
- NALCO
- Almatis
- Hydro
- Chalco
- Rio Tinto
- Case Studies
- Success Stories
- Recent Developments
- Competition Deep Dive
- Assumptions & Acronyms Used
List of Tables
- Table 1: Global Market Value (USD Billion) Forecast by Region, 2021 to 2036
- Table 2: Global Market Value (USD Billion) Forecast by Grade, 2021 to 2036
- Table 3: Global Market Value (USD Billion) Forecast by Application, 2021 to 2036
- Table 4: Global Market Value (USD Billion) Forecast by Production Route, 2021 to 2036
- Table 5: North America Market Value (USD Billion) Forecast by Country, 2021 to 2036
- Table 6: North America Market Value (USD Billion) Forecast by Grade, 2021 to 2036
- Table 7: North America Market Value (USD Billion) Forecast by Application, 2021 to 2036
- Table 8: North America Market Value (USD Billion) Forecast by Production Route, 2021 to 2036
- Table 9: Latin America Market Value (USD Billion) Forecast by Country, 2021 to 2036
- Table 10: Latin America Market Value (USD Billion) Forecast by Grade, 2021 to 2036
- Table 11: Latin America Market Value (USD Billion) Forecast by Application, 2021 to 2036
- Table 12: Latin America Market Value (USD Billion) Forecast by Production Route, 2021 to 2036
- Table 13: Western Europe Market Value (USD Billion) Forecast by Country, 2021 to 2036
- Table 14: Western Europe Market Value (USD Billion) Forecast by Grade, 2021 to 2036
- Table 15: Western Europe Market Value (USD Billion) Forecast by Application, 2021 to 2036
- Table 16: Western Europe Market Value (USD Billion) Forecast by Production Route, 2021 to 2036
- Table 17: Eastern Europe Market Value (USD Billion) Forecast by Country, 2021 to 2036
- Table 18: Eastern Europe Market Value (USD Billion) Forecast by Grade, 2021 to 2036
- Table 19: Eastern Europe Market Value (USD Billion) Forecast by Application, 2021 to 2036
- Table 20: Eastern Europe Market Value (USD Billion) Forecast by Production Route, 2021 to 2036
- Table 21: East Asia Market Value (USD Billion) Forecast by Country, 2021 to 2036
- Table 22: East Asia Market Value (USD Billion) Forecast by Grade, 2021 to 2036
- Table 23: East Asia Market Value (USD Billion) Forecast by Application, 2021 to 2036
- Table 24: East Asia Market Value (USD Billion) Forecast by Production Route, 2021 to 2036
- Table 25: South Asia and Pacific Market Value (USD Billion) Forecast by Country, 2021 to 2036
- Table 26: South Asia and Pacific Market Value (USD Billion) Forecast by Grade, 2021 to 2036
- Table 27: South Asia and Pacific Market Value (USD Billion) Forecast by Application, 2021 to 2036
- Table 28: South Asia and Pacific Market Value (USD Billion) Forecast by Production Route, 2021 to 2036
- Table 29: Middle East and Africa Market Value (USD Billion) Forecast by Country, 2021 to 2036
- Table 30: Middle East and Africa Market Value (USD Billion) Forecast by Grade, 2021 to 2036
- Table 31: Middle East and Africa Market Value (USD Billion) Forecast by Application, 2021 to 2036
- Table 32: Middle East and Africa Market Value (USD Billion) Forecast by Production Route, 2021 to 2036
List of Figures
- Figure 1: Global Market Pricing Analysis
- Figure 2: Global Market Value (USD Billion) Forecast 2021-2036
- Figure 3: Global Market Value Share and BPS Analysis by Grade, 2026 and 2036
- Figure 4: Global Market Y-o-Y Growth Comparison by Grade, 2026-2036
- Figure 5: Global Market Attractiveness Analysis by Grade
- Figure 6: Global Market Value Share and BPS Analysis by Application, 2026 and 2036
- Figure 7: Global Market Y-o-Y Growth Comparison by Application, 2026-2036
- Figure 8: Global Market Attractiveness Analysis by Application
- Figure 9: Global Market Value Share and BPS Analysis by Production Route, 2026 and 2036
- Figure 10: Global Market Y-o-Y Growth Comparison by Production Route, 2026-2036
- Figure 11: Global Market Attractiveness Analysis by Production Route
- Figure 12: Global Market Value (USD Billion) Share and BPS Analysis by Region, 2026 and 2036
- Figure 13: Global Market Y-o-Y Growth Comparison by Region, 2026-2036
- Figure 14: Global Market Attractiveness Analysis by Region
- Figure 15: North America Market Incremental Dollar Opportunity, 2026-2036
- Figure 16: Latin America Market Incremental Dollar Opportunity, 2026-2036
- Figure 17: Western Europe Market Incremental Dollar Opportunity, 2026-2036
- Figure 18: Eastern Europe Market Incremental Dollar Opportunity, 2026-2036
- Figure 19: East Asia Market Incremental Dollar Opportunity, 2026-2036
- Figure 20: South Asia and Pacific Market Incremental Dollar Opportunity, 2026-2036
- Figure 21: Middle East and Africa Market Incremental Dollar Opportunity, 2026-2036
- Figure 22: North America Market Value Share and BPS Analysis by Country, 2026 and 2036
- Figure 23: North America Market Value Share and BPS Analysis by Grade, 2026 and 2036
- Figure 24: North America Market Y-o-Y Growth Comparison by Grade, 2026-2036
- Figure 25: North America Market Attractiveness Analysis by Grade
- Figure 26: North America Market Value Share and BPS Analysis by Application, 2026 and 2036
- Figure 27: North America Market Y-o-Y Growth Comparison by Application, 2026-2036
- Figure 28: North America Market Attractiveness Analysis by Application
- Figure 29: North America Market Value Share and BPS Analysis by Production Route, 2026 and 2036
- Figure 30: North America Market Y-o-Y Growth Comparison by Production Route, 2026-2036
- Figure 31: North America Market Attractiveness Analysis by Production Route
- Figure 32: Latin America Market Value Share and BPS Analysis by Country, 2026 and 2036
- Figure 33: Latin America Market Value Share and BPS Analysis by Grade, 2026 and 2036
- Figure 34: Latin America Market Y-o-Y Growth Comparison by Grade, 2026-2036
- Figure 35: Latin America Market Attractiveness Analysis by Grade
- Figure 36: Latin America Market Value Share and BPS Analysis by Application, 2026 and 2036
- Figure 37: Latin America Market Y-o-Y Growth Comparison by Application, 2026-2036
- Figure 38: Latin America Market Attractiveness Analysis by Application
- Figure 39: Latin America Market Value Share and BPS Analysis by Production Route, 2026 and 2036
- Figure 40: Latin America Market Y-o-Y Growth Comparison by Production Route, 2026-2036
- Figure 41: Latin America Market Attractiveness Analysis by Production Route
- Figure 42: Western Europe Market Value Share and BPS Analysis by Country, 2026 and 2036
- Figure 43: Western Europe Market Value Share and BPS Analysis by Grade, 2026 and 2036
- Figure 44: Western Europe Market Y-o-Y Growth Comparison by Grade, 2026-2036
- Figure 45: Western Europe Market Attractiveness Analysis by Grade
- Figure 46: Western Europe Market Value Share and BPS Analysis by Application, 2026 and 2036
- Figure 47: Western Europe Market Y-o-Y Growth Comparison by Application, 2026-2036
- Figure 48: Western Europe Market Attractiveness Analysis by Application
- Figure 49: Western Europe Market Value Share and BPS Analysis by Production Route, 2026 and 2036
- Figure 50: Western Europe Market Y-o-Y Growth Comparison by Production Route, 2026-2036
- Figure 51: Western Europe Market Attractiveness Analysis by Production Route
- Figure 52: Eastern Europe Market Value Share and BPS Analysis by Country, 2026 and 2036
- Figure 53: Eastern Europe Market Value Share and BPS Analysis by Grade, 2026 and 2036
- Figure 54: Eastern Europe Market Y-o-Y Growth Comparison by Grade, 2026-2036
- Figure 55: Eastern Europe Market Attractiveness Analysis by Grade
- Figure 56: Eastern Europe Market Value Share and BPS Analysis by Application, 2026 and 2036
- Figure 57: Eastern Europe Market Y-o-Y Growth Comparison by Application, 2026-2036
- Figure 58: Eastern Europe Market Attractiveness Analysis by Application
- Figure 59: Eastern Europe Market Value Share and BPS Analysis by Production Route, 2026 and 2036
- Figure 60: Eastern Europe Market Y-o-Y Growth Comparison by Production Route, 2026-2036
- Figure 61: Eastern Europe Market Attractiveness Analysis by Production Route
- Figure 62: East Asia Market Value Share and BPS Analysis by Country, 2026 and 2036
- Figure 63: East Asia Market Value Share and BPS Analysis by Grade, 2026 and 2036
- Figure 64: East Asia Market Y-o-Y Growth Comparison by Grade, 2026-2036
- Figure 65: East Asia Market Attractiveness Analysis by Grade
- Figure 66: East Asia Market Value Share and BPS Analysis by Application, 2026 and 2036
- Figure 67: East Asia Market Y-o-Y Growth Comparison by Application, 2026-2036
- Figure 68: East Asia Market Attractiveness Analysis by Application
- Figure 69: East Asia Market Value Share and BPS Analysis by Production Route, 2026 and 2036
- Figure 70: East Asia Market Y-o-Y Growth Comparison by Production Route, 2026-2036
- Figure 71: East Asia Market Attractiveness Analysis by Production Route
- Figure 72: South Asia and Pacific Market Value Share and BPS Analysis by Country, 2026 and 2036
- Figure 73: South Asia and Pacific Market Value Share and BPS Analysis by Grade, 2026 and 2036
- Figure 74: South Asia and Pacific Market Y-o-Y Growth Comparison by Grade, 2026-2036
- Figure 75: South Asia and Pacific Market Attractiveness Analysis by Grade
- Figure 76: South Asia and Pacific Market Value Share and BPS Analysis by Application, 2026 and 2036
- Figure 77: South Asia and Pacific Market Y-o-Y Growth Comparison by Application, 2026-2036
- Figure 78: South Asia and Pacific Market Attractiveness Analysis by Application
- Figure 79: South Asia and Pacific Market Value Share and BPS Analysis by Production Route, 2026 and 2036
- Figure 80: South Asia and Pacific Market Y-o-Y Growth Comparison by Production Route, 2026-2036
- Figure 81: South Asia and Pacific Market Attractiveness Analysis by Production Route
- Figure 82: Middle East and Africa Market Value Share and BPS Analysis by Country, 2026 and 2036
- Figure 83: Middle East and Africa Market Value Share and BPS Analysis by Grade, 2026 and 2036
- Figure 84: Middle East and Africa Market Y-o-Y Growth Comparison by Grade, 2026-2036
- Figure 85: Middle East and Africa Market Attractiveness Analysis by Grade
- Figure 86: Middle East and Africa Market Value Share and BPS Analysis by Application, 2026 and 2036
- Figure 87: Middle East and Africa Market Y-o-Y Growth Comparison by Application, 2026-2036
- Figure 88: Middle East and Africa Market Attractiveness Analysis by Application
- Figure 89: Middle East and Africa Market Value Share and BPS Analysis by Production Route, 2026 and 2036
- Figure 90: Middle East and Africa Market Y-o-Y Growth Comparison by Production Route, 2026-2036
- Figure 91: Middle East and Africa Market Attractiveness Analysis by Production Route
- Figure 92: Global Market - Tier Structure Analysis
- Figure 93: Global Market - Company Share Analysis
Frequently Asked Questions
What is the Alumina Market forecast?
The market is estimated at USD 52.98 billion in 2026, compared with USD 50.6 billion in 2025, and is forecast to reach USD 83.86 billion by 2036 at a 4.7% CAGR.
Which grade leads the Alumina Market?
Smelter grade holds 42.0% of the market by grade in 2026.
Which application and production route lead?
Aluminium production holds 61.0% by application. The Bayer process accounts for 96.0% by production route in FMI's 2026 assessment.
Which profiled country has the highest growth forecast?
China has the highest forecast CAGR at 6.3% from 2026 to 2036, followed by India at 5.9%.
Why does installed refinery capacity differ from available supply?
A refinery can be curtailed or face an operating constraint while retaining installed equipment. Alcoa's Kwinana closure followed curtailment, while Hydro's Alunorte reduction was linked to gas availability. [3][12]
Preview the report firsthand - request a free sample
Get SampleGet the brochure for pricing and purchase details.
Get PDF
