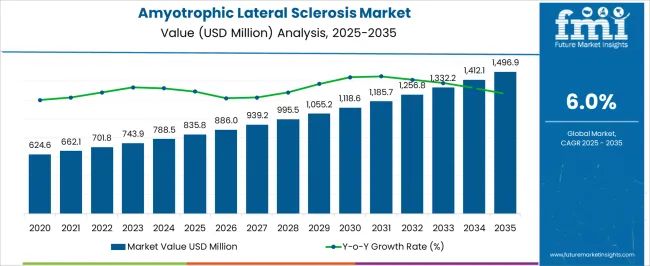
The Amyotrophic Lateral Sclerosis Market is estimated to be valued at USD 835.8 million in 2025 and is projected to reach USD 1496.9 million by 2035, registering a compound annual growth rate (CAGR) of 6.0% over the forecast period.

| Metric | Value |
|---|---|
| Amyotrophic Lateral Sclerosis Market Estimated Value in (2025 E) | USD 835.8 million |
| Amyotrophic Lateral Sclerosis Market Forecast Value in (2035 F) | USD 1496.9 million |
| Forecast CAGR (2025 to 2035) | 6.0% |
The amyotrophic lateral sclerosis market is progressing steadily as advancements in neurology, increasing disease awareness, and improved access to specialized care converge to shape its trajectory. Rising prevalence of neurodegenerative disorders and enhanced diagnostic capabilities have driven demand for effective treatments.
Innovations in therapeutic agents and supportive care measures are gradually improving patient quality of life and extending survival. Future growth is expected to be fueled by continued research into disease-modifying therapies, heightened healthcare investments, and improved reimbursement frameworks.
The focus on early intervention, multidisciplinary care models, and the introduction of novel drug formulations are paving the way for greater adoption and deeper market penetration in the coming years.
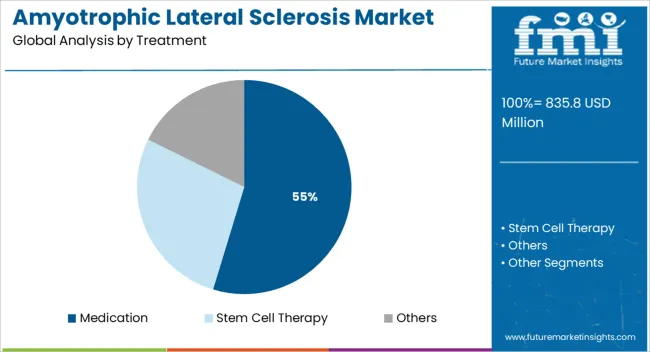
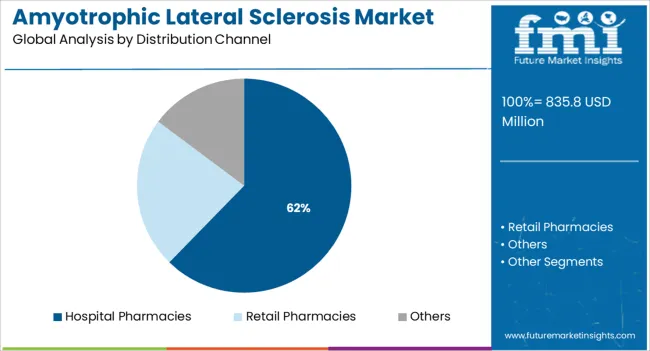
The market is segmented by Treatment and Distribution Channel and region. By Treatment, the market is divided into Medication, Stem Cell Therapy, and Others. In terms of Distribution Channel, the market is classified into Hospital Pharmacies, Retail Pharmacies, and Others. Regionally, the market is classified into North America, Latin America, Western Europe, Eastern Europe, Balkan & Baltic Countries, Russia & Belarus, Central Asia, East Asia, South Asia & Pacific, and the Middle East & Africa.

When segmented by treatment, medication is projected to hold 54.7% of the total market revenue in 2025, making it the leading treatment segment. This position has been reinforced by the clinical need for pharmacological interventions to manage symptoms and slow disease progression.
Medications have become the cornerstone of treatment due to their ability to improve motor function, reduce spasticity, and manage respiratory difficulties, which are critical in maintaining patient independence. Growing investment in drug development and regulatory approvals of new compounds have expanded therapeutic options, enhancing confidence in medication-based approaches.
Additionally, the familiarity of healthcare providers with pharmacological management and the ease of integrating medications into standard care protocols have solidified this segment’s leadership within the treatment landscape.

When segmented by distribution channel, hospital pharmacies are forecast to capture 62.3% of the market revenue in 2025, positioning themselves as the leading channel. This dominance has been attributed to the central role of hospitals in diagnosing and managing amyotrophic lateral sclerosis, where multidisciplinary teams coordinate care.
Hospital pharmacies have been preferred due to their capacity to handle specialized medications, ensure timely administration, and support complex dosing regimens. The close integration with neurology departments enables seamless monitoring of therapy and adjustment of treatment plans, which is essential in managing a progressive condition.
Furthermore, hospitals’ ability to provide comprehensive care and their alignment with reimbursement systems have strengthened their position as the primary point of access for ALS medications, sustaining their prominence in the distribution landscape.
According to market research and competitive intelligence provider Future Market Insights- the market for Amyotrophic Lateral Sclerosis reflected a value of 4% during the historical period, 2020 to 2025. National lockdown, government controls, and a spike in infection rates across countries all had a major financial impact on client engagement.
Amyotrophic lateral sclerosis, a progressive neurodegenerative disorder, damages nerve cells in the central nervous system responsible for controlling voluntary muscles. As per studies, around half of the people suffering from ALS may lose the ability to swallow, breathe, speak, walk, and use their hands. Thus, the market for Amyotrophic Lateral Sclerosis is expected to register a CAGR of 6% in the forecast period 2025 to 2035.
Increasing incidence of cancer to push the market growth
The increasing prevalence of amyotrophic lateral sclerosis disease is one of the biggest drivers of the market. According to the National Institute of Neurological Disorders and Stroke (NINDS), following gradual paralysis, patients with ALS often die from respiratory failure within 3-5 years. It also states that between the two types of ALS, the sporadic type is the most common form, accounting for 90- 95% of all cases in the USA while the familial type accounts for the rest.
In addition to this, an inclination of the population towards a stationary lifestyle and an increasing geriatric population has increased the demand for targeted and indicated treatment options, which are driving the global amyotrophic lateral sclerosis market.
Expensive Cost of Treatment to restrict Market Growth
The expensive treatment of Amyotrophic lateral sclerosis, less awareness of amyotrophic lateral sclerosis disease, and insubstantial treatment options are hampering the market growth.
Increased revenue generation propelling the growth of Amyotrophic Lateral Sclerosis in Asia Pacific
The Asia Pacific is expected to exhibit the fastest growth rate of all regions over the forecast period, with a CAGR of 5% during the forecast period.
The industry is witnessing increasing revenue generation in this region, especially in India and China. Major factors propelling the market growth in this region include growing Research and Development investment in the healthcare sector, plenty of unexplored opportunities, and promising initiatives by the manufacturers as well as the governments.
High Concentration of Key Players shaping the landscape for Amyotrophic Lateral Sclerosis in North America
North America is anticipated to acquire a market share of about 20% in the forecast period. This growth is attributable to the availability of recently developed immunosuppressants and the presence of a favorable reimbursement scenario across the USA.
It is estimated that the high healthcare expenditure along with the huge demand for ALS drugs, and established healthcare infrastructure are the factors driving the market. According to the data published in the Centers for Disease Control and Prevention (CDC) Morbidity and Mortality Weekly Report, in 2020 around 16,583 cases of amyotrophic lateral sclerosis were identified in the USA
Besides, the presence of a large number of significant pharmaceutical companies in the USA is set to bode well for the North American market. Thus, given the aforementioned factors, the market is expected to grow significantly over the forecast period in North America.
The superior efficiency of Stem cell therapy bolsters the growth
On the basis of treatment, the segment has been divided into medications, stem cell therapies, and others. Stem cell therapy is expected to show the highest CAGR owing to the increasing demand for new approaches and advanced treatment options. In addition to this, several initiatives have been taken by the government authoritative bodies and the Collaborative ALS Drug Discovery Initiative (CADDI) to fast-track the development of novel drugs and treatments.
Hospital pharmacies to drive market growth
The distribution channel segment has been divided into hospital pharmacies, retail pharmacies, and others. According to the FMI analysis, Hospital pharmacies account for the largest market share. The requirement for several hospital stays and visits during ALS treatment facilitates the growth of this segment.
Key start-up players in the Amyotrophic Lateral Sclerosis market are-
Key players in the Amyotrophic Lateral Sclerosis market are Mitsubishi Tanabe Pharma Corporation; Otsuka Pharmaceutical Co., Ltd.; BrainStorm Therapeutics; Biogen Inc.; Corestem; AB Science; F.Hoffmann-La Roche AG; Biohaven Pharmaceutical; Sun Pharmaceutical; and Ionis Pharmaceuticals, Inc.
| Report Attribute | Details |
|---|---|
| Market Value in 2025 | USD 835.8 million |
| Market Value in 2035 | USD 1496.9 million |
| Growth Rate | CAGR of 6% from 2025 to 2035 |
| Base Year for Estimation | 2025 |
| Historical Data | 2020 to 2025 |
| Forecast Period | 2025 to 2035 |
| Quantitative Units | Revenue in USD Million and CAGR from 2025 to 2035 |
| Report Coverage | Revenue Forecast, Volume Forecast, Company Ranking, Competitive Landscape, Growth Factors, Trends, and Pricing Analysis |
| Segments Covered | Treatment, Distribution Channel, Region |
| Regions Covered | North America; Latin America; Europe; Asia Pacific; Middle East and Africa (MEA) |
| Key Countries Profiled | USA, Canada, Brazil, Argentina, Germany, UK, France, Spain, Italy, Nordics, BENELUX, Australia & New Zealand, China, India, ASIAN, GCC Countries, South Africa |
| Key Companies Profiled | Mitsubishi Tanabe Pharma Corporation; Otsuka Pharmaceutical Co., Ltd.; BrainStorm Therapeutics; Biogen Inc.; Corestem; AB Science; F.Hoffmann-La Roche AG; Biohaven Pharmaceutical; Sun Pharmaceutical; Ionis Pharmaceuticals, Inc. |
| Customization | Available Upon Request |
The global amyotrophic lateral sclerosis market is estimated to be valued at USD 835.8 million in 2025.
The market size for the amyotrophic lateral sclerosis market is projected to reach USD 1,496.9 million by 2035.
The amyotrophic lateral sclerosis market is expected to grow at a 6.0% CAGR between 2025 and 2035.
The key product types in amyotrophic lateral sclerosis market are medication, stem cell therapy and others.
In terms of distribution channel, hospital pharmacies segment to command 62.3% share in the amyotrophic lateral sclerosis market in 2025.


Full Research Suite comprises of:
Market outlook & trends analysis
Interviews & case studies
Strategic recommendations
Vendor profiles & capabilities analysis
5-year forecasts
8 regions and 60+ country-level data splits
Market segment data splits
12 months of continuous data updates
DELIVERED AS:
PDF EXCEL ONLINE
Amyotrophic Lateral Sclerosis Gene Testing Market Size and Share Forecast Outlook 2025 to 2035
Lateral Flow Assay Component Market Size and Share Forecast Outlook 2025 to 2035
Lateral Flow Assays Market Analysis - Size, Share & Forecast 2025 to 2035
Unilateral Biportal Endoscopy Market Analysis – Size, Share & Forecast 2024-2034
Patient Lateral Transfer Market - Innovations, Demand & Forecast 2035
The Cryptococcal Antigen Lateral Flow Assay Test Market is segmented by Lateral Flow Readers and Kits and Reagents from 2025 to 2035
Atherosclerosis Market Analysis - Size, Share, and Forecast 2025 to 2035
Systemic Sclerosis Treatment Market - Trends & Forecast 2025 to 2035
Focal Segmental Glomerulosclerosis (FSGS) Therapeutics Market Analysis and Forecast by Disease Type, Drug Class, Treatment, and Region through 2035

Thank you!
You will receive an email from our Business Development Manager. Please be sure to check your SPAM/JUNK folder too.
Chat With
MaRIA