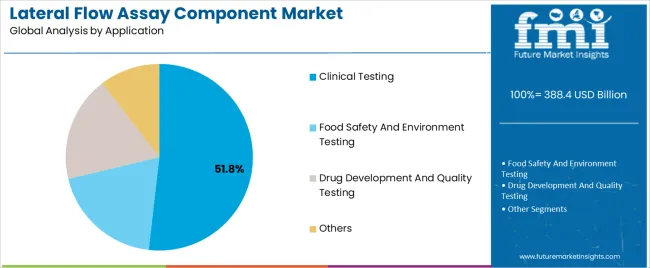
Lateral Flow Assay Component Market Outlook from 2024 to 2034

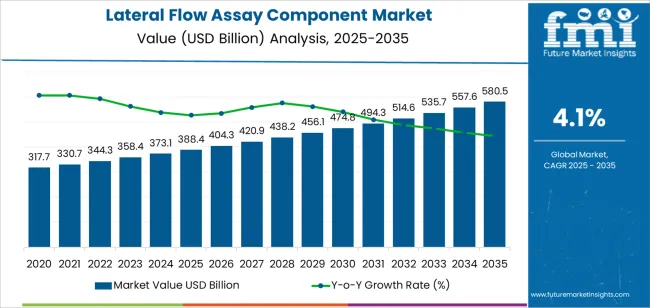
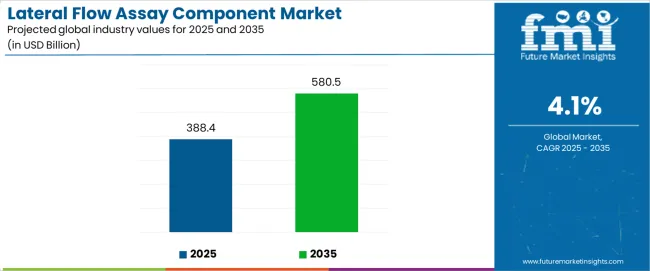
The lateral flow assay component market is projected to be worth US$ 373.1 million in 2024. The market is anticipated to reach US$ 558.0 million by 2034. The market is further expected to surge at a CAGR of 4.1% during the forecast period 2024 to 2034.

Attributes Key Insights
Lateral Flow Assay Component Market Estimated Size in 2024 US$ 373.1 million
Projected Market Value in 2034 US$ 558.0 million
Value-based CAGR from 2024 to 2034 4.1%

Don't pay for what you don't need

Customize your report by selecting specific countries or regions and save 30%!

Key Market Trends and Highlights

Increasing healthcare expenditure globally, particularly in emerging economies, is expected to drive the adoption of lateral flow assays for disease screening, monitoring, and management.

  • The growing trend towards home based and self testing solutions, driven by convenience and the need for decentralized healthcare, presents opportunities for the expansion of lateral flow assay components into the consumer market.
  • Collaborations between companies, academic institutions, and research organizations for the development of innovative lateral flow assay technologies and the expansion of product portfolios are expected to drive market growth through knowledge sharing and resource pooling.
  • The increasing prevalence of chronic diseases such as diabetes, cardiovascular diseases, and cancer necessitates the development of rapid diagnostic solutions for early detection and monitoring, driving the demand for lateral flow assay components tailored to these conditions.

2019 to 2023 Historical Analysis vs. 2024 to 2034 Market Forecast Projections

The scope for lateral flow assay component rose at a 5.6% CAGR between 2019 and 2023. The global market is anticipated to grow at a moderate CAGR of 4.1% over the forecast period 2024 to 2034.

There was a significant increase in the adoption of lateral flow assay components during the historical period, due to the rising demand for rapid diagnostic solutions, particularly in point of care settings where quick results are essential for effective patient management.

Advances in lateral flow assay technology, including improvements in sensitivity, specificity, and multiplexing capabilities, drove market growth by expanding the range of applications and enhancing the performance of diagnostic assays for various diseases and analytes.

The global burden of infectious diseases, including outbreaks such as Ebola, and Zika, fueled the demand for lateral flow assay components for the rapid detection and surveillance of pathogens, contributing to market expansion.

The identification of novel disease targets and biomarkers, driven by advances in genomics, proteomics, and molecular diagnostics, is expected to expand the application of lateral flow assay components for the detection of specific diseases, enabling personalized medicine and precision diagnostics.

Integration of lateral flow assays with digital health platforms, including smartphone applications, cloud based data analytics, and telemedicine solutions, will enhance accessibility, connectivity, and usability, driving market growth in remote and decentralized healthcare settings.

The growing trend towards home based and self testing solutions, fueled by consumer demand for convenience and accessibility, presents opportunities for the development of user friendly lateral flow assay components for home diagnostics, disease monitoring, and wellness management.

Sabyasachi Ghosh
Sabyasachi Ghosh

Principal Consultant

Talk to Analyst

Find your sweet spots for generating winning opportunities in this market.

Lateral Flow Assay Component Market Key Drivers

The rise in demand for rapid and accurate diagnostic solutions, especially in remote and resource limited settings, is fueling the growth of lateral flow assays as they provide quick results without the need for specialized equipment.

  • There is a higher demand for rapid diagnostic tests for diseases such as HIV, malaria, tuberculosis, with the increasing incidence of infectious diseases worldwide, which is driving the adoption of lateral flow assay components.
  • Ongoing advancements in lateral flow assay technologies, such as improvements in sensitivity, specificity, multiplexing capabilities, and integration with digital platforms, are enhancing the performance and usability of these assays, thus expanding their applications.
  • The growth of the biotechnology and pharmaceutical industries, coupled with increased investment in research and development activities, is driving the demand for lateral flow assay components for various applications including drug development, biomarker detection, and companion diagnostics.

Challenges in the Lateral Flow Assay Component Market

Despite advancements, lateral flow assays may have limitations in sensitivity and specificity compared to other diagnostic methods, which can affect their accuracy and reliability, thereby hindering widespread adoption, especially for certain applications requiring high analytical performance.

  • The availability of alternative diagnostic technologies, such as molecular diagnostics, immunoassays, and next generation sequencing, may pose a challenge to the growth of the lateral flow assay market, particularly in applications requiring higher sensitivity, multiplexing capabilities, and quantitative analysis.
  • Stringent regulatory requirements, evolving quality standards, and compliance issues related to assay performance, validation, and documentation may pose barriers to market entry, product development, and commercialization, especially for smaller companies and startups.
  • While lateral flow assays offer rapid and qualitative results, their limited multiplexing and quantitative capabilities may restrict their utility for complex diagnostic testing scenarios, such as simultaneous detection of multiple analytes or quantitative measurement of target concentrations.

Get the data you need at a Fraction of the cost

Personalize your report by choosing insights you need
and save 40%!

Country-wise Insights

The below table showcases revenues in terms of the top 5 leading countries, spearheaded by Japan and the United Kingdom. The countries are expected to lead the market through 2034.

Countries Forecast CAGRs from 2024 to 2034
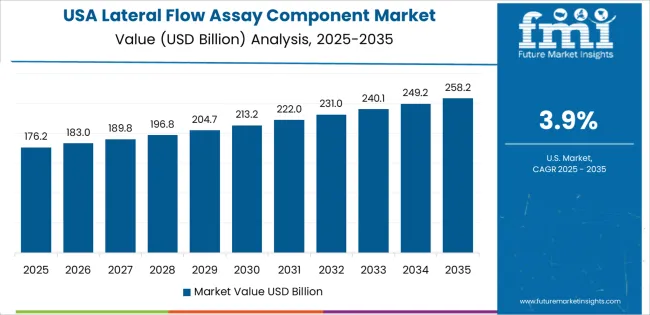
The United States 4.4%
The United Kingdom 5.0%
China 4.6%
Japan 5.5%
Korea 2.6%

Rising Demand for Point of Care Testing Driving the Market in the United States

The lateral flow assay component market in the United States expected to expand at a CAGR of 4.4% through 2034. The increasing demand for rapid and decentralized diagnostic solutions, driven by factors such as the need for timely disease diagnosis, convenience, and cost effectiveness, fuels the adoption of lateral flow assays in the United States. POCT applications in clinics, pharmacies, and home healthcare settings contribute to market growth.

The high prevalence of chronic diseases such as diabetes, cardiovascular diseases, and infectious diseases including influenza, and sexually transmitted infections drives the demand for rapid diagnostic tests based on lateral flow assay components. The need for timely disease detection and management supports market growth.

Supportive Regulatory Environment to Accelerate Market Growth in the United Kingdom

The lateral flow assay component market in the United Kingdom is anticipated to expand at a CAGR of 5.0% through 2034. The regulatory framework in the United Kingdom supports the development, validation, and commercialization of lateral flow assays for clinical and research applications. Regulatory agencies provide guidelines and pathways for assay approval, fostering market confidence and adoption.

Ongoing advancements in lateral flow assay technologies, including improvements in sensitivity, specificity, multiplexing capabilities, and integration with digital platforms, stimulate market growth by expanding applications in clinical diagnostics, food safety, environmental monitoring, and veterinary diagnostics.

Increasing Disposable Income and Healthcare Spending Spearhead the Market in China

Lateral flow assay component trends in China are taking a turn for the better. A 4.6% CAGR is forecast for the country from 2024 to 2034. Rising disposable income levels and increased healthcare spending in China contribute to the demand for advanced diagnostic technologies and healthcare services.

The growing middle class seeks better healthcare services, including accurate and reliable diagnostic tests, driving the growth of the lateral flow assay component market.

China has faced several outbreaks of infectious diseases in recent years, including SARS, and avian influenza. The outbreaks highlight the importance of rapid diagnostic tests for early detection, containment, and response efforts, driving the demand for lateral flow assays in epidemic control and public health surveillance.
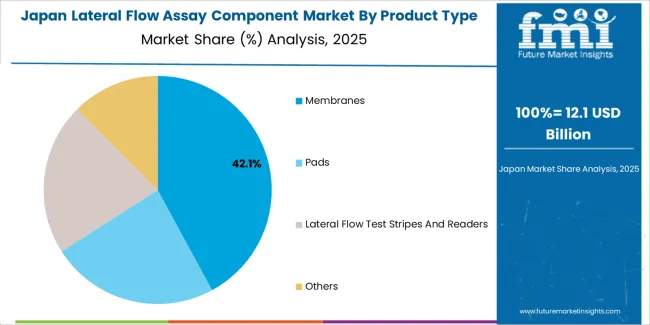
Expansion of Telemedicine and Home Healthcare Fueling the Market in Japan

The lateral flow assay component market in Japan is poised to expand at a CAGR of 5.5% through 2034. The expansion of telemedicine services and home healthcare initiatives in Japan, driven by factors such as an aging population, technological advancements, and healthcare reforms, creates opportunities for the integration of lateral flow assays into remote diagnostic and monitoring platforms, driving market expansion.

Japan places a strong emphasis on public health preparedness and disease surveillance, especially in response to infectious disease outbreaks and natural disasters. Lateral flow assays play a critical role in rapid response and containment efforts, contributing to market growth in Japan.
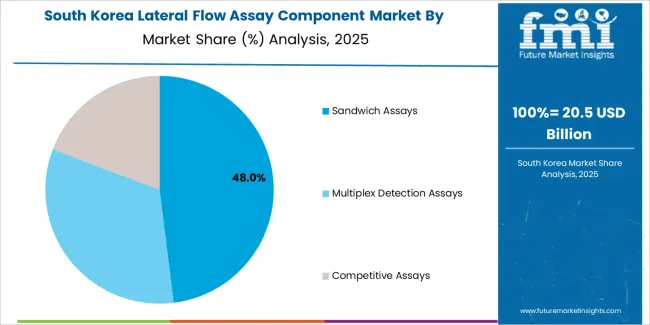
Rising Demand for Food Safety Testing Driving the Demand in Korea

The lateral flow assay component market in Korea is anticipated to expand at a CAGR of 2.6% through 2034. Korea has stringent regulations and standards for food safety, driven by consumer concerns and government initiatives to ensure the quality and safety of food products.

Lateral flow assays are used in food safety testing for the rapid detection of contaminants, pathogens, and allergens, supporting market growth in the food industry.

There is a growing interest in personalized medicine and precision healthcare in Korea, driven by advancements in genomics, biomarker discovery, and targeted therapies. Lateral flow assays play a role in personalized medicine by enabling the detection of specific biomarkers for disease diagnosis, prognosis, and treatment response prediction, driving market growth in personalized healthcare applications.

Category-wise Insights

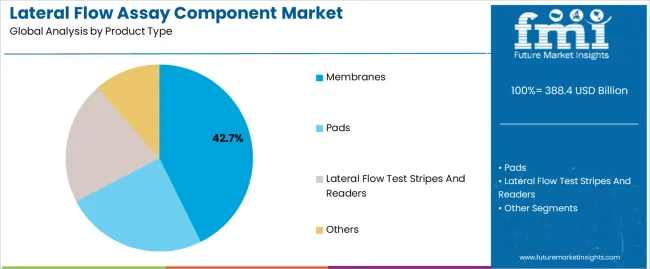
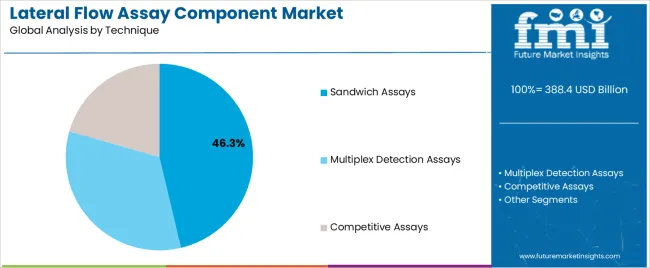
The below table highlights how pads segment is projected to lead the market in terms of product type, and is expected to account for a CAGR of 3.9% through 2034. Based on technique, the sandwich assays segment is expected to account for a CAGR of 3.8% through 2034.

Category CAGR through 2034
Pads 3.9%
Sandwich Assays 3.8%

Pads Claim High Demand for Lateral Flow Assay Component

Based on product type, the pads segment is expected to continue dominating the lateral flow assay component market. Pads are a fundamental component of lateral flow assays, serving as the platform for sample application, reagent dispersion, and analyte detection. The essential role of pads in assay design and performance drives continuous demand for high quality pads in lateral flow assay manufacturing.

Ongoing advancements in material science and engineering enable the development of innovative pad materials with enhanced properties, including uniformity, porosity, wettability, and fluid control. The advancements contribute to improved assay sensitivity, reproducibility, and performance, driving market growth for pads.

Sandwich Assays Segment to Hold High Demand for Lateral Flow Assay Component

In terms of technique, the sandwich assays segment is expected to continue dominating the lateral flow assay component market, attributed to several key factors.

Sandwich assays offer enhanced sensitivity and specificity compared to other assay formats, making them ideal for the detection of low abundance analytes and complex samples. The ability of sandwich assays to capture and detect target molecules with high affinity and selectivity drives their adoption in various diagnostic and research applications.

Sandwich assays support multiplexing capabilities, enabling the simultaneous detection of multiple analytes within a single test device. The versatility of sandwich assays in accommodating multiple capture and detection reagents facilitates the development of multiplex lateral flow assays for comprehensive profiling and analysis of complex samples, driving market demand.
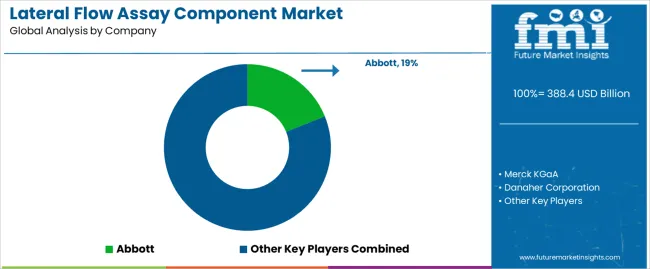
Competitive Landscape

The competitive landscape of the lateral flow assay component market is dynamic and characterized by intense competition among key players, niche manufacturers, and emerging startups.

The market encompasses a wide range of components and technologies used in lateral flow assays, including membranes, pads, labels, conjugates, and substrates, catering to diverse applications in clinical diagnostics, food safety, veterinary diagnostics, environmental testing, and pharmaceutical research.

Company Portfolio

  • Merck KGaA is a leading global supplier of lateral flow assay components, offering a comprehensive portfolio of membranes, pads, conjugates, and other critical components. The expertise of the company in membrane manufacturing and assay development positions it as a key player in the market.
  • Bio-Rad Laboratories, Inc. is a prominent player in the lateral flow assay market, offering a range of components and kits for rapid diagnostic testing applications. The innovative technologies and strong market presence of the company contribute to its competitive position in the industry.

Key Coverage in the Lateral Flow Assay Component Industry Report

  • Lateral Flow Assay Components
  • Rapid Diagnostic Testing Components
  • Lateral Flow Assay Materials
  • Membranes for Lateral Flow Assays
  • Antibodies for Lateral Flow Tests
  • Conjugates and Labels for Assay Development
  • Substrates for Lateral Flow Devices
  • Point-of-Care Testing Components
  • Clinical Diagnostics Reagents
  • Immunoassay Components
  • Biomarker Detection Materials
  • Food Safety Testing Components
  • Environmental Monitoring Reagents
  • Veterinary Diagnostics Materials
  • Infectious Disease Assay Components
  • Innovative Assay Development Solutions
  • High-Quality Lateral Flow Assay Supplies
  • Customizable Assay Component Solutions
  • Cutting-Edge Assay Development Technologies
  • Regulatory-Compliant Assay Components
  • Point-of-Care Testing Market
  • In Vitro Diagnostics Market
  • Clinical Diagnostics Market
  • Biotechnology Market
  • Molecular Diagnostics Market
  • Immunoassay Market
  • Point-of-Need Diagnostics Market

Report Scope

Attribute Details
Estimated Market Size in 2024 US$ 373.1 million
Projected Market Valuation in 2034 US$ 558.0 million
Value-based CAGR 2024 to 2034 4.1%
Forecast Period 2024 to 2034
Historical Data Available for 2019 to 2023
Market Analysis Value in US$ million
Key Regions Covered
  • North America
  • Latin America
  • Western Europe
  • Eastern Europe
  • South Asia and Pacific
  • East Asia
  • The Middle East & Africa
Key Market Segments Covered
  • Product Type
  • Technique
  • Application
  • End User
  • Region
Key Countries Profiled
  • The United States
  • Canada
  • Brazil
  • Mexico
  • Germany
  • France
  • France
  • Spain
  • Italy
  • Russia
  • Poland
  • Czech Republic
  • Romania
  • India
  • Bangladesh
  • Australia
  • New Zealand
  • China
  • Japan
  • South Korea
  • GCC countries
  • South Africa
  • Israel
Key Companies Profiled
  • Merck KGaA
  • Danaher Corporation
  • Sartorius Stedim Biotech
  • Abbott
  • Advanced Microdevice Pvt. Ltd
  • Ahlstrom-Munksjö
  • Nupore Filtration
  • DCN Diagnostics
  • Ballya Bio
  • PerkinElmer Inc.

Segmentation Analysis of the Lateral Flow Assay Component Market

By Product Type:

  • Pads
  • Membranes
  • Lateral Flow Test Stripes and Readers
  • Others

By Technique:

  • Sandwich Assays
  • Multiplex Detection Assays
  • Competitive Assays

By Application:

  • Clinical Testing
  • Food Safety and Environment Testing
  • Drug Development and Quality Testing
  • Others

By End User:

  • Medical Device Manufacturing Companies
  • Medical Device Contract Manufacturing Companies
  • Others

By Region:

  • North America
  • Latin America
  • Western Europe
  • Eastern Europe
  • South Asia and Pacific
  • East Asia
  • The Middle East and Africa

Frequently Asked Questions

What is the anticipated value of the Lateral Flow Assay Component market in 2024?

The lateral flow assay component market is projected to reach a valuation of US$ 373.1 million in 2024.

What is the expected CAGR for the Lateral Flow Assay Component market until 2034?

The lateral flow assay component industry is set to expand by a CAGR of 4.1% through 2034.

How much valuation is projected for the Lateral Flow Assay Component market in 2034?

The lateral flow assay component market is forecast to reach US$ 558.0 million by 2034.

Which country is projected to lead the Lateral Flow Assay Component market?

Korea is expected to be the top performing market, exhibiting a CAGR of 5.5% through 2034.

Which is the dominant product type in the Lateral Flow Assay Component domain?

Pads segment is preferred, and is expected to account for a share of 3.9% in 2024.

Table of Content
1. Executive Summary
    1.1. Global Market Outlook
    1.2. Demand-side Trends
    1.3. Supply-side Trends
    1.4. Technology Roadmap Analysis
    1.5. Analysis and Recommendations
2. Market Overview
    2.1. Market Coverage / Taxonomy
    2.2. Market Definition / Scope / Limitations
3. Market Background
    3.1. Market Dynamics
        3.1.1. Drivers
        3.1.2. Restraints
        3.1.3. Opportunity
        3.1.4. Trends
    3.2. Scenario Forecast
        3.2.1. Demand in Optimistic Scenario
        3.2.2. Demand in Likely Scenario
        3.2.3. Demand in Conservative Scenario
    3.3. Opportunity Map Analysis
    3.4. Investment Feasibility Matrix
    3.5. PESTLE and Porter’s Analysis
    3.6. Regulatory Landscape
        3.6.1. By Key Regions
        3.6.2. By Key Countries
    3.7. Regional Parent Market Outlook
4. Global Market Analysis 2019 to 2023 and Forecast, 2024 to 2034
    4.1. Historical Market Size Value (US$ Million) Analysis, 2019 to 2023
    4.2. Current and Future Market Size Value (US$ Million) Projections, 2024 to 2034
        4.2.1. Y-o-Y Growth Trend Analysis
        4.2.2. Absolute $ Opportunity Analysis
5. Global Market Analysis 2019 to 2023 and Forecast 2024 to 2034, By Product Type
    5.1. Introduction / Key Findings
    5.2. Historical Market Size Value (US$ Million) Analysis By Product Type, 2019 to 2023
    5.3. Current and Future Market Size Value (US$ Million) Analysis and Forecast By Product Type, 2024 to 2034
        5.3.1. Pads
        5.3.2. Membranes
        5.3.3. Lateral Flow Test Strips & Readers
        5.3.4. Others
    5.4. Y-o-Y Growth Trend Analysis By Product Type, 2019 to 2023
    5.5. Absolute $ Opportunity Analysis By Product Type, 2024 to 2034
6. Global Market Analysis 2019 to 2023 and Forecast 2024 to 2034, By Technique
    6.1. Introduction / Key Findings
    6.2. Historical Market Size Value (US$ Million) Analysis By Technique, 2019 to 2023
    6.3. Current and Future Market Size Value (US$ Million) Analysis and Forecast By Technique, 2024 to 2034
        6.3.1. Sandwich Assays
        6.3.2. Multiplex Detection Assays
        6.3.3. Competitive Assays
    6.4. Y-o-Y Growth Trend Analysis By Technique, 2019 to 2023
    6.5. Absolute $ Opportunity Analysis By Technique, 2024 to 2034
7. Global Market Analysis 2019 to 2023 and Forecast 2024 to 2034, By Application
    7.1. Introduction / Key Findings
    7.2. Historical Market Size Value (US$ Million) Analysis By Application, 2019 to 2023
    7.3. Current and Future Market Size Value (US$ Million) Analysis and Forecast By Application, 2024 to 2034
        7.3.1. Clinical Testing
        7.3.2. Food Safety & Environmental Testing
        7.3.3. Drug Development & Quality Testing
        7.3.4. Others
    7.4. Y-o-Y Growth Trend Analysis By Application, 2019 to 2023
    7.5. Absolute $ Opportunity Analysis By Application, 2024 to 2034
8. Global Market Analysis 2019 to 2023 and Forecast 2024 to 2034, By End User
    8.1. Introduction / Key Findings
    8.2. Historical Market Size Value (US$ Million) Analysis By End User, 2019 to 2023
    8.3. Current and Future Market Size Value (US$ Million) Analysis and Forecast By End User, 2024 to 2034
        8.3.1. Medical Device Manufacturing Companies
        8.3.2. Medical Device Contract Manufacturing Companies
        8.3.3. Others
    8.4. Y-o-Y Growth Trend Analysis By End User, 2019 to 2023
    8.5. Absolute $ Opportunity Analysis By End User, 2024 to 2034
9. Global Market Analysis 2019 to 2023 and Forecast 2024 to 2034, By Region
    9.1. Introduction
    9.2. Historical Market Size Value (US$ Million) Analysis By Region, 2019 to 2023
    9.3. Current Market Size Value (US$ Million) Analysis and Forecast By Region, 2024 to 2034
        9.3.1. North America
        9.3.2. Latin America
        9.3.3. Western Europe
        9.3.4. Eastern Europe
        9.3.5. South Asia and Pacific
        9.3.6. East Asia
        9.3.7. Middle East and Africa
    9.4. Market Attractiveness Analysis By Region
10. North America Market Analysis 2019 to 2023 and Forecast 2024 to 2034, By Country
    10.1. Historical Market Size Value (US$ Million) Trend Analysis By Market Taxonomy, 2019 to 2023
    10.2. Market Size Value (US$ Million) Forecast By Market Taxonomy, 2024 to 2034
        10.2.1. By Country
            10.2.1.1. USA
            10.2.1.2. Canada
        10.2.2. By Product Type
        10.2.3. By Technique
        10.2.4. By Application
        10.2.5. By End User
    10.3. Market Attractiveness Analysis
        10.3.1. By Country
        10.3.2. By Product Type
        10.3.3. By Technique
        10.3.4. By Application
        10.3.5. By End User
    10.4. Key Takeaways
11. Latin America Market Analysis 2019 to 2023 and Forecast 2024 to 2034, By Country
    11.1. Historical Market Size Value (US$ Million) Trend Analysis By Market Taxonomy, 2019 to 2023
    11.2. Market Size Value (US$ Million) Forecast By Market Taxonomy, 2024 to 2034
        11.2.1. By Country
            11.2.1.1. Brazil
            11.2.1.2. Mexico
            11.2.1.3. Rest of Latin America
        11.2.2. By Product Type
        11.2.3. By Technique
        11.2.4. By Application
        11.2.5. By End User
    11.3. Market Attractiveness Analysis
        11.3.1. By Country
        11.3.2. By Product Type
        11.3.3. By Technique
        11.3.4. By Application
        11.3.5. By End User
    11.4. Key Takeaways
12. Western Europe Market Analysis 2019 to 2023 and Forecast 2024 to 2034, By Country
    12.1. Historical Market Size Value (US$ Million) Trend Analysis By Market Taxonomy, 2019 to 2023
    12.2. Market Size Value (US$ Million) Forecast By Market Taxonomy, 2024 to 2034
        12.2.1. By Country
            12.2.1.1. Germany
            12.2.1.2. UK
            12.2.1.3. France
            12.2.1.4. Spain
            12.2.1.5. Italy
            12.2.1.6. Rest of Western Europe
        12.2.2. By Product Type
        12.2.3. By Technique
        12.2.4. By Application
        12.2.5. By End User
    12.3. Market Attractiveness Analysis
        12.3.1. By Country
        12.3.2. By Product Type
        12.3.3. By Technique
        12.3.4. By Application
        12.3.5. By End User
    12.4. Key Takeaways
13. Eastern Europe Market Analysis 2019 to 2023 and Forecast 2024 to 2034, By Country
    13.1. Historical Market Size Value (US$ Million) Trend Analysis By Market Taxonomy, 2019 to 2023
    13.2. Market Size Value (US$ Million) Forecast By Market Taxonomy, 2024 to 2034
        13.2.1. By Country
            13.2.1.1. Poland
            13.2.1.2. Russia
            13.2.1.3. Czech Republic
            13.2.1.4. Romania
            13.2.1.5. Rest of Eastern Europe
        13.2.2. By Product Type
        13.2.3. By Technique
        13.2.4. By Application
        13.2.5. By End User
    13.3. Market Attractiveness Analysis
        13.3.1. By Country
        13.3.2. By Product Type
        13.3.3. By Technique
        13.3.4. By Application
        13.3.5. By End User
    13.4. Key Takeaways
14. South Asia and Pacific Market Analysis 2019 to 2023 and Forecast 2024 to 2034, By Country
    14.1. Historical Market Size Value (US$ Million) Trend Analysis By Market Taxonomy, 2019 to 2023
    14.2. Market Size Value (US$ Million) Forecast By Market Taxonomy, 2024 to 2034
        14.2.1. By Country
            14.2.1.1. India
            14.2.1.2. Bangladesh
            14.2.1.3. Australia
            14.2.1.4. New Zealand
            14.2.1.5. Rest of South Asia and Pacific
        14.2.2. By Product Type
        14.2.3. By Technique
        14.2.4. By Application
        14.2.5. By End User
    14.3. Market Attractiveness Analysis
        14.3.1. By Country
        14.3.2. By Product Type
        14.3.3. By Technique
        14.3.4. By Application
        14.3.5. By End User
    14.4. Key Takeaways
15. East Asia Market Analysis 2019 to 2023 and Forecast 2024 to 2034, By Country
    15.1. Historical Market Size Value (US$ Million) Trend Analysis By Market Taxonomy, 2019 to 2023
    15.2. Market Size Value (US$ Million) Forecast By Market Taxonomy, 2024 to 2034
        15.2.1. By Country
            15.2.1.1. China
            15.2.1.2. Japan
            15.2.1.3. South Korea
        15.2.2. By Product Type
        15.2.3. By Technique
        15.2.4. By Application
        15.2.5. By End User
    15.3. Market Attractiveness Analysis
        15.3.1. By Country
        15.3.2. By Product Type
        15.3.3. By Technique
        15.3.4. By Application
        15.3.5. By End User
    15.4. Key Takeaways
16. Middle East and Africa Market Analysis 2019 to 2023 and Forecast 2024 to 2034, By Country
    16.1. Historical Market Size Value (US$ Million) Trend Analysis By Market Taxonomy, 2019 to 2023
    16.2. Market Size Value (US$ Million) Forecast By Market Taxonomy, 2024 to 2034
        16.2.1. By Country
            16.2.1.1. GCC Countries
            16.2.1.2. South Africa
            16.2.1.3. Israel
            16.2.1.4. Rest of MEA
        16.2.2. By Product Type
        16.2.3. By Technique
        16.2.4. By Application
        16.2.5. By End User
    16.3. Market Attractiveness Analysis
        16.3.1. By Country
        16.3.2. By Product Type
        16.3.3. By Technique
        16.3.4. By Application
        16.3.5. By End User
    16.4. Key Takeaways
17. Key Countries Market Analysis
    17.1. USA
        17.1.1. Pricing Analysis
        17.1.2. Market Share Analysis, 2023
            17.1.2.1. By Product Type
            17.1.2.2. By Technique
            17.1.2.3. By Application
            17.1.2.4. By End User
    17.2. Canada
        17.2.1. Pricing Analysis
        17.2.2. Market Share Analysis, 2023
            17.2.2.1. By Product Type
            17.2.2.2. By Technique
            17.2.2.3. By Application
            17.2.2.4. By End User
    17.3. Brazil
        17.3.1. Pricing Analysis
        17.3.2. Market Share Analysis, 2023
            17.3.2.1. By Product Type
            17.3.2.2. By Technique
            17.3.2.3. By Application
            17.3.2.4. By End User
    17.4. Mexico
        17.4.1. Pricing Analysis
        17.4.2. Market Share Analysis, 2023
            17.4.2.1. By Product Type
            17.4.2.2. By Technique
            17.4.2.3. By Application
            17.4.2.4. By End User
    17.5. Germany
        17.5.1. Pricing Analysis
        17.5.2. Market Share Analysis, 2023
            17.5.2.1. By Product Type
            17.5.2.2. By Technique
            17.5.2.3. By Application
            17.5.2.4. By End User
    17.6. UK
        17.6.1. Pricing Analysis
        17.6.2. Market Share Analysis, 2023
            17.6.2.1. By Product Type
            17.6.2.2. By Technique
            17.6.2.3. By Application
            17.6.2.4. By End User
    17.7. France
        17.7.1. Pricing Analysis
        17.7.2. Market Share Analysis, 2023
            17.7.2.1. By Product Type
            17.7.2.2. By Technique
            17.7.2.3. By Application
            17.7.2.4. By End User
    17.8. Spain
        17.8.1. Pricing Analysis
        17.8.2. Market Share Analysis, 2023
            17.8.2.1. By Product Type
            17.8.2.2. By Technique
            17.8.2.3. By Application
            17.8.2.4. By End User
    17.9. Italy
        17.9.1. Pricing Analysis
        17.9.2. Market Share Analysis, 2023
            17.9.2.1. By Product Type
            17.9.2.2. By Technique
            17.9.2.3. By Application
            17.9.2.4. By End User
    17.10. Poland
        17.10.1. Pricing Analysis
        17.10.2. Market Share Analysis, 2023
            17.10.2.1. By Product Type
            17.10.2.2. By Technique
            17.10.2.3. By Application
            17.10.2.4. By End User
    17.11. Russia
        17.11.1. Pricing Analysis
        17.11.2. Market Share Analysis, 2023
            17.11.2.1. By Product Type
            17.11.2.2. By Technique
            17.11.2.3. By Application
            17.11.2.4. By End User
    17.12. Czech Republic
        17.12.1. Pricing Analysis
        17.12.2. Market Share Analysis, 2023
            17.12.2.1. By Product Type
            17.12.2.2. By Technique
            17.12.2.3. By Application
            17.12.2.4. By End User
    17.13. Romania
        17.13.1. Pricing Analysis
        17.13.2. Market Share Analysis, 2023
            17.13.2.1. By Product Type
            17.13.2.2. By Technique
            17.13.2.3. By Application
            17.13.2.4. By End User
    17.14. India
        17.14.1. Pricing Analysis
        17.14.2. Market Share Analysis, 2023
            17.14.2.1. By Product Type
            17.14.2.2. By Technique
            17.14.2.3. By Application
            17.14.2.4. By End User
    17.15. Bangladesh
        17.15.1. Pricing Analysis
        17.15.2. Market Share Analysis, 2023
            17.15.2.1. By Product Type
            17.15.2.2. By Technique
            17.15.2.3. By Application
            17.15.2.4. By End User
    17.16. Australia
        17.16.1. Pricing Analysis
        17.16.2. Market Share Analysis, 2023
            17.16.2.1. By Product Type
            17.16.2.2. By Technique
            17.16.2.3. By Application
            17.16.2.4. By End User
    17.17. New Zealand
        17.17.1. Pricing Analysis
        17.17.2. Market Share Analysis, 2023
            17.17.2.1. By Product Type
            17.17.2.2. By Technique
            17.17.2.3. By Application
            17.17.2.4. By End User
    17.18. China
        17.18.1. Pricing Analysis
        17.18.2. Market Share Analysis, 2023
            17.18.2.1. By Product Type
            17.18.2.2. By Technique
            17.18.2.3. By Application
            17.18.2.4. By End User
    17.19. Japan
        17.19.1. Pricing Analysis
        17.19.2. Market Share Analysis, 2023
            17.19.2.1. By Product Type
            17.19.2.2. By Technique
            17.19.2.3. By Application
            17.19.2.4. By End User
    17.20. South Korea
        17.20.1. Pricing Analysis
        17.20.2. Market Share Analysis, 2023
            17.20.2.1. By Product Type
            17.20.2.2. By Technique
            17.20.2.3. By Application
            17.20.2.4. By End User
    17.21. GCC Countries
        17.21.1. Pricing Analysis
        17.21.2. Market Share Analysis, 2023
            17.21.2.1. By Product Type
            17.21.2.2. By Technique
            17.21.2.3. By Application
            17.21.2.4. By End User
    17.22. South Africa
        17.22.1. Pricing Analysis
        17.22.2. Market Share Analysis, 2023
            17.22.2.1. By Product Type
            17.22.2.2. By Technique
            17.22.2.3. By Application
            17.22.2.4. By End User
    17.23. Israel
        17.23.1. Pricing Analysis
        17.23.2. Market Share Analysis, 2023
            17.23.2.1. By Product Type
            17.23.2.2. By Technique
            17.23.2.3. By Application
            17.23.2.4. By End User
18. Market Structure Analysis
    18.1. Competition Dashboard
    18.2. Competition Benchmarking
    18.3. Market Share Analysis of Top Players
        18.3.1. By Regional
        18.3.2. By Product Type
        18.3.3. By Technique
        18.3.4. By Application
        18.3.5. By End User
19. Competition Analysis
    19.1. Competition Deep Dive
        19.1.1. Merck KGaA
            19.1.1.1. Overview
            19.1.1.2. Product Portfolio
            19.1.1.3. Profitability by Market Segments
            19.1.1.4. Sales Footprint
            19.1.1.5. Strategy Overview
                19.1.1.5.1. Marketing Strategy
        19.1.2. Danaher Corporation
            19.1.2.1. Overview
            19.1.2.2. Product Portfolio
            19.1.2.3. Profitability by Market Segments
            19.1.2.4. Sales Footprint
            19.1.2.5. Strategy Overview
                19.1.2.5.1. Marketing Strategy
        19.1.3. Sartorius Stedim Biotech
            19.1.3.1. Overview
            19.1.3.2. Product Portfolio
            19.1.3.3. Profitability by Market Segments
            19.1.3.4. Sales Footprint
            19.1.3.5. Strategy Overview
                19.1.3.5.1. Marketing Strategy
        19.1.4. Abbott
            19.1.4.1. Overview
            19.1.4.2. Product Portfolio
            19.1.4.3. Profitability by Market Segments
            19.1.4.4. Sales Footprint
            19.1.4.5. Strategy Overview
                19.1.4.5.1. Marketing Strategy
        19.1.5. Advanced Microdevice Pvt. Ltd
            19.1.5.1. Overview
            19.1.5.2. Product Portfolio
            19.1.5.3. Profitability by Market Segments
            19.1.5.4. Sales Footprint
            19.1.5.5. Strategy Overview
                19.1.5.5.1. Marketing Strategy
        19.1.6. Ahlstrom-Munksjö.
            19.1.6.1. Overview
            19.1.6.2. Product Portfolio
            19.1.6.3. Profitability by Market Segments
            19.1.6.4. Sales Footprint
            19.1.6.5. Strategy Overview
                19.1.6.5.1. Marketing Strategy
        19.1.7. Nupore Filtration
            19.1.7.1. Overview
            19.1.7.2. Product Portfolio
            19.1.7.3. Profitability by Market Segments
            19.1.7.4. Sales Footprint
            19.1.7.5. Strategy Overview
                19.1.7.5.1. Marketing Strategy
        19.1.8. DCN Diagnostics
            19.1.8.1. Overview
            19.1.8.2. Product Portfolio
            19.1.8.3. Profitability by Market Segments
            19.1.8.4. Sales Footprint
            19.1.8.5. Strategy Overview
                19.1.8.5.1. Marketing Strategy
        19.1.9. Ballya Bio
            19.1.9.1. Overview
            19.1.9.2. Product Portfolio
            19.1.9.3. Profitability by Market Segments
            19.1.9.4. Sales Footprint
            19.1.9.5. Strategy Overview
                19.1.9.5.1. Marketing Strategy
        19.1.10. PerkinElmer Inc.
            19.1.10.1. Overview
            19.1.10.2. Product Portfolio
            19.1.10.3. Profitability by Market Segments
            19.1.10.4. Sales Footprint
            19.1.10.5. Strategy Overview
                19.1.10.5.1. Marketing Strategy
20. Assumptions & Acronyms Used
21. Research Methodology
Recommendations

Healthcare

Multiplex Biomarker Imaging Market

June 2024

REP-GB-3526

280 pages

Healthcare

Neuro Immunoassay Market

July 2023

REP-GB-4293

306 pages

Healthcare

Cryptococcal Antigen Lateral Flow Assay Test Market

November 2024

REP-GB-1227

Upcoming

Healthcare

Cytotoxicity Assays Market

November 2024

REP-GB-10024

Upcoming

Explore Healthcare Insights

View Reports
Future Market Insights

Lateral Flow Assay Component Market

Schedule a Call