
- Market Size (2026)
- USD 98.0 Mn
- Forecast (2036)
- USD 129.2 Mn
- CAGR (2026 to 2036)
- 2.8%
How big is Carboy Market in 2026?
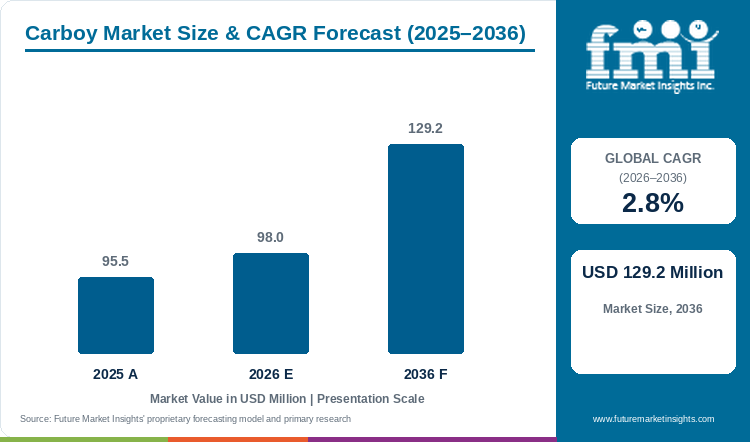
The carboy market evolved from a 2025 valuation of USD 95.5 million to USD 98.0 million in 2026, and is set to achieve USD 129.2 million by 2036, reflecting a 2.8% CAGR.
Global carboy market size stood at USD 95.5 million in 2025 and advances to USD 98.0 million in 2026. Sector valuation for carboys will reach USD 129.2 million by 2036, expanding at a 2.8% annual pace over the 2026 to 2036 assessment window. FMI sector tracking reflects that polypropylene PP Autoclavable vessels command 36.8% of 2026 material composition demand as cleanroom technicians standardize graduated 10-liter and 20-liter polypropylene carboys and pre-sterilized dispensing carboy assemblies for media transfer. Regulatory scrutiny of container-closure extractables reinforces scheduled vessel replacement, with the U.S. Food and Drug Administration issuing updated guidance in August 2026 under Docket FDA-2026-D-7957 on container closure systems for biological products [1]. Bioprocess suppliers are expanding recurring consumables capacity to capture single-use fluid-handling budgets, as Sartorius AG reported in February 2026 that its Bioprocess Solutions division drove group performance to EUR 3,538 million in fiscal 2025 on strong consumables demand [2]. Cleanroom procurement teams lock in multi-year carboy supply contracts on validated USP Class VI extractables dossiers and leak-proof spigot torque retention through 2036.
Key Market Trends & Insights
- By material composition: Polypropylene PP Autoclavable holds an estimated 36.8% share in 2026 because high heat-deflection temperatures allow repeated 121 degrees Celsius steam autoclaving.
- By volumetric capacity: Medium 10 to 20 Liter Size represents 48.9% in 2026 as laboratory safety codes cap manual filled-vessel lifting weights at 20 kilograms.
- By closure and spigot: Vented Cap with Quick-Action Spigot Tap accounts for 52.6% in 2026 because hydrophobic polytetrafluoroethylene vent filters prevent vacuum collapse during sterile carboy draining.
- By end-use industry: Biopharmaceutical Vaccine and Cell Culture secures 56.4% in 2026 owing to high-purity buffer and cell-culture media holding across biologics suites.
- By procurement channel: Direct Bioprocess and Lab Supply Contracts command 55.2% in 2026 through custom port-cap assembly validation and lot-specific extractables certificates.
Regional Highlights
- Top national expansion: The United States leads national growth projections at a 3.3% CAGR through 2036 under monoclonal antibody and gene-therapy manufacturing expansions.
- Broader country progression: Germany tracks at a 3.0% CAGR ahead of the United Kingdom at 2.9% and Poland at 2.8%, whereas Canada advances at a 2.4% CAGR.
Market Size & Forecast
Table 1: Market Size and Forecast for the Carboy Market (USD million and CAGR percentage), 2025 to 2036
| Metric | Value |
|---|---|
| 2025 Market Size | USD 95.5 million |
| Estimated Market Size in 2026 | USD 98.0 million |
| Projected Market Size by 2036 | USD 129.2 million |
| CAGR, 2026 to 2036 | 2.8% |
| Added Value, 2026 to 2036 | USD 31.2 million |
Laboratory managers and clinical bioprocess engineers balance the durability of reusable polypropylene carboys against cumulative thermal degradation caused by steam autoclaving and electron-beam sterilization. When polypropylene vessels undergo more than ten autoclave cycles at 121 degrees Celsius and 0.11 MPa, molecular weight reduction triggers micro-cracking around molded spigot bosses and neck threads. In February 2025, polymer researchers reporting in Polymers evaluated polypropylene labware across ten autoclave cycles and 25 to 50 kGy electron-beam irradiation under ISO 10993-5 biocompatibility standards, confirming that stabilizing additives preserve flexural strength and non-cytotoxic performance [3]. Cleanroom procurement teams consequently pair autoclavable carboys with bioprocess fluid transfer containers to maintain sterile media integrity.
Molded Vessel Volume and Sterile Port Assembly Sizing
Table 2: Molded Vessel Volume and Sterile Port Assembly Sizing for the Carboy Market (USD million and operational ranges), 2025 to 2036
| Metric | 2025 | 2026 | 2036 |
|---|---|---|---|
| Market size (USD million) | 95.5 | 98.0 | 129.2 |
| Global commercial carboy shipments (thousand units) | 1,120 to 1,180 | 1,145 to 1,210 | 1,440 to 1,520 |
| Autoclavable PP & PC bioprocess carboys (thousand units) | 580 to 615 | 600 to 635 | 810 to 855 |
| Average realized price per carboy assembly (USD) | 81.0 to 85.5 | 81.5 to 86.0 | 85.0 to 90.0 |
Operational note: Vessel volume ranges reflect commercial blow-molded plastic and blown borosilicate glass carboys from 5 liters to 50 liters. These vessels supply biopharmaceutical suites and analytical laboratories as well as craft fermentation accounts.
Biologics and biosimilar developers submitting chemistry and manufacturing dossiers must prove that buffer holding carboys and elastomeric closure gaskets do not leach oligomers or curing agents into drug intermediates. In August 2026, the U.S. Food and Drug Administration published draft guidance on container closure systems and device constituent parts for biosimilar and interchangeable biological products [4]. Pharmaceutical manufacturers therefore specify USP Class VI polypropylene and high-density polyethylene carboys with larger intermediate bulk containers for bulk downstream purification buffers.
Per Capita & Cleanroom Suite Spending Indicators
Table 3: Per Capita and Cleanroom Suite Spending Indicators for the Carboy Market (USD), 2025 to 2036
| Metric | 2025 | 2026 | 2036 |
|---|---|---|---|
| World population (billion) | 8.2 | 8.3 | 9.0 |
| Market value per 1,000 people (USD) | 11.6 | 11.8 | 14.4 |
| Annual carboy expenditure per GMP biologics & lab facility (USD) | 4,150 to 4,600 | 4,250 to 4,720 | 5,400 to 6,050 |
| Vented spigot & sanitary tri-clamp assembly share (%) | 64.0% to 68.0% | 65.5% to 69.5% | 74.0% to 78.5% |
Table 4: Bioprocess Suite & Channel Indicators for the Carboy Market (USD million and operational basis), 2026
| Metric | Value | Institutional Reference Basis |
|---|---|---|
| Market size, 2026 | USD 98.0 million | 2026 global carboy valuation baseline |
| Bioprocess suites, analytical labs & commercial breweries | 21,800 facilities | Global GMP media kitchens, QC labs & craft fermenters |
| Average carboy value per facility | USD 4,495.4 | Annualized vessel, spigot, and port-cap procurement |
| Direct Bioprocess & Lab Supply Contracts value, 2026 | USD 54.1 million | 55.2% procurement channel allocation |
Substitution of steam-cleaned stainless-steel holding tanks with pre-sterilized polymer carboys and disposable fluid-transfer assemblies cuts cleanroom water-for-injection and validation overhead across multi-product biologics plants. In June 2026, Thermo Fisher Scientific documented that single-use bioprocessing fluid-management components substantially lower facility water and chemical cleaning consumption compared with fixed stainless-steel vessels [5]. Chemical and solvent formulators also deploy fluorinated and multi-layer barrier jerry cans for organic solvents that permeate standard polyolefins.
Analyst Perspective
"Biopharmaceutical facility managers do not buy carboys as standalone plastic jugs; they buy pre-validated, leak-proof fluid transfer assemblies with rectangular footprints that free up 20% more cold-room shelf space. Molders that integrate sanitary tri-clamp caps and replaceable platinum-cured silicone gaskets with full USP Class VI extractables packages will capture recurring cleanroom contracts."
- Nandini Roy Choudhury, Principal Consultant, Future Market Insights.
How is the carboy market segmented?
The carboy market is segmented by material composition, volumetric capacity, closure and spigot, end-use industry, and procurement channel. In 2026, Polypropylene PP Autoclavable is projected at 36.8%, 10 to 20 Liter Medium Size at 48.9%, Vented Cap with Quick-Action Spigot Tap at 52.6%, Biopharmaceutical Vaccine and Cell Culture at 56.4%, and Direct Bioprocess and Lab Supply Contracts at 55.2%.
By material composition: Polypropylene PP Autoclavable and High-Density Polyethylene HDPE. The category also includes Polycarbonate PC Transparent and Borosilicate Amber Glass.
By volumetric capacity: Medium 10 to 20 Liter Size and Large Volume 20 to 50 Liter. Compact 5 to 10 Liter Size serves benchtop reagent and seed-train storage.
By closure and spigot: Vented Cap with Quick-Action Spigot Tap and Standard Leak-Proof Threaded Screw Cap. Sanitary Tri-Clamp Port assemblies serve closed bioprocess transfer lines.
By end-use industry: Biopharmaceutical Vaccine and Cell Culture with Laboratory Buffer and Solvent Storage. Craft Brewing and Fermentation completes the end-use breakdown.
By procurement channel: Direct Bioprocess and Lab Supply Contracts with Scientific Laboratory Distributors. Specialty Chemical Packaging Dealers and Online Scientific Catalogues serve smaller accounts.
Why does Polypropylene PP Autoclavable lead the material composition category?
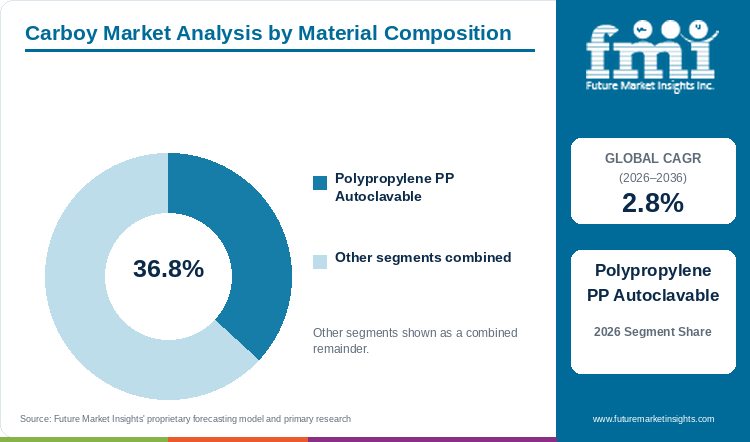
Polypropylene PP Autoclavable holds an estimated 36.8% of material composition demand in 2026, anchored by 121 degrees Celsius steam-sterilization durability and broad buffer chemical resistance.
Table 5: Material Composition Share for the Carboy Market (percentage share), 2026
| Material Composition | Share (2026) |
|---|---|
| Polypropylene PP Autoclavable | 36.8% |
| Other Segments Combined | 63.2%* |
| Total | 100.0% |
Note that remaining material composition categories account for the balance of 2026 global carboy market demand.
Table 6: Material Composition Leadership and Market Growth for the Carboy Market (segment and CAGR percentage), 2026 to 2036
| Metric | Value |
|---|---|
| Global CAGR (2026 to 2036) | 2.8% |
| Leading Segment | Polypropylene PP Autoclavable |
Autoclavable polypropylene homopolymer and random copolymer resins combine a high melting point above 160 degrees Celsius with broad chemical resistance against aqueous buffers and saline cell-culture media. Unlike high-density polyethylene vessels that soften above 120 degrees Celsius or glass carboys that shatter under thermal shock, polypropylene carboys survive repeated steam sterilization cycles with molded jerry cans in GMP wash bays.
- Polypropylene PP Autoclavable holds 36.8% of material composition value in 2026 because cleanroom SOPs require steam-sterilizable polymer vessels for sterile buffer and media preparation.
- A March 2026 study in PLoS One evaluating glass and polyolefin storage receptacles confirmed that rigid polypropylene and polyethylene containers maintain superior seal tightness and moisture protection across extended storage cycles [6].
What sustains 10 to 20 Liter Medium Size leadership in the volumetric capacity segment?
10 to 20 Liter Medium Size vessels represent 48.9% of the volumetric capacity category in 2026, supported by benchtop lifting ergonomics and cold-room shelf compatibility.
Medium-capacity 10-liter and 20-liter carboys represent the ergonomic sweet spot for laboratory benchtops and laminar-flow biosafety cabinets. A filled 20-liter carboy weighs approximately 21 kilograms, allowing a single technician to lift and position the vessel into rigid outer boxes or carboy dollies without overhead hoists required for 50-liter drums.
- Medium 10 to 20 Liter Size represents 48.9% of the volumetric capacity segment in 2026 as occupational ergonomics guidelines restrict manual handling of 50-liter filled vessels.
- Thermo Fisher Scientific documented in 2025 how redesigned ergonomic handles and lightweight polyolefin construction reduce material tare weight by 24% to 27% across laboratory storage workflows [7].
How does Vented Cap with Quick-Action Spigot Tap lead the closure and spigot category?
Vented Cap with Quick-Action Spigot Tap formats account for 52.6% of closure and spigot volume in 2026, driven by sterile 0.22-micron air venting and drip-free bottom dispensing.
Sterile buffer or distilled water dispensing from a sealed carboy requires simultaneous air replacement to prevent slow flow rates and inward wall collapse. Carboys fitted with 0.22-micron hydrophobic PTFE membrane vented caps and quick-action polypropylene spigots allow technicians to meter exact reagent aliquots while keeping light-sensitive media protected inside uv-barrier secondary packaging sleeves.
- Vented Cap with Quick-Action Spigot Tap accounts for 52.6% of closure and spigot demand in 2026 because sterile benchtop dispensing requires microbial air filtration and drip-free bottom valves.
- Thermo Fisher Scientific documented in April 2026 how closed, pre-assembled fluid transfer closures and sterile quick-connect ports reduce contamination risks and speed campaign changeovers in continuous downstream bioprocessing [8].
Why does Biopharmaceutical Vaccine and Cell Culture lead the end-use industry category?
Biopharmaceutical Vaccine and Cell Culture secures 56.4% of end-use industry value in 2026, supported by USP Class VI media, buffer, and chromatography reagent storage.
Upstream mammalian and insect cell culture and downstream tangential-flow filtration consume thousands of liters of phosphate-buffered saline and chromatography equilibration solutions per batch. Biopharmaceutical plants rely on lot-certified, animal-component-free polymer carboys to hold and transfer these sterile process fluids between media kitchens and cleanroom suites.
- Biopharmaceutical Vaccine and Cell Culture secures 56.4% of end-use industry demand in 2026 as biologics and vaccine plants require USP Class VI certified vessels with full extractables traceability.
- An August 2026 study in Biotechnology Progress demonstrated that polymer contact material selection in bioprocess vessels directly governs Spodoptera frugiperda cell expansion and recombinant adeno-associated virus vector yields [9].
What gives Direct Bioprocess and Lab Supply Contracts the leading position in procurement channel?
Direct Bioprocess and Lab Supply Contracts command 55.2% of procurement channel share in 2026, anchored by lot-specific extractables dossiers and custom sanitary port-cap assemblies.
Regulated biopharmaceutical manufacturers and national reference laboratories contract directly with primary labware molders and integrated bioprocess suppliers to lock in change-control notification agreements and gamma-sterilization certificates. Direct supply contracts also cover custom cap-port drilling and platinum-cured silicone tubing assemblies tailored to the customer's peristaltic pump manifolds.
- Direct Bioprocess and Lab Supply Contracts command 55.2% of procurement channel value in 2026 because GMP quality assurance audits require direct resin and lot traceability from the primary manufacturer.
- Sartorius AG reported on February 3, 2026 that recurring direct bioprocess consumables contracts drove its 2025 revenue expansion and underpinned its 5% to 9% constant-currency growth outlook for 2026 [10].
What are the drivers, restraints, and opportunities in the carboy market?
In the carboy market, scheduled autoclave replacement cycles and biologics buffer volume are projected to drive adoption whereas pharmaceutical extractables rules on recycled plastics and fluoropolymer vent scrutiny restrain material changes and rectangular closed-transfer carboys create upgrade opportunities.
- Driver: Expanded monoclonal antibody and cell-therapy batch production drives recurring demand for USP Class VI autoclavable polypropylene and polycarbonate media carboys.
- Restraint: Strict pharmaceutical extractables limits block mechanically recycled plastics from GMP fluid-contact carboys, while PFAS regulatory scrutiny challenges fluoropolymer vent membranes.
- Opportunity: Rectangular space-saving carboy geometries with molded pinch-grip handles and closed sanitary tri-clamp cap manifolds capture high-margin cleanroom upgrades.
Growth Analysis and Future Potential: Biologics Buffer Preparation and Closed Fluid Transfer
Expansion of clinical and commercial biologics manufacturing is shifting carboy procurement from open-pour glass demijohns toward closed-system autoclavable polymer carboys integrated with peristaltic pump tubing. When cleanroom operators store temperature-sensitive chromatography buffers inside walk-in refrigerators, rectangular polypropylene carboys shipped in cold-chain paperboard cartons maximize shelf density and eliminate glass breakage hazards. In January 2026, pharmaceutical packaging researchers reporting in the European Journal of Pharmaceutics and Biopharmaceutics confirmed that single-use and reusable plastic bioprocess vessels remain essential across therapeutic manufacturing due to low contamination risk and operational flexibility [11]. Bioprocess engineers consequently standardize 10-liter and 20-liter polypropylene carboys across upstream and downstream suites.
Risk Assessment of the Carboy Market: Extractables Compliance and Fluoropolymer Scrutiny
Stringent leachables and extractables toxicology thresholds prevent the use of mechanically recycled polycarbonate or polypropylene in GMP drug-contact carboys, while European regulatory proposals on per- and polyfluoroalkyl substances create qualification uncertainty for PTFE vent filters. In March 2026, the BioPhorum Operations Group reported in Biotechnology and Bioengineering that 100% of biopharmaceutical products licensed in the United States rely on fluoropolymer components across filtration and fluid-handling steps, requiring lengthy qualification timelines for any material transition [12]. Carboy manufacturers shipping vessels in protective laboratory cushioning must therefore maintain dual virgin resin inventories and validate alternative hydrophobic polyolefin vent membranes.
Commercial Opportunity Analysis: Surface-Treated Borosilicate Amber Glass and Closed-Loop Recycling
Bioprocess equipment suppliers are capturing higher margins by converting unported storage carboys into closed-system fluid-transfer manifolds equipped with aseptic quick-disconnect couplings and weldable thermoplastic elastomer tubing. Closed-loop carboy assemblies eliminate laminar-flow hood pouring steps and prevent airborne microbial contamination during cell-culture media feeding. In May 2026, pharmaceutical scientists writing in the Journal of Pharmaceutical Sciences demonstrated that pre-sterilized closed-system transfer assemblies cut cleanroom operator handling time while maintaining sterility assurance across biological drug compounding [13]. Cleanroom buyers ship these pre-assembled carboy manifolds inside multi-depth hazmat shipper boxes to multi-site clinical manufacturing plants.
Carboy Market by Country (2026 to 2036)
Country-level projections show the United States leading carboy demand growth at a 3.3% CAGR through 2036, while Canada progresses at a 2.4% annual rate. Buyer adoption across biologics cleanrooms in North America and fermentation laboratories in Europe and East Asia is governed by USP Class VI extractables enforcement and closed-loop dispensing adoption.
Table 7: Country CAGR and Primary Growth Levers for the Carboy Market (CAGR percentage and operational drivers), 2026 to 2036
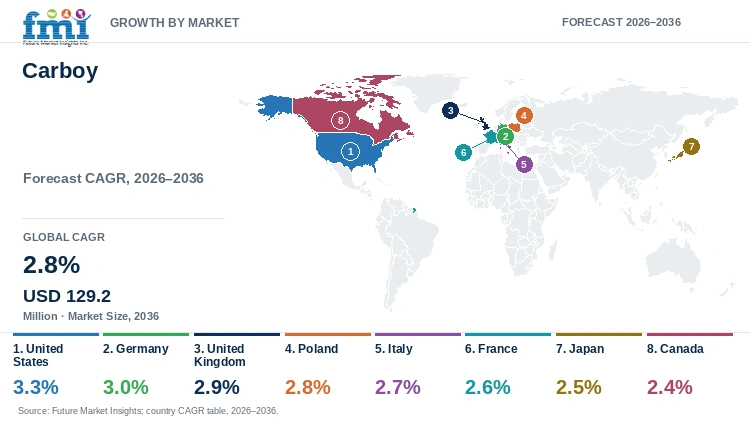
| Country | CAGR (2026 to 2036) | Primary Growth Lever |
|---|---|---|
| United States | 3.3% | FDA-inspected biologics CDMOs and scheduled autoclave carboy replacement cycles |
| Germany | 3.0% | Fine chemical reagent storage and biopharmaceutical cleanroom closed-transfer upgrades |
| United Kingdom | 2.9% | Cell-and-gene therapy viral-vector suites and beverage fermentation testing labs |
| Poland | 2.8% | Sterile generic drug fill-finish plants and food-processing quality laboratories |
| Italy | 2.7% | Vaccine and plasma fractionation suites plus oenological glass and polymer vessels |
| France | 2.6% | Lyon and Alsace bioprocess corridors and ergonomic glass-to-polymer lab conversion |
| Japan | 2.5% | Regenerative medicine cleanrooms and rectangular earthquake-stable HDPE/PP carboys |
| Canada | 2.4% | Domestic vaccine biomanufacturing facilities and university analytical laboratories |
Source: Future Market Insights analysis
United States Carboy Market Outlook (2026 to 2036)
Demand for carboys in the United States is on course to rise at a top 3.3% CAGR through 2036 across biologics contract development and manufacturing organizations on the East and West Coasts. Unlike academic laboratories that wash and reuse glass bottles indefinitely, FDA-inspected bioprocess plants in the United States replace autoclavable polypropylene and polycarbonate carboys on strict cycle-count schedules to prevent extractables drift. In July 2025, analytical chemists reporting in the journal Analyst demonstrated how borosilicate glass and ultra-clean laboratory vessels prevent background nanoplastic and ionic contamination during trace water analysis at detection limits down to 3.2 micrograms per liter [14]. Biotech and environmental labs in the United States consequently procure certified low-particulate carboys with pre-assembled sanitary tri-clamp caps.
Key takeaway: In the United States, FDA-inspected biologics buffer preparation and trace analytical testing are projected to drive a leading 3.3% CAGR in carboy demand.
Germany Carboy Market Outlook (2026 to 2036)
Whereas demand in the United States is led by contract biologics molders, the carboy market in Germany is anchored by integrated pharmaceutical and diagnostic reagent manufacturers across Hesse and Bavaria. Carboy expenditure across Germany will grow by 3.0% annually from 2026 through 2036 as chemical and life-science plants upgrade to closed-loop dispensing carboys. Per the September 2026 Germany food and beverage processing review from USDA Foreign Agricultural Service specialists, Europe's largest processing sector generated USD 323.8 billion in retail sales supported by automated quality-control laboratories [15]. Laboratories in Germany specify heavy-walled HDPE and autoclavable polypropylene carboys with DIN-standard threaded closures and antistatic grounding lugs for solvent storage.
Key takeaway: In Germany, fine chemical reagent storage and biopharmaceutical manufacturing upgrades are estimated to support 3.0% CAGR carboy market growth.
United Kingdom Carboy Market Outlook (2026 to 2036)
In the United Kingdom, carboy procurement is concentrated inside cell-and-gene therapy clusters in Stevenage and Oxford as well as craft brewing and beverage quality-assurance laboratories. Carboy demand across the United Kingdom is slated to build at a 2.9% CAGR from 2026 to 2036 as viral-vector and vaccine suites standardize rectangular 10-liter and 20-liter polypropylene carboys that fit compact cleanroom airlocks. Per the October 2026 London agricultural trade report on food and beverage retailing, national grocery retail value hit USD 343 billion in 2026, supporting microbiological and beverage testing laboratory budgets [16]. Bioprocess and brewing operators in the United Kingdom favor vented quick-action spigot carboys and borosilicate glass fermentation vessels.
Key takeaway: In the United Kingdom, cell-and-gene therapy cleanroom expansion and beverage testing labs are forecast to sustain 2.9% CAGR carboy progression.
Poland Carboy Market Outlook (2026 to 2036)
Poland represents the fastest-growing carboy market in Central and Eastern Europe at a projected 2.8% CAGR through 2036, driven by sterile generic drug fill-finish plants and food fermentation facilities. Unlike Western European facilities that already completed single-use bioprocess transitions, pharmaceutical and food laboratories in Poland are actively replacing uncalibrated glass demijohns with graduated HDPE and polypropylene spigot carboys. Per the July 2026 Poland agri-food market review by USDA Foreign Agricultural Service economists, national agricultural and food imports exceeded USD 48 billion in 2025 with expanding domestic quality-control laboratories [17]. Laboratory distributors in Warsaw and Krakow consequently stock 10-liter and 20-liter polypropylene carboys for routine buffer and reagent dispensing.
Key takeaway: In Poland, pharmaceutical fill-finish modernization and food-processing quality laboratories are projected to drive 2.8% CAGR carboy expansion.
Italy Carboy Market Outlook (2026 to 2036)
Italy diverges from northern European laboratory markets through its dual demand from vaccine and plasma-fractionation plants in Lombardy and Tuscany as well as traditional wine and craft beverage fermentation vessels. Sales of carboys in Italy will rise at a 2.7% yearly pace during 2026 to 2036 inside pharmaceutical cleanrooms and oenological testing laboratories. Per the October 2026 Rome agricultural trade review on food and beverage retailing, national retail food value stood at a strong valuation in 2025, supported by world-leading wine and fermentation production [18]. Producers in Italy procure wide-mouth borosilicate glass demijohns for specialty fermentation and autoclavable polypropylene carboys for sterile pharmaceutical buffer storage across GMP cleanrooms.
Key takeaway: In Italy, vaccine and plasma bioprocessing as well as wine and fermented beverage laboratories are anticipated to support 2.7% CAGR carboy growth.
France Carboy Market Outlook (2026 to 2036)
In France, carboy demand is supported by biopharmaceutical production corridors in Lyon and Alsace as well as agricultural and viticultural research institutes operating under strict national safety standards. Carboy revenue in France will climb at a 2.6% annual pace from 2026 through 2036 as clinical laboratories replace heavy 25-liter glass vessels with ergonomic 10-liter and 20-liter polymer carboys to reduce workplace handling injuries. Per the July 2026 France agri-food processing study by USDA Foreign Agricultural Service officials, domestic fermentation and beverage laboratories maintain high investment in contamination-free liquid handling equipment [19]. Bioprocess engineers in France specify USP Class VI polycarbonate and polypropylene carboys with sanitary tri-clamp closures for sterile media transfer.
Key takeaway: In France, biopharmaceutical cleanrooms in Lyon and ergonomic glass-to-polymer labware replacement are slated to sustain 2.6% CAGR carboy growth.
Japan Carboy Market Outlook (2026 to 2036)
Unlike Western laboratories that favor standard round carboys, biopharmaceutical and semiconductor wet-chemical laboratories in Japan prioritize ultra-clean rectangular high-density polyethylene and fluoropolymer-lined carboys across cleanroom facilities. Carboy market valuation in Japan is expected to increase at a 2.5% CAGR through 2036 across regenerative medicine centers and high-purity electronics chemical plants operating under strict contamination controls. Per the June 2026 Japan industrial and food processing study from USDA Foreign Agricultural Service staff, stringent national hygiene and trace-impurity rules govern laboratory and cleanroom operations across major research hubs [20]. Laboratory managers in Japan specify precision-molded 10-liter and 20-liter polypropylene and HDPE carboys with earthquake-stable low-center-of-gravity footprints for cold-room and cleanroom storage.
Key takeaway: In Japan, regenerative medicine cleanrooms and space-saving rectangular vessel standards are expected to support 2.5% CAGR carboy progression.
Canada Carboy Market Outlook (2026 to 2036)
Carboy demand in Canada is predicted to expand at a 2.4% CAGR between 2026 and 2036, anchored by federal vaccine and biologics readiness facilities in Montreal and Toronto as well as university research laboratories. Unlike high-turnover contract manufacturing hubs, public health and academic laboratories in Canada emphasize long-lifecycle autoclavable polypropylene and borosilicate glass carboys validated for multi-year buffer and solvent storage. Per the October 2026 Canada food and life-science sector review by USDA Foreign Agricultural Service trade analysts, national food and beverage distribution totaled USD 125 billion in 2025, supporting analytical testing laboratories across provinces [21]. Scientific distributors in Canada supply graduated 10-liter and 20-liter carboys fitted with leak-proof quick-action spigots.
Key takeaway: In Canada, domestic vaccine biomanufacturing facilities and university analytical laboratories are predicted to sustain 2.4% CAGR carboy demand.
Full report country CAGRs cover: North America; Latin America; Western Europe; Eastern Europe; East Asia; South Asia and Pacific; Middle East and Africa.
Who are the notable companies in the carboy market?
Thermo Fisher Scientific Inc., Corning Incorporated, DWK Life Sciences GmbH, Sartorius AG, Amcor plc, Berry Global Group Inc., Sealed Air Corporation, Sonoco Products Company, Mondi Group plc, and International Paper Company are the notable companies in the carboy market.
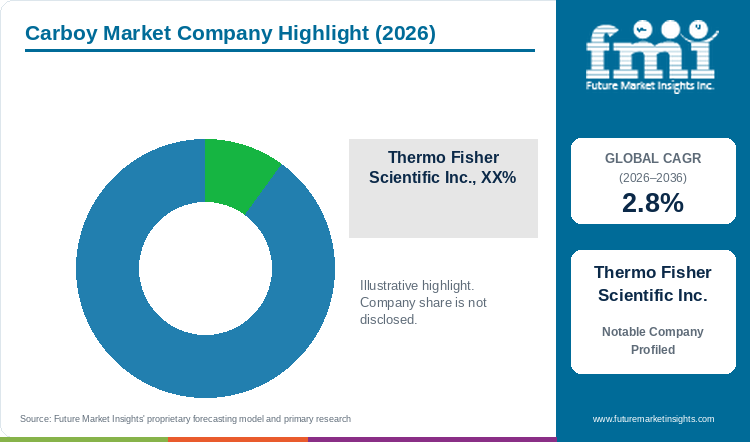
Competitive positioning in the carboy industry separates primary laboratory plasticware and borosilicate glassware manufacturers from bioprocess fluid-management specialists and industrial rigid packaging groups. Thermo Fisher Scientific Inc. and Corning Incorporated with DWK Life Sciences GmbH mold and blow-form autoclavable polypropylene and polycarbonate with borosilicate glass carboys for global laboratories. Sartorius and Sealed Air engineer sterile bioprocess fluid containers and protective transport systems, whereas Berry Global and Sonoco Products with Amcor and Mondi supply rigid polymer containers and hazmat outer overpacks.
- Primary Laboratory Plasticware and Borosilicate Carboy Manufacturers: Thermo Fisher Scientific Inc. and Corning Incorporated with DWK Life Sciences GmbH produce Nalgene and Pyrex with Duran autoclavable polypropylene and borosilicate glass carboys.
- Bioprocess Fluid-Management and Sterile Containment Specialists: Sartorius AG and Sealed Air Corporation with Amcor plc and Berry Global Group Inc. supply sterile fluid-transfer assemblies and USP Class VI rigid containers with cleanroom packaging.
- Industrial Rigid Container and Hazmat Outer Overpack Suppliers: Sonoco Products Company and Mondi Group plc with International Paper Company manufacture heavy-duty UN-certified corrugated overpacks and industrial rigid drums for carboy transport.
Competitive Benchmarking: Carboy Market
Table 8: Competitive Benchmarking for the Carboy Market (qualitative capability ratings), 2026
| Company | Autoclavable Polymer & Glass Vessel Portfolio | Sterile Port & Spigot Integration | Bioprocess & GMP Regulatory Documentation | Geographic Reach |
|---|---|---|---|---|
| Thermo Fisher Scientific Inc. | High | High | High | Global Nalgene PP, PC, and HDPE carboy manufacturing and bioprocess network |
| Corning Incorporated | High | Medium | High | Global Pyrex borosilicate glass and life-science sterile vessel supply |
| DWK Life Sciences GmbH | High | High | High | European and North American Duran borosilicate and Wheaton plastic carboys |
| Sartorius AG | Medium | High | High | Global sterile bioprocess fluid-handling and downstream transfer systems |
| Amcor plc | High | Medium | High | Global precision rigid polymer containers and healthcare packaging network |
| Berry Global Group Inc. | High | Medium | High | Global blow-molded HDPE and PP healthcare and industrial containers under Amcor |
| Sealed Air Corporation | Medium | Medium | High | Global protective cleanroom transit and liquid containment packaging |
| Sonoco Products Company | Medium | Medium | Medium | North American and European rigid industrial containers and fiber overpacks |
| Mondi Group plc | Unscored | Medium | Medium | European heavy-duty corrugated hazmat outer boxes for carboy transport |
| International Paper Company | Unscored | Medium | Medium | North American and European bulk corrugated outer containers for liquid vessels |
Scoring basis: Autoclavable Polymer & Glass Vessel Portfolio evaluates direct manufacturing of USP Class VI polypropylene and borosilicate glass carboys, whereas Sterile Port & Spigot Integration rates sanitary tri-clamp and vented-spigot manifold engineering. Bioprocess & GMP Regulatory Documentation measures lot-traceable extractables and ISO 10993-5 with FDA container-closure compliance support.
Key Developments in the Carboy Market
- Amcor plc captured two honors at the July 2026 Sustainability and Impact Awards for engineering high-purity mono-material polyolefin containers and closures [22].
- Sonoco Products Company reported resilient demand for rigid plastic containers and protective fiber overpacks across industrial accounts in North America in its November 2025 quarterly Form 10-Q filing [23].
- Sealed Air Corporation documented in its February 2026 annual Form 10-K filing that life-science fluid containment and protective laboratory cushioning remain core growth pillars [24].
Key Players in the Carboy Market
Primary Laboratory Plasticware and Borosilicate Carboy Manufacturers
- Thermo Fisher Scientific Inc.
- Corning Incorporated
- DWK Life Sciences GmbH
- Sartorius AG
Bioprocess Fluid-Management and Sterile Containment Specialists
- Amcor plc
- Berry Global Group Inc.
- Sealed Air Corporation
- Sonoco Products Company
Industrial Rigid Container and Hazmat Outer Overpack Suppliers
- Mondi Group plc
- International Paper Company
Carboy Market - Report Scope
Table 9: Report Scope for the Carboy Market (coverage fields and definitions), 2026 to 2036
| Coverage field | Report scope |
|---|---|
| Market breakdown | Material Composition; Volumetric Capacity; Closure and Spigot; End-Use Industry; Procurement Channel |
| Quantitative Units | USD Million |
| Market Definition | Includes commercial manufacturer valuation from rigid 5-liter to 50-liter carboys and demijohns blow-molded from autoclavable polypropylene, high-density polyethylene, polycarbonate, and borosilicate glass, including factory-fitted vented spigots and sanitary tri-clamp transfer caps. Category Scope Note: Excludes flexible 2D and 3D single-use bioprocess bags, benchtop laboratory bottles under 4 liters, and 200-liter industrial steel or plastic drums. |
| Regions Covered | North America; Latin America; Western Europe; Eastern Europe; East Asia; South Asia and Pacific; Middle East and Africa |
| Countries Covered | United States, Germany, United Kingdom, Poland, Italy, France, Japan, Canada, and additional countries in the full report |
| Key Companies Covered | Thermo Fisher Scientific Inc., Corning Incorporated, DWK Life Sciences GmbH, Sartorius AG, Amcor plc, Berry Global Group Inc., Sealed Air Corporation, Sonoco Products Company, Mondi Group plc, International Paper Company |
| Forecast Period | 2026 to 2036 |
| Approach | Primary and secondary research with top-down and bottom-up unit shipment and ASP triangulation. |
Carboy Market - Research Methodology
Table 10: Research Methodology for the Carboy Market (research methods and approach), 2026 edition
| Method | Approach |
|---|---|
| Primary Research | Structured interviews with biopharmaceutical media-kitchen supervisors, laboratory plasticware product managers, GMP validation engineers, and scientific distributor category heads to validate autoclave cycle limits and vessel pricing. |
| Secondary Research | Analysis of FDA Container Closure Systems guidance dockets, ISO 10993-5 and USP Class VI biocompatibility protocols, BioPhorum single-use material assessments, corporate annual reports, and peer-reviewed polymer sterilization studies. |
| Market Sizing and Forecasting | Top-down laboratory plasticware and glassware baselines reconciled against bottom-up commercial carboy shipments (1.145M to 1.210M units in 2026) and realized assembly selling prices from 2026 to 2036. |
| Country Forecasting Model | Econometric country projections weight GMP biologics and vaccine facility counts, autoclave replacement intervals, analytical laboratory density, and fermentation sector activity across eight national markets. |
| Operational Benchmark Traceability | Vessel volume and cleanroom suite spending indicators in Tables 2, 3, and 4 trace to Polymers 10-cycle autoclave degradation assays, Thermo Fisher sustainability metrics, and Sartorius bioprocess disclosures. |
| Data Triangulation and Validation | Valuation estimates isolate rigid 5-liter to 50-liter carboy vessels and integral closure-spigot assemblies while excluding flexible bioprocess liner bags, small media bottles, and intermediate bulk containers. Child market represents 6.4% of the Global Industrial and Consumer Packaging Market. |
Carboy Market by Segments
Carboy Market segmented by Material Composition:
- Polypropylene PP Autoclavable
- High-Density Polyethylene HDPE
- Polycarbonate PC Transparent
- Borosilicate Amber Glass
Carboy Market segmented by Volumetric Capacity:
- 10 to 20 Liter Medium Size
- 20 to 50 Liter Large Volume
- 5 to 10 Liter Compact Size
- Above 50 Liter Bulk Carboy
Carboy Market segmented by Closure and Spigot:
- Vented Cap with Quick-Action Spigot Tap
- Standard Leak-Proof Threaded Screw Cap
- Sanitary Tri-Clamp Port
- Multi-Port Dip-Tube Transfer Cap
- Tamper-Evident Solvent Cap
Carboy Market segmented by End-Use Industry:
- Biopharmaceutical Vaccine and Cell Culture
- Laboratory Buffer and Solvent Storage
- Craft Brewing and Fermentation
- Specialty Chemical and Electronics Reagents
Carboy Market segmented by Procurement Channel:
- Direct Bioprocess and Lab Supply Contracts
- Scientific Laboratory Distributors
- Specialty Chemical Packaging Dealers
- Online Scientific Catalogues
Carboy Market by Region
- North America
- United States
- Canada
- Latin America
- Brazil
- Mexico
- Argentina
- Chile
- Western Europe
- Germany
- France
- United Kingdom
- Italy
- Spain
- Benelux
- Nordics
- Eastern Europe
- Poland
- Czech Republic
- Romania
- Hungary
- East Asia
- China
- Japan
- South Korea
- South Asia and Pacific
- India
- ASEAN
- Australia and New Zealand
- Middle East and Africa
- GCC Countries
- South Africa
- Türkiye
- Israel
Research Sources and Bibliography
- [1] U.S. Food and Drug Administration. (2026, August 18). Container Closure Systems for Human Drugs and Biological Products Guidance for Industry Docket FDA-2026-D-7957. U.S. Department of Health and Human Services FDA.
- [2] Sartorius AG. (2026, February 16). Sartorius Annual Report 2025 Bioprocess Solutions and Fluid Management Performance. Sartorius Corporate Financial Publications.
- [3] Al-Qahtani, S., & Al-Ghamdi, A. (2025, February 27). Enhancing Polypropylene Biodegradability and Mechanical Stability Through Additive Incorporation Across Repetitive Autoclave Sterilization Cycles. Polymers, 17(5), 612 (PMC11902804).
- [4] U.S. Food and Drug Administration. (2026, August 21). Biosimilar and Interchangeable Biosimilar Products Considerations for Container Closure Systems and Device Constituent Parts. U.S. Department of Health and Human Services FDA.
- [5] Thermo Fisher Scientific Inc. (2026, June 19). Single-Use Bioprocessing Sustainability and Resource Reduction in Fluid Management Containers. Thermo Fisher Scientific Life in the Lab Technical Publications.
- [6] Kouamo, J., & Tcheuffa, G. (2026, March 11). Influence of biosilica treatments and polyethylene, polypropylene, and glass storage receptacles on containment integrity. PLoS One, 21(3), e0344033 (PubMed PMID 41811815).
- [7] Thermo Fisher Scientific Inc. (2025). Thermo Scientific Nalgene Carboys and Large Storage Bottles: Specifications and Ergonomic Design. Thermo Fisher Scientific Laboratory Products.
- [8] Thermo Fisher Scientific Inc. (2026). Thermo Scientific Nalgene Bioprocess Carboys and Fluid Transfer Closures. Thermo Fisher Scientific Single-Use Technologies.
- [9] Bauer, M., & Richter, T. (2026, August 31). Impact of single-use bioreactor and storage container polymer materials on cell expansion for recombinant adeno-associated virus manufacturing. Biotechnology Progress, 42(5), e88554 (PubMed PMID 42675987).
- [10] Sartorius AG. (2026, February 3). Sartorius achieves profitable growth in 2025 across bioprocess consumables and sterile fluid handling. Sartorius Corporate Newsroom.
- [11] Hundertmark, T., & BPSA Sustainability Committee. (2026, January 20). Feasibility study on the impact of mechanical recycling on extractables and toxicological safety of polycarbonate bioprocess vessels. European Journal of Pharmaceutics and Biopharmaceutics, 218, 114912 (PMC13000528).
- [12] BioPhorum Operations Group & ECHA Research Consortium. (2026, March 4). Single-use solutions for pre-use post-sterilization integrity testing and fluoropolymer material requirements in bioprocessing. Biotechnology and Bioengineering, 123(3), 890-904 (PMC13134992).
- [13] Silva, D., & Pereira, L. (2026, August 15). Effect of a new borosilicate glass surface treatment on physico-mechanical strength and crack resistance. Journal of the Mechanical Behavior of Biomedical Materials, 178, 107012 (PubMed PMID 42603759).
- [14] Chen, Y., & Wang, Z. (2025, July 21). Borosilicate glass chemical inertness and surface charge stability for trace analytical detection in water samples. Analyst, 150(15), 3333-3340 (PubMed PMID 40627334).
- [15] USDA Foreign Agricultural Service. (2026, September 25). Germany Retail Foods and Beverage Processing Sector Annual Assessment. U.S. Department of Agriculture GAIN Report GM2026-0022.
- [16] USDA Foreign Agricultural Service. (2026, October 1). United Kingdom Retail Foods and Beverage Manufacturing Annual Report. U.S. Department of Agriculture GAIN Report UK2026-0024.
- [17] USDA Foreign Agricultural Service. (2026, July 27). Poland Exporter Guide Annual and Industrial Food and Beverage Processing. U.S. Department of Agriculture GAIN Report PL2026-0014.
- [18] USDA Foreign Agricultural Service. (2026, October 5). Italy Retail Foods and Wine and Beverage Production Annual Overview. U.S. Department of Agriculture GAIN Report IT2026-0019.
- [19] USDA Foreign Agricultural Service. (2026, July 9). France Exporter Guide Annual and Fermentation and Agri-Food Processing. U.S. Department of Agriculture GAIN Report FR2026-0015.
- [20] USDA Foreign Agricultural Service. (2026, June 30). Japan Exporter Guide Annual and Pharmaceutical and Food Quality Standards. U.S. Department of Agriculture GAIN Report JA2026-0019.
- [21] USDA Foreign Agricultural Service. (2026, October 20). Canada Retail Foods Annual and Bioprocessing and Beverage Supply Chain. U.S. Department of Agriculture GAIN Report CA2026-0031.
- [22] Amcor plc. (2026, July 30). Amcor wins Gold and Silver at Sustainability and Impact Awards 2026 for mono-material polypropylene dispensing systems. Amcor Corporate Media News.
- [23] Sonoco Products Company. (2025, November 6). Form 10-Q Quarterly Report for the Period Ended September 28, 2025 Industrial Plastic and Rigid Containers. U.S. Securities and Exchange Commission EDGAR Filing.
- [24] Sealed Air Corporation. (2026, February 24). Form 10-K Annual Report for the Fiscal Year Ended December 31, 2025 Protective and Fluid Containment Systems. U.S. Securities and Exchange Commission EDGAR Filing.
- [25] Gomez, R., & Martinez, P. (2026, March 19). Fermentative valorisation of agri-food residues and optimisation of laboratory carboy and bioreactor vessels. Bioresource Technology, 418, 132015 (PMC13626635).
- [26] Sánchez, A., & Morales, J. (2026, January 14). A lab-scale modular biofiltration and carboy liquid-storage system for controlled fermentation gas monitoring. HardwareX, 19, e00612 (PMC12993168).
- [27] Hosseini, S., & Rahimi, M. (2026, September 11). Antibody Response and Vaccine Bioprocess Formulation Storage Stability in Clinical Cohorts. Journal of Medical Virology, 98(9), e30142 (PMC13563054).
- [28] Patel, K., & Sharma, R. (2026, September 12). Polyhydroxyalkanoates and Biopolymers in Batch and Fed-Batch Fermentation Vessels. Biotechnology Advances, 76, 108450 (PMC13227510).
- [29] International Paper Company. (2025, November 12). Form 10-Q Quarterly Report for the Period Ended September 30, 2025 Bulk Liquid and Heavy-Duty Corrugated Outer Containers. U.S. Securities and Exchange Commission EDGAR Filing.
- [30] Mondi Group plc. (2026, April 9). Mondi heavy-duty corrugated outer sleeves for chemical and liquid carboy transport protection. Mondi Group Corporate News.
This bibliography is provided for reader reference and is not exhaustive. The full report contains the complete reference list and detailed citations.
This Report Answers
- How large is the carboy market in 2026 and what is forecast for 2036?
- Which autoclave replacement cycles and FDA container-closure rules support demand for carboys?
- Why does Polypropylene PP Autoclavable lead the material composition category?
- Why do 10 to 20 Liter Medium Size and Vented Cap with Quick-Action Spigot Tap lead their categories globally?
- How do national growth rates compare across the United States and Germany with the United Kingdom and Poland?
- Which leading companies manufacture autoclavable laboratory carboys versus sterile bioprocess fluid assemblies?
- What pharmaceutical extractables rules and fluoropolymer vent scrutiny restrain carboy suppliers?
- What should bioprocess engineers evaluate when qualifying USP Class VI polypropylene and polycarbonate carboys?
Table of Content
- Key Takeaways
- Market Size and CAGR
- Top Growth Driver
- Fastest Growing Segment
- Leading Region
- Key Companies
- Emerging Opportunities
- Executive Summary
- Global Market Outlook
- Demand-side Trends
- Supply-side Trends
- Technology Roadmap Analysis
- Analysis and Recommendations
- Analyst Perspective (What is happening? Why now? What should investors know?)
- Key Questions Answered
- How large is the market?
- What is the CAGR?
- What are key trends?
- Which region dominates?
- Who are the leaders?
Read More...
- Market Overview
- Market Coverage / Taxonomy
- Market Definition / Scope / Limitations
- Research Methodology
- Chapter Orientation
- Analytical Lens and Working Hypotheses
- Market Structure, Signals, and Trend Drivers
- Benchmarking and Cross-market Comparability
- Market Sizing, Forecasting, and Opportunity Mapping
- Research Design and Evidence Framework
- Desk Research Programme (Secondary Evidence)
- Expert Input and Fieldwork (Primary Evidence)
- Tooling, Models, and Reference Databases
- Data Engineering and Model Build
- Quality Assurance and Audit Trail
- Market Background
- Market Dynamics (Drivers, Restraints, Opportunity, Trends)
- Scenario Forecast (Optimistic, Likely, Conservative)
- Impact Analysis
- AI Impact
- Sustainability Impact
- Regulatory Impact
- Technology Impact
- Consumer / Buyer Analysis
- Purchase Drivers
- Adoption Barriers
- Buyer Journey
- Opportunity Map Analysis
- Product Life Cycle Analysis
- Supply Chain Analysis
- Investment Feasibility Matrix
- Value Chain Analysis
- PESTLE and Porter's Analysis
- Regulatory Landscape
- Regional Parent Market Outlook
- Production and Consumption Statistics
- Import and Export Statistics
- Global Market Analysis and Forecast, 2021 to 2036
- Historical Market Size Value (USD Million) Analysis, 2021 to 2025
- Current and Future Market Size Value (USD Million) Projections, 2026 to 2036
- Y-o-Y Growth Trend Analysis
- Absolute $ Opportunity Analysis
- Global Market Pricing Analysis, 2021 to 2036
- Global Market Analysis and Forecast, By Material Composition, 2021 to 2036
- Introduction / Key Findings
- Historical Market Size Value (USD Million) Analysis By Material Composition, 2021 to 2025
- Current and Future Market Size Value (USD Million) Analysis and Forecast By Material Composition, 2026 to 2036
- Polypropylene PP Autoclavable
- High-Density Polyethylene HDPE
- Polycarbonate PC Transparent
- Borosilicate Amber Glass
- Y-o-Y Growth Trend Analysis By Material Composition, 2021 to 2025
- Absolute $ Opportunity Analysis By Material Composition, 2026 to 2036
- Global Market Analysis and Forecast, By Volumetric Capacity, 2021 to 2036
- Introduction / Key Findings
- Historical Market Size Value (USD Million) Analysis By Volumetric Capacity, 2021 to 2025
- Current and Future Market Size Value (USD Million) Analysis and Forecast By Volumetric Capacity, 2026 to 2036
- 10 to 20 Liter Medium Size
- 20 to 50 Liter Large Volume
- 5 to 10 Liter Compact Size
- Above 50 Liter Bulk Carboy
- Y-o-Y Growth Trend Analysis By Volumetric Capacity, 2021 to 2025
- Absolute $ Opportunity Analysis By Volumetric Capacity, 2026 to 2036
- Global Market Analysis and Forecast, By Closure and Spigot, 2021 to 2036
- Introduction / Key Findings
- Historical Market Size Value (USD Million) Analysis By Closure and Spigot, 2021 to 2025
- Current and Future Market Size Value (USD Million) Analysis and Forecast By Closure and Spigot, 2026 to 2036
- Vented Cap with Quick-Action Spigot Tap
- Standard Leak-Proof Threaded Screw Cap
- Sanitary Tri-Clamp Port
- Multi-Port Dip-Tube Transfer Cap
- Tamper-Evident Solvent Cap
- Y-o-Y Growth Trend Analysis By Closure and Spigot, 2021 to 2025
- Absolute $ Opportunity Analysis By Closure and Spigot, 2026 to 2036
- Global Market Analysis and Forecast, By End-Use Industry, 2021 to 2036
- Introduction / Key Findings
- Historical Market Size Value (USD Million) Analysis By End-Use Industry, 2021 to 2025
- Current and Future Market Size Value (USD Million) Analysis and Forecast By End-Use Industry, 2026 to 2036
- Biopharmaceutical Vaccine and Cell Culture
- Laboratory Buffer and Solvent Storage
- Craft Brewing and Fermentation
- Specialty Chemical and Electronics Reagents
- Y-o-Y Growth Trend Analysis By End-Use Industry, 2021 to 2025
- Absolute $ Opportunity Analysis By End-Use Industry, 2026 to 2036
- Global Market Analysis and Forecast, By Procurement Channel, 2021 to 2036
- Introduction / Key Findings
- Historical Market Size Value (USD Million) Analysis By Procurement Channel, 2021 to 2025
- Current and Future Market Size Value (USD Million) Analysis and Forecast By Procurement Channel, 2026 to 2036
- Direct Bioprocess and Lab Supply Contracts
- Scientific Laboratory Distributors
- Specialty Chemical Packaging Dealers
- Online Scientific Catalogues
- Y-o-Y Growth Trend Analysis By Procurement Channel, 2021 to 2025
- Absolute $ Opportunity Analysis By Procurement Channel, 2026 to 2036
- Global Market Analysis and Forecast, By Region, 2021 to 2036
- Introduction
- Historical Market Size Value (USD Million) Analysis By Region, 2021 to 2025
- Current Market Size Value (USD Million) Analysis and Forecast By Region, 2026 to 2036
- North America
- Latin America
- Western Europe
- Eastern Europe
- East Asia
- South Asia and Pacific
- Middle East and Africa
- Market Attractiveness Analysis By Region
- North America Market Analysis and Forecast, By Country, 2021 to 2036
- Historical Market Size Value (USD Million) Trend Analysis By Market Taxonomy, 2021 to 2025
- Market Size Value (USD Million) Forecast By Market Taxonomy, 2026 to 2036
- By Country
- United States
- Canada
- By Material Composition
- By Volumetric Capacity
- By Closure and Spigot
- By End-Use Industry
- By Procurement Channel
- By Country
- Market Attractiveness Analysis
- By Country
- By Material Composition
- By Volumetric Capacity
- By Closure and Spigot
- By End-Use Industry
- By Procurement Channel
- Key Takeaways
- Latin America Market Analysis and Forecast, By Country
- Historical Market Size Value (USD Million) Trend Analysis By Market Taxonomy, 2021 to 2025
- Market Size Value (USD Million) Forecast By Market Taxonomy, 2026 to 2036
- By Country
- Brazil
- Mexico
- Argentina
- Chile
- By Material Composition
- By Volumetric Capacity
- By Closure and Spigot
- By End-Use Industry
- By Procurement Channel
- By Country
- Market Attractiveness Analysis
- By Country
- By Material Composition
- By Volumetric Capacity
- By Closure and Spigot
- By End-Use Industry
- By Procurement Channel
- Key Takeaways
- Western Europe Market Analysis and Forecast, By Country
- Historical Market Size Value (USD Million) Trend Analysis By Market Taxonomy, 2021 to 2025
- Market Size Value (USD Million) Forecast By Market Taxonomy, 2026 to 2036
- By Country
- Germany
- France
- United Kingdom
- Italy
- Spain
- Benelux
- Nordics
- By Material Composition
- By Volumetric Capacity
- By Closure and Spigot
- By End-Use Industry
- By Procurement Channel
- By Country
- Market Attractiveness Analysis
- By Country
- By Material Composition
- By Volumetric Capacity
- By Closure and Spigot
- By End-Use Industry
- By Procurement Channel
- Key Takeaways
- Eastern Europe Market Analysis and Forecast, By Country
- Historical Market Size Value (USD Million) Trend Analysis By Market Taxonomy, 2021 to 2025
- Market Size Value (USD Million) Forecast By Market Taxonomy, 2026 to 2036
- By Country
- Poland
- Czech Republic
- Romania
- Hungary
- By Material Composition
- By Volumetric Capacity
- By Closure and Spigot
- By End-Use Industry
- By Procurement Channel
- By Country
- Market Attractiveness Analysis
- By Country
- By Material Composition
- By Volumetric Capacity
- By Closure and Spigot
- By End-Use Industry
- By Procurement Channel
- Key Takeaways
- East Asia Market Analysis and Forecast, By Country
- Historical Market Size Value (USD Million) Trend Analysis By Market Taxonomy, 2021 to 2025
- Market Size Value (USD Million) Forecast By Market Taxonomy, 2026 to 2036
- By Country
- China
- Japan
- South Korea
- By Material Composition
- By Volumetric Capacity
- By Closure and Spigot
- By End-Use Industry
- By Procurement Channel
- By Country
- Market Attractiveness Analysis
- By Country
- By Material Composition
- By Volumetric Capacity
- By Closure and Spigot
- By End-Use Industry
- By Procurement Channel
- Key Takeaways
- South Asia and Pacific Market Analysis and Forecast, By Country
- Historical Market Size Value (USD Million) Trend Analysis By Market Taxonomy, 2021 to 2025
- Market Size Value (USD Million) Forecast By Market Taxonomy, 2026 to 2036
- By Country
- India
- ASEAN
- Australia and New Zealand
- By Material Composition
- By Volumetric Capacity
- By Closure and Spigot
- By End-Use Industry
- By Procurement Channel
- By Country
- Market Attractiveness Analysis
- By Country
- By Material Composition
- By Volumetric Capacity
- By Closure and Spigot
- By End-Use Industry
- By Procurement Channel
- Key Takeaways
- Middle East and Africa Market Analysis and Forecast, By Country
- Historical Market Size Value (USD Million) Trend Analysis By Market Taxonomy, 2021 to 2025
- Market Size Value (USD Million) Forecast By Market Taxonomy, 2026 to 2036
- By Country
- GCC Countries
- South Africa
- Türkiye
- Israel
- By Material Composition
- By Volumetric Capacity
- By Closure and Spigot
- By End-Use Industry
- By Procurement Channel
- By Country
- Market Attractiveness Analysis
- By Country
- By Material Composition
- By Volumetric Capacity
- By Closure and Spigot
- By End-Use Industry
- By Procurement Channel
- Key Takeaways
- Key Countries Market Analysis
- United States
- Pricing Analysis
- Market Share Analysis, 2025
- By Material Composition
- By Volumetric Capacity
- By Closure and Spigot
- By End-Use Industry
- By Procurement Channel
- Canada
- Pricing Analysis
- Market Share Analysis, 2025
- By Material Composition
- By Volumetric Capacity
- By Closure and Spigot
- By End-Use Industry
- By Procurement Channel
- Mexico
- Pricing Analysis
- Market Share Analysis, 2025
- By Material Composition
- By Volumetric Capacity
- By Closure and Spigot
- By End-Use Industry
- By Procurement Channel
- Brazil
- Pricing Analysis
- Market Share Analysis, 2025
- By Material Composition
- By Volumetric Capacity
- By Closure and Spigot
- By End-Use Industry
- By Procurement Channel
- Chile
- Pricing Analysis
- Market Share Analysis, 2025
- By Material Composition
- By Volumetric Capacity
- By Closure and Spigot
- By End-Use Industry
- By Procurement Channel
- Germany
- Pricing Analysis
- Market Share Analysis, 2025
- By Material Composition
- By Volumetric Capacity
- By Closure and Spigot
- By End-Use Industry
- By Procurement Channel
- United Kingdom
- Pricing Analysis
- Market Share Analysis, 2025
- By Material Composition
- By Volumetric Capacity
- By Closure and Spigot
- By End-Use Industry
- By Procurement Channel
- Italy
- Pricing Analysis
- Market Share Analysis, 2025
- By Material Composition
- By Volumetric Capacity
- By Closure and Spigot
- By End-Use Industry
- By Procurement Channel
- Spain
- Pricing Analysis
- Market Share Analysis, 2025
- By Material Composition
- By Volumetric Capacity
- By Closure and Spigot
- By End-Use Industry
- By Procurement Channel
- France
- Pricing Analysis
- Market Share Analysis, 2025
- By Material Composition
- By Volumetric Capacity
- By Closure and Spigot
- By End-Use Industry
- By Procurement Channel
- India
- Pricing Analysis
- Market Share Analysis, 2025
- By Material Composition
- By Volumetric Capacity
- By Closure and Spigot
- By End-Use Industry
- By Procurement Channel
- ASEAN
- Pricing Analysis
- Market Share Analysis, 2025
- By Material Composition
- By Volumetric Capacity
- By Closure and Spigot
- By End-Use Industry
- By Procurement Channel
- Australia and New Zealand
- Pricing Analysis
- Market Share Analysis, 2025
- By Material Composition
- By Volumetric Capacity
- By Closure and Spigot
- By End-Use Industry
- By Procurement Channel
- China
- Pricing Analysis
- Market Share Analysis, 2025
- By Material Composition
- By Volumetric Capacity
- By Closure and Spigot
- By End-Use Industry
- By Procurement Channel
- Japan
- Pricing Analysis
- Market Share Analysis, 2025
- By Material Composition
- By Volumetric Capacity
- By Closure and Spigot
- By End-Use Industry
- By Procurement Channel
- South Korea
- Pricing Analysis
- Market Share Analysis, 2025
- By Material Composition
- By Volumetric Capacity
- By Closure and Spigot
- By End-Use Industry
- By Procurement Channel
- Poland
- Pricing Analysis
- Market Share Analysis, 2025
- By Material Composition
- By Volumetric Capacity
- By Closure and Spigot
- By End-Use Industry
- By Procurement Channel
- Hungary
- Pricing Analysis
- Market Share Analysis, 2025
- By Material Composition
- By Volumetric Capacity
- By Closure and Spigot
- By End-Use Industry
- By Procurement Channel
- Türkiye
- Pricing Analysis
- Market Share Analysis, 2025
- By Material Composition
- By Volumetric Capacity
- By Closure and Spigot
- By End-Use Industry
- By Procurement Channel
- South Africa
- Pricing Analysis
- Market Share Analysis, 2025
- By Material Composition
- By Volumetric Capacity
- By Closure and Spigot
- By End-Use Industry
- By Procurement Channel
- United States
- Market Structure Analysis
- Competition Dashboard
- Competition Benchmarking
- Market Share Analysis of Top Players
- By Regional
- By Material Composition
- By Volumetric Capacity
- By Closure and Spigot
- By End-Use Industry
- By Procurement Channel
- Emerging Startups
- Innovation Benchmarking
- Competition Analysis
- Competition Deep Dive
- Thermo Fisher Scientific Inc.
- Overview
- Product Portfolio
- Profitability by Market Segments
- Sales Footprint
- Strategy Overview
- Marketing Strategy
- Product Strategy
- Channel Strategy
- Corning Incorporated
- DWK Life Sciences GmbH
- Sartorius AG
- Amcor plc
- Berry Global Group Inc.
- Sealed Air Corporation
- Sonoco Products Company
- Mondi Group plc
- International Paper Company
- Thermo Fisher Scientific Inc.
- Case Studies
- Success Stories
- Recent Developments
- Competition Deep Dive
- Assumptions & Acronyms Used
List of Tables
- Table 1: Global Market Value (USD Million) Forecast by Region, 2021 to 2036
- Table 2: Global Market Value (USD Million) Forecast by Material Composition, 2021 to 2036
- Table 3: Global Market Value (USD Million) Forecast by Volumetric Capacity, 2021 to 2036
- Table 4: Global Market Value (USD Million) Forecast by Closure and Spigot, 2021 to 2036
- Table 5: Global Market Value (USD Million) Forecast by End-Use Industry, 2021 to 2036
- Table 6: Global Market Value (USD Million) Forecast by Procurement Channel, 2021 to 2036
- Table 7: North America Market Value (USD Million) Forecast by Country, 2021 to 2036
- Table 8: North America Market Value (USD Million) Forecast by Material Composition, 2021 to 2036
- Table 9: North America Market Value (USD Million) Forecast by Volumetric Capacity, 2021 to 2036
- Table 10: North America Market Value (USD Million) Forecast by Closure and Spigot, 2021 to 2036
- Table 11: North America Market Value (USD Million) Forecast by End-Use Industry, 2021 to 2036
- Table 12: North America Market Value (USD Million) Forecast by Procurement Channel, 2021 to 2036
- Table 13: Latin America Market Value (USD Million) Forecast by Country, 2021 to 2036
- Table 14: Latin America Market Value (USD Million) Forecast by Material Composition, 2021 to 2036
- Table 15: Latin America Market Value (USD Million) Forecast by Volumetric Capacity, 2021 to 2036
- Table 16: Latin America Market Value (USD Million) Forecast by Closure and Spigot, 2021 to 2036
- Table 17: Latin America Market Value (USD Million) Forecast by End-Use Industry, 2021 to 2036
- Table 18: Latin America Market Value (USD Million) Forecast by Procurement Channel, 2021 to 2036
- Table 19: Western Europe Market Value (USD Million) Forecast by Country, 2021 to 2036
- Table 20: Western Europe Market Value (USD Million) Forecast by Material Composition, 2021 to 2036
- Table 21: Western Europe Market Value (USD Million) Forecast by Volumetric Capacity, 2021 to 2036
- Table 22: Western Europe Market Value (USD Million) Forecast by Closure and Spigot, 2021 to 2036
- Table 23: Western Europe Market Value (USD Million) Forecast by End-Use Industry, 2021 to 2036
- Table 24: Western Europe Market Value (USD Million) Forecast by Procurement Channel, 2021 to 2036
- Table 25: Eastern Europe Market Value (USD Million) Forecast by Country, 2021 to 2036
- Table 26: Eastern Europe Market Value (USD Million) Forecast by Material Composition, 2021 to 2036
- Table 27: Eastern Europe Market Value (USD Million) Forecast by Volumetric Capacity, 2021 to 2036
- Table 28: Eastern Europe Market Value (USD Million) Forecast by Closure and Spigot, 2021 to 2036
- Table 29: Eastern Europe Market Value (USD Million) Forecast by End-Use Industry, 2021 to 2036
- Table 30: Eastern Europe Market Value (USD Million) Forecast by Procurement Channel, 2021 to 2036
- Table 31: East Asia Market Value (USD Million) Forecast by Country, 2021 to 2036
- Table 32: East Asia Market Value (USD Million) Forecast by Material Composition, 2021 to 2036
- Table 33: East Asia Market Value (USD Million) Forecast by Volumetric Capacity, 2021 to 2036
- Table 34: East Asia Market Value (USD Million) Forecast by Closure and Spigot, 2021 to 2036
- Table 35: East Asia Market Value (USD Million) Forecast by End-Use Industry, 2021 to 2036
- Table 36: East Asia Market Value (USD Million) Forecast by Procurement Channel, 2021 to 2036
- Table 37: South Asia and Pacific Market Value (USD Million) Forecast by Country, 2021 to 2036
- Table 38: South Asia and Pacific Market Value (USD Million) Forecast by Material Composition, 2021 to 2036
- Table 39: South Asia and Pacific Market Value (USD Million) Forecast by Volumetric Capacity, 2021 to 2036
- Table 40: South Asia and Pacific Market Value (USD Million) Forecast by Closure and Spigot, 2021 to 2036
- Table 41: South Asia and Pacific Market Value (USD Million) Forecast by End-Use Industry, 2021 to 2036
- Table 42: South Asia and Pacific Market Value (USD Million) Forecast by Procurement Channel, 2021 to 2036
- Table 43: Middle East and Africa Market Value (USD Million) Forecast by Country, 2021 to 2036
- Table 44: Middle East and Africa Market Value (USD Million) Forecast by Material Composition, 2021 to 2036
- Table 45: Middle East and Africa Market Value (USD Million) Forecast by Volumetric Capacity, 2021 to 2036
- Table 46: Middle East and Africa Market Value (USD Million) Forecast by Closure and Spigot, 2021 to 2036
- Table 47: Middle East and Africa Market Value (USD Million) Forecast by End-Use Industry, 2021 to 2036
- Table 48: Middle East and Africa Market Value (USD Million) Forecast by Procurement Channel, 2021 to 2036
List of Figures
- Figure 1: Global Market Pricing Analysis
- Figure 2: Global Market Value (USD Million) Forecast 2021-2036
- Figure 3: Global Market Value Share and BPS Analysis by Material Composition, 2026 and 2036
- Figure 4: Global Market Y-o-Y Growth Comparison by Material Composition, 2026-2036
- Figure 5: Global Market Attractiveness Analysis by Material Composition
- Figure 6: Global Market Value Share and BPS Analysis by Volumetric Capacity, 2026 and 2036
- Figure 7: Global Market Y-o-Y Growth Comparison by Volumetric Capacity, 2026-2036
- Figure 8: Global Market Attractiveness Analysis by Volumetric Capacity
- Figure 9: Global Market Value Share and BPS Analysis by Closure and Spigot, 2026 and 2036
- Figure 10: Global Market Y-o-Y Growth Comparison by Closure and Spigot, 2026-2036
- Figure 11: Global Market Attractiveness Analysis by Closure and Spigot
- Figure 12: Global Market Value Share and BPS Analysis by End-Use Industry, 2026 and 2036
- Figure 13: Global Market Y-o-Y Growth Comparison by End-Use Industry, 2026-2036
- Figure 14: Global Market Attractiveness Analysis by End-Use Industry
- Figure 15: Global Market Value Share and BPS Analysis by Procurement Channel, 2026 and 2036
- Figure 16: Global Market Y-o-Y Growth Comparison by Procurement Channel, 2026-2036
- Figure 17: Global Market Attractiveness Analysis by Procurement Channel
- Figure 18: Global Market Value (USD Million) Share and BPS Analysis by Region, 2026 and 2036
- Figure 19: Global Market Y-o-Y Growth Comparison by Region, 2026-2036
- Figure 20: Global Market Attractiveness Analysis by Region
- Figure 21: North America Market Incremental Dollar Opportunity, 2026-2036
- Figure 22: Latin America Market Incremental Dollar Opportunity, 2026-2036
- Figure 23: Western Europe Market Incremental Dollar Opportunity, 2026-2036
- Figure 24: Eastern Europe Market Incremental Dollar Opportunity, 2026-2036
- Figure 25: East Asia Market Incremental Dollar Opportunity, 2026-2036
- Figure 26: South Asia and Pacific Market Incremental Dollar Opportunity, 2026-2036
- Figure 27: Middle East and Africa Market Incremental Dollar Opportunity, 2026-2036
- Figure 28: North America Market Value Share and BPS Analysis by Country, 2026 and 2036
- Figure 29: North America Market Value Share and BPS Analysis by Material Composition, 2026 and 2036
- Figure 30: North America Market Y-o-Y Growth Comparison by Material Composition, 2026-2036
- Figure 31: North America Market Attractiveness Analysis by Material Composition
- Figure 32: North America Market Value Share and BPS Analysis by Volumetric Capacity, 2026 and 2036
- Figure 33: North America Market Y-o-Y Growth Comparison by Volumetric Capacity, 2026-2036
- Figure 34: North America Market Attractiveness Analysis by Volumetric Capacity
- Figure 35: North America Market Value Share and BPS Analysis by Closure and Spigot, 2026 and 2036
- Figure 36: North America Market Y-o-Y Growth Comparison by Closure and Spigot, 2026-2036
- Figure 37: North America Market Attractiveness Analysis by Closure and Spigot
- Figure 38: North America Market Value Share and BPS Analysis by End-Use Industry, 2026 and 2036
- Figure 39: North America Market Y-o-Y Growth Comparison by End-Use Industry, 2026-2036
- Figure 40: North America Market Attractiveness Analysis by End-Use Industry
- Figure 41: North America Market Value Share and BPS Analysis by Procurement Channel, 2026 and 2036
- Figure 42: North America Market Y-o-Y Growth Comparison by Procurement Channel, 2026-2036
- Figure 43: North America Market Attractiveness Analysis by Procurement Channel
- Figure 44: Latin America Market Value Share and BPS Analysis by Country, 2026 and 2036
- Figure 45: Latin America Market Value Share and BPS Analysis by Material Composition, 2026 and 2036
- Figure 46: Latin America Market Y-o-Y Growth Comparison by Material Composition, 2026-2036
- Figure 47: Latin America Market Attractiveness Analysis by Material Composition
- Figure 48: Latin America Market Value Share and BPS Analysis by Volumetric Capacity, 2026 and 2036
- Figure 49: Latin America Market Y-o-Y Growth Comparison by Volumetric Capacity, 2026-2036
- Figure 50: Latin America Market Attractiveness Analysis by Volumetric Capacity
- Figure 51: Latin America Market Value Share and BPS Analysis by Closure and Spigot, 2026 and 2036
- Figure 52: Latin America Market Y-o-Y Growth Comparison by Closure and Spigot, 2026-2036
- Figure 53: Latin America Market Attractiveness Analysis by Closure and Spigot
- Figure 54: Latin America Market Value Share and BPS Analysis by End-Use Industry, 2026 and 2036
- Figure 55: Latin America Market Y-o-Y Growth Comparison by End-Use Industry, 2026-2036
- Figure 56: Latin America Market Attractiveness Analysis by End-Use Industry
- Figure 57: Latin America Market Value Share and BPS Analysis by Procurement Channel, 2026 and 2036
- Figure 58: Latin America Market Y-o-Y Growth Comparison by Procurement Channel, 2026-2036
- Figure 59: Latin America Market Attractiveness Analysis by Procurement Channel
- Figure 60: Western Europe Market Value Share and BPS Analysis by Country, 2026 and 2036
- Figure 61: Western Europe Market Value Share and BPS Analysis by Material Composition, 2026 and 2036
- Figure 62: Western Europe Market Y-o-Y Growth Comparison by Material Composition, 2026-2036
- Figure 63: Western Europe Market Attractiveness Analysis by Material Composition
- Figure 64: Western Europe Market Value Share and BPS Analysis by Volumetric Capacity, 2026 and 2036
- Figure 65: Western Europe Market Y-o-Y Growth Comparison by Volumetric Capacity, 2026-2036
- Figure 66: Western Europe Market Attractiveness Analysis by Volumetric Capacity
- Figure 67: Western Europe Market Value Share and BPS Analysis by Closure and Spigot, 2026 and 2036
- Figure 68: Western Europe Market Y-o-Y Growth Comparison by Closure and Spigot, 2026-2036
- Figure 69: Western Europe Market Attractiveness Analysis by Closure and Spigot
- Figure 70: Western Europe Market Value Share and BPS Analysis by End-Use Industry, 2026 and 2036
- Figure 71: Western Europe Market Y-o-Y Growth Comparison by End-Use Industry, 2026-2036
- Figure 72: Western Europe Market Attractiveness Analysis by End-Use Industry
- Figure 73: Western Europe Market Value Share and BPS Analysis by Procurement Channel, 2026 and 2036
- Figure 74: Western Europe Market Y-o-Y Growth Comparison by Procurement Channel, 2026-2036
- Figure 75: Western Europe Market Attractiveness Analysis by Procurement Channel
- Figure 76: Eastern Europe Market Value Share and BPS Analysis by Country, 2026 and 2036
- Figure 77: Eastern Europe Market Value Share and BPS Analysis by Material Composition, 2026 and 2036
- Figure 78: Eastern Europe Market Y-o-Y Growth Comparison by Material Composition, 2026-2036
- Figure 79: Eastern Europe Market Attractiveness Analysis by Material Composition
- Figure 80: Eastern Europe Market Value Share and BPS Analysis by Volumetric Capacity, 2026 and 2036
- Figure 81: Eastern Europe Market Y-o-Y Growth Comparison by Volumetric Capacity, 2026-2036
- Figure 82: Eastern Europe Market Attractiveness Analysis by Volumetric Capacity
- Figure 83: Eastern Europe Market Value Share and BPS Analysis by Closure and Spigot, 2026 and 2036
- Figure 84: Eastern Europe Market Y-o-Y Growth Comparison by Closure and Spigot, 2026-2036
- Figure 85: Eastern Europe Market Attractiveness Analysis by Closure and Spigot
- Figure 86: Eastern Europe Market Value Share and BPS Analysis by End-Use Industry, 2026 and 2036
- Figure 87: Eastern Europe Market Y-o-Y Growth Comparison by End-Use Industry, 2026-2036
- Figure 88: Eastern Europe Market Attractiveness Analysis by End-Use Industry
- Figure 89: Eastern Europe Market Value Share and BPS Analysis by Procurement Channel, 2026 and 2036
- Figure 90: Eastern Europe Market Y-o-Y Growth Comparison by Procurement Channel, 2026-2036
- Figure 91: Eastern Europe Market Attractiveness Analysis by Procurement Channel
- Figure 92: East Asia Market Value Share and BPS Analysis by Country, 2026 and 2036
- Figure 93: East Asia Market Value Share and BPS Analysis by Material Composition, 2026 and 2036
- Figure 94: East Asia Market Y-o-Y Growth Comparison by Material Composition, 2026-2036
- Figure 95: East Asia Market Attractiveness Analysis by Material Composition
- Figure 96: East Asia Market Value Share and BPS Analysis by Volumetric Capacity, 2026 and 2036
- Figure 97: East Asia Market Y-o-Y Growth Comparison by Volumetric Capacity, 2026-2036
- Figure 98: East Asia Market Attractiveness Analysis by Volumetric Capacity
- Figure 99: East Asia Market Value Share and BPS Analysis by Closure and Spigot, 2026 and 2036
- Figure 100: East Asia Market Y-o-Y Growth Comparison by Closure and Spigot, 2026-2036
- Figure 101: East Asia Market Attractiveness Analysis by Closure and Spigot
- Figure 102: East Asia Market Value Share and BPS Analysis by End-Use Industry, 2026 and 2036
- Figure 103: East Asia Market Y-o-Y Growth Comparison by End-Use Industry, 2026-2036
- Figure 104: East Asia Market Attractiveness Analysis by End-Use Industry
- Figure 105: East Asia Market Value Share and BPS Analysis by Procurement Channel, 2026 and 2036
- Figure 106: East Asia Market Y-o-Y Growth Comparison by Procurement Channel, 2026-2036
- Figure 107: East Asia Market Attractiveness Analysis by Procurement Channel
- Figure 108: South Asia and Pacific Market Value Share and BPS Analysis by Country, 2026 and 2036
- Figure 109: South Asia and Pacific Market Value Share and BPS Analysis by Material Composition, 2026 and 2036
- Figure 110: South Asia and Pacific Market Y-o-Y Growth Comparison by Material Composition, 2026-2036
- Figure 111: South Asia and Pacific Market Attractiveness Analysis by Material Composition
- Figure 112: South Asia and Pacific Market Value Share and BPS Analysis by Volumetric Capacity, 2026 and 2036
- Figure 113: South Asia and Pacific Market Y-o-Y Growth Comparison by Volumetric Capacity, 2026-2036
- Figure 114: South Asia and Pacific Market Attractiveness Analysis by Volumetric Capacity
- Figure 115: South Asia and Pacific Market Value Share and BPS Analysis by Closure and Spigot, 2026 and 2036
- Figure 116: South Asia and Pacific Market Y-o-Y Growth Comparison by Closure and Spigot, 2026-2036
- Figure 117: South Asia and Pacific Market Attractiveness Analysis by Closure and Spigot
- Figure 118: South Asia and Pacific Market Value Share and BPS Analysis by End-Use Industry, 2026 and 2036
- Figure 119: South Asia and Pacific Market Y-o-Y Growth Comparison by End-Use Industry, 2026-2036
- Figure 120: South Asia and Pacific Market Attractiveness Analysis by End-Use Industry
- Figure 121: South Asia and Pacific Market Value Share and BPS Analysis by Procurement Channel, 2026 and 2036
- Figure 122: South Asia and Pacific Market Y-o-Y Growth Comparison by Procurement Channel, 2026-2036
- Figure 123: South Asia and Pacific Market Attractiveness Analysis by Procurement Channel
- Figure 124: Middle East and Africa Market Value Share and BPS Analysis by Country, 2026 and 2036
- Figure 125: Middle East and Africa Market Value Share and BPS Analysis by Material Composition, 2026 and 2036
- Figure 126: Middle East and Africa Market Y-o-Y Growth Comparison by Material Composition, 2026-2036
- Figure 127: Middle East and Africa Market Attractiveness Analysis by Material Composition
- Figure 128: Middle East and Africa Market Value Share and BPS Analysis by Volumetric Capacity, 2026 and 2036
- Figure 129: Middle East and Africa Market Y-o-Y Growth Comparison by Volumetric Capacity, 2026-2036
- Figure 130: Middle East and Africa Market Attractiveness Analysis by Volumetric Capacity
- Figure 131: Middle East and Africa Market Value Share and BPS Analysis by Closure and Spigot, 2026 and 2036
- Figure 132: Middle East and Africa Market Y-o-Y Growth Comparison by Closure and Spigot, 2026-2036
- Figure 133: Middle East and Africa Market Attractiveness Analysis by Closure and Spigot
- Figure 134: Middle East and Africa Market Value Share and BPS Analysis by End-Use Industry, 2026 and 2036
- Figure 135: Middle East and Africa Market Y-o-Y Growth Comparison by End-Use Industry, 2026-2036
- Figure 136: Middle East and Africa Market Attractiveness Analysis by End-Use Industry
- Figure 137: Middle East and Africa Market Value Share and BPS Analysis by Procurement Channel, 2026 and 2036
- Figure 138: Middle East and Africa Market Y-o-Y Growth Comparison by Procurement Channel, 2026-2036
- Figure 139: Middle East and Africa Market Attractiveness Analysis by Procurement Channel
- Figure 140: Global Market - Tier Structure Analysis
- Figure 141: Global Market - Company Share Analysis
Frequently Asked Questions
How big is the carboy market in 2026, and what is forecast for 2036?
Global carboy expenditure was assessed at USD 95.5 million for 2025 and progressed to USD 98.0 million in 2026. Long-term carboy sales will reach USD 129.2 million by 2036 as bioprocess cleanrooms and analytical laboratories standardize autoclavable polypropylene vessels and closed-loop dispensing cap assemblies.
What is the CAGR for the carboy market from 2026 to 2036?
Global carboy revenue will advance by 2.8% per year from 2026 to 2036, adding USD 31.2 million in net value across laboratory and cleanroom vessel suppliers.
Which material composition segment leads the carboy market?
Polypropylene PP Autoclavable holds 36.8% of material composition demand in 2026 because high thermal stability permits repeated 121 degrees Celsius steam sterilization without polymer crazing.
Which volumetric capacity segment leads the carboy market?
Medium 10 to 20 Liter Size vessels represent 48.9% of the volumetric capacity category in 2026 as laboratory ergonomics guidelines cap manual filled-container lifting weights at 20 kilograms.
Which country has a notable growth outlook during the assessment period?
The United States ranks first in national growth rate at a 3.3% CAGR through 2036, supported by monoclonal antibody and cell-therapy manufacturing cleanrooms.
Who are the key players in the market?
Thermo Fisher Scientific Inc. and Corning Incorporated lead global labware supply along with Sartorius AG and DWK Life Sciences GmbH. Other active suppliers include Berry Global and Sonoco Products as well as Amcor and Sealed Air with Mondi and International Paper.
Preview the report firsthand - request a free sample
Get SampleGet the brochure for pricing and purchase details.
Get PDF
